BDC Weekly Review: What We Expect In Q2 Earnings
cemagraphics
This article was first released to Systematic Income subscribers and free trials on July 1.
Welcome to another installment of our BDC Market Weekly Review, where we discuss market activity in the Business Development Company (“BDC”) sector from both the bottom-up – highlighting individual news and events – as well as the top-down – providing an overview of the broader market.
We also try to add some historical context as well as relevant themes that look to be driving the market or that investors ought to be mindful of. This update covers the period through the last week of June.
Be sure to check out our other Weeklies – covering the Closed-End Fund (“CEF”) as well as the preferreds/baby bond markets for perspectives across the broader income space. Also, have a look at our primer of the BDC sector, with a focus on how it compares to credit CEFs.
Market Action
BDCs had another good week with all but 3 names finishing higher. However, June still came in as the worst month since March of 2020 with a total return of around -7% in aggregate. The BDC sector continued to slowly recover some of its lost ground earlier in the year.
Systematic Income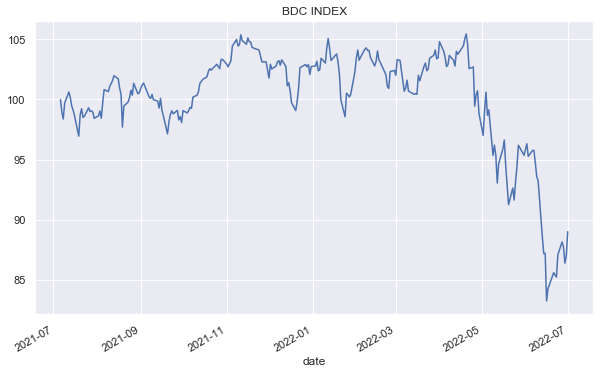
The average valuation bounced back from a sub-90% level to 92% as of this writing, which remains around 10% below its historical average. Obviously, with Q2 NAVs expected to come in a bit lower this is understated by a few percent, i.e., valuations based on Q2-NAVs will likely be closer to 95% in aggregate at current prices.
Systematic Income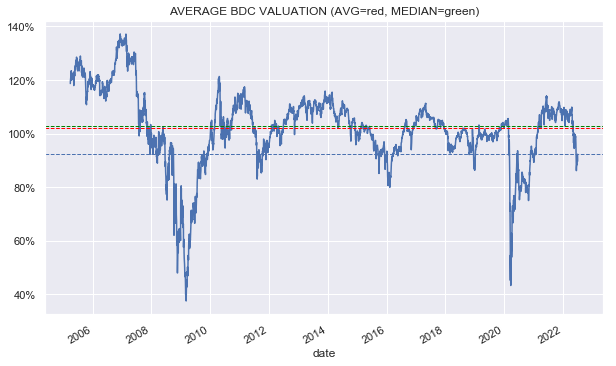
Market Themes
With the second quarter behind us, BDC investor attention turns to reporting results. And although results are still a few weeks away and, we obviously don’t have the exact details, there are a few things that are coming into clearer focus.
The first thing we expect is a further drop in NAVs. Over Q1, the average drop in the NAV was just 0.2% (the median drop was 0.4%). This was over the same period that loan ETFs fell around 1% and the S&P 500 fell 5.5%.
Systematic Income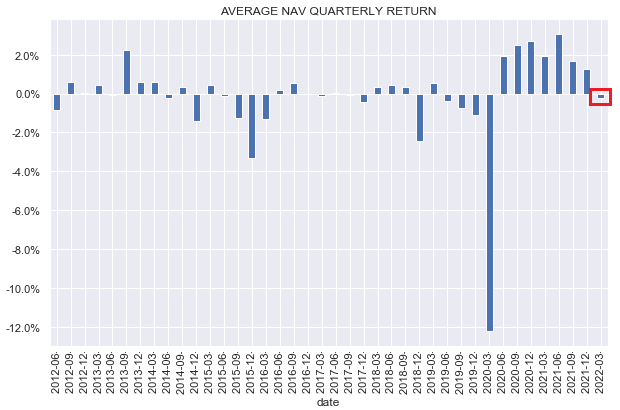
Q2 was a different story altogether. The S&P 500 fell 16.5% while loan ETFs fell 7% – clearly this points in the direction of substantially lower NAVs on average than we saw in Q1.
Another useful metric to look at is credit spreads, which we did in an earlier article. If we rerun the estimates based on what credit spreads did in Q2, we get a NAV drop across the sector of 2-3%.
BDCs with steeper drops in the NAV are more likely to be those with more conservative mark-to-model approaches (e.g. OCSL) as well as those with greater equity / warrant overweights. The average NAV quarterly change floor worth keeping in mind is a drop of 10% which is what we saw on average in Q1 of 2020. Credit spreads rose 3x more in that quarter than they did over Q2 of this year. Plus, the overall sentiment is clearly not as grim as it was then.
We also expect roughly flat net income for Q2. Short-term rates have not yet begun to benefit BDC income levels as they need to first rise sufficiently above LIBOR floors to offset the rise in credit facility costs which hit income levels since the start of the year given their lack of LIBOR floors. Plus, Q1 already saw a large drop in prepayment fees, so we don’t expect a similarly large drop in Q2. Overall, we expect a moderate drop in NAVs and a pretty flat level of income for the sector in Q2.
Market Commentary
Recently, we highlighted a couple of BDC strategies that are likely to underperform. One of them was the basic value trap approach to investing in BDCs which allocates primarily on the basis of valuation. So, of course, we saw an article in the commentariat highlighting the Apollo Investment Corp (AINV) as being a very attractive buy at its big discount to NAV.
As the following chart shows, AINV is one of the worst-performing BDCs over the last 5 years, so it has a large discount to NAV for a very good reason. In fact, arguably, its significant discount to NAV is not actually big enough to reflect the performance gap between it and the average BDC.
For instance, AINV has delivered 56% of the return of the average BDC in total NAV terms over the last 5 years (5.6% vs. 9.9% CAGR) while trading at a 76% valuation of the average BDC (70% vs. 92%). This suggests it’s still too expensive relative to the value it has generated.
Systematic Income BDC Tool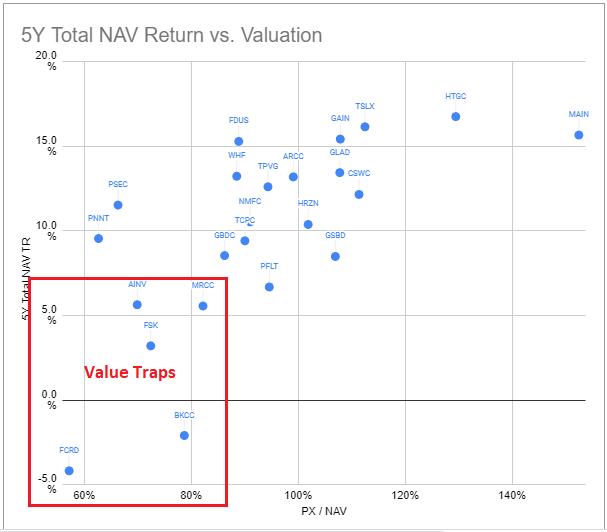
It’s possible to make the argument that some of these BDCs have changed their approach and that they should perform much better going forward, but the argument has to be made because the pattern of recent AINV returns does not at all show that its performance profile has improved relative to the sector.
Systematic Income BDC Tool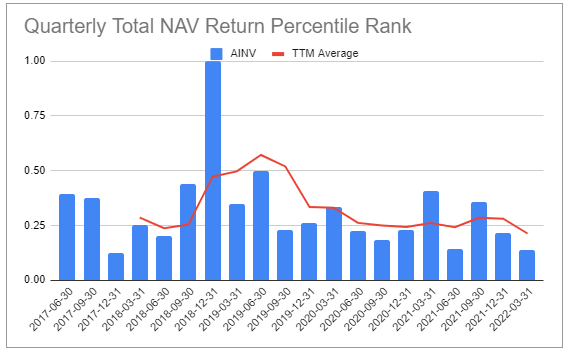
Arguably, we can make this argument for FSK whose performance has stepped up significantly from the previously dire period of 2017 to the middle of 2020 but not for AINV.
Systematic Income BDC Tool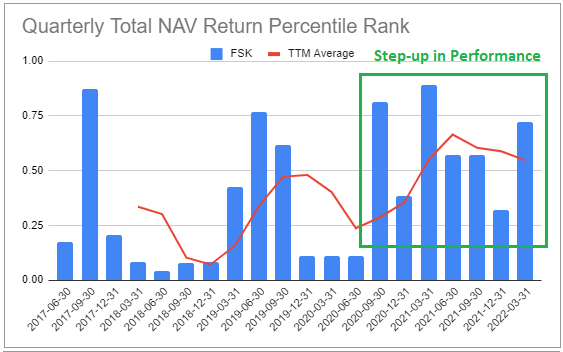
Stance & Takeaways
We have added to our BDC holdings during the recent dip, as well as made some rotations in the sector. However, we haven’t chased the recent rally in BDCs for a couple of reasons. First, leading macro indicators are painting a fairly bleak picture and, arguably, a likely recession is not yet priced in, at least looking at bottom-up earnings estimates. And two, the very likely drop in NAVs may cause some investors to lose confidence and drive a selling wave in the sector, which would push prices to more attractive levels.
We are also watching the Blackstone Secured Lending Fund (BXSL) specifically, whose last chunky lock-up of 50% of shares expired on 1-July and may drive some idiosyncratic weakness in the stock.
Separately, we consider the Fidus Investment Corp (FDUS), the Golub BDC (GBDC) and the Oaktree Specialty Lending Corp (OCSL) at valuations of 89%, 86% and 92% as still attractive for investors looking to enter the market at current levels.