XIU: The World’s First ETF Is Still A Buy (IUTSF) (XIU:CA)

Sundry Photography
Authors Note: All funds listed in Canadian currency unless otherwise noted.
Investment Thesis
The iShares S&P/TSX 60 Index ETF is the world’s oldest exchange traded fund. I personally use XIU as a convenient way to gain broad exposure to large cap Canadian equities. While I also hold selected dividend paying equities directly, this index-tracking ETF is a cost-effective way to participate in the Canadian industries and investment trends that have driven the growth of the Toronto Stock Exchange. XIU’s concentration of large cap Canadian holdings have outperformed the broader S&P/TSX Composite Index over the past 10 years.
XIU as the World’s First ETF
In 1989, there was a failed attempt to launch an S&P 500 index fund that had the trading properties of a stock, rather than a mutual fund. This vehicle was structured as a participation shares fund on the Philadelphia stock exchange. Unfortunately, this S&P 500 proxy was derailed by a Chicago court that ruled the new vehicle acted much like a futures contract and would therefore need to be traded on a futures exchange.
The following year, in March 1990, a successful attempt saw the world’s first ETF listed on the Toronto Stock Exchange in Canada. This product was called “TIPs” (Toronto 35 Index Participation Fund) tracking the TSX 35 index. The TIPs ETF started trading nearly three years before the first U.S. ETF, the SPDR S&P 500 ETF (SPY) was listed on January 29, 1993. The TIPS ETF evolved from its original form as was merged with the “HIPs” (Hundred Index Participation Fund) on March 7, 2000 to track the TSX 100 index. This amalgamation became the iUnits S&P/TSE Index Participation Fund, which has since been renamed the iShares S&P/TSX 60 Index ETF (XIU:CA). Today, the Canadian ETF market has CAD $300B in assets under management. About 4% of the US $5.7T global market.
Fund Overview
The iShares S&P/TSX 60 Index ETF is the largest and one of the most liquid ETFs in Canada. Focused on capital appreciation, the fund seeks to replicate the performance of the S&P/TSX 60 Index. This is an all-equity fund holding sixty of the largest publicly traded companies on the Toronto Stock Exchange. Trading in its current form since 1999, XIU has attracted $11.5B in assets under management. XIU trades on the TSX with average volume of approximately 4.5M units daily. As one of the most traded ETFs in Canada, it has a good bid ask spread of just .03%. XIU has a Management Fee of 0.15% and a Management Expense Ratio of 0.18% making it a low-cost option.
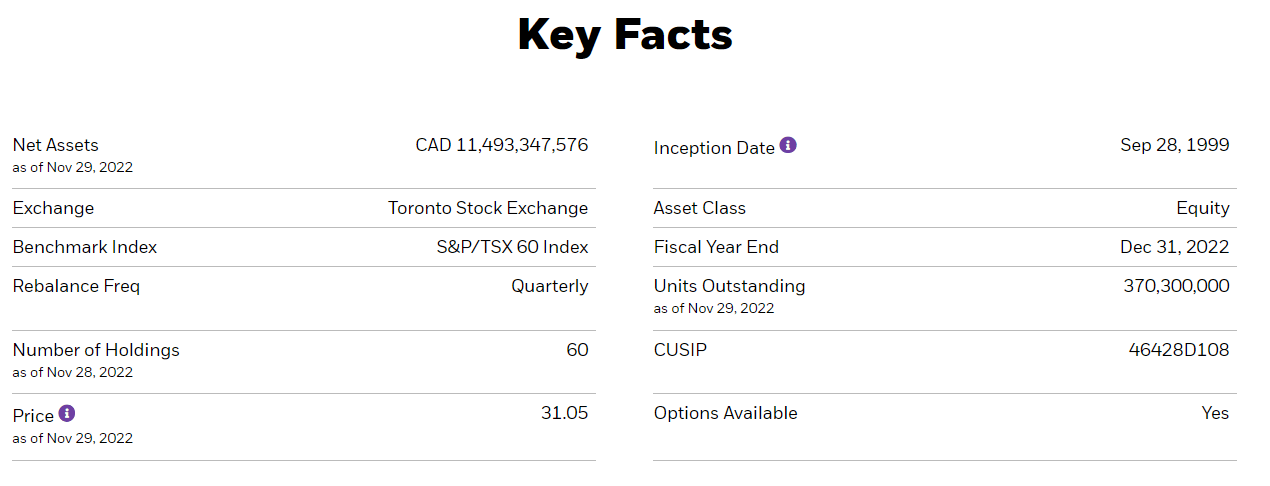
XIU Key Facts (iShares)
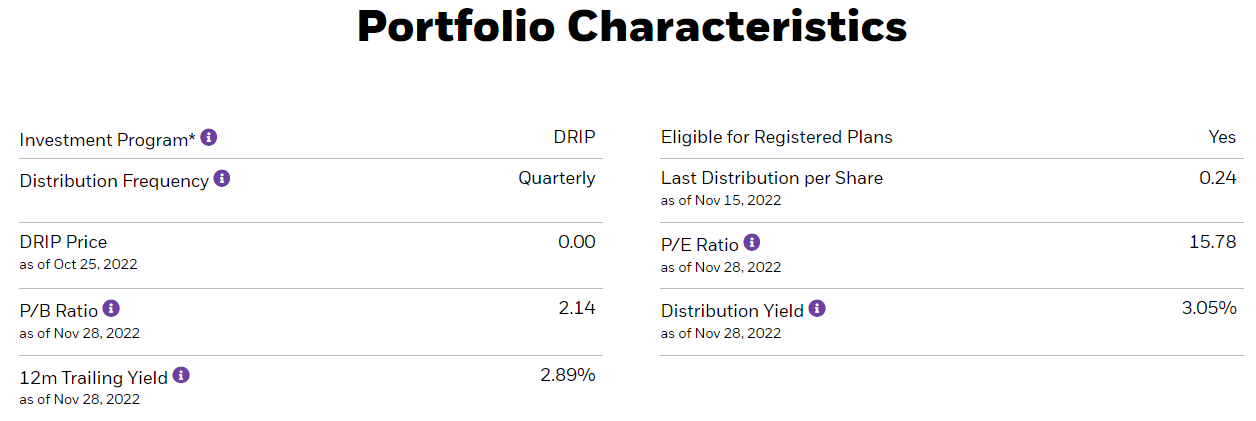
XIU Portfolio Characteristics (iShares)
S&P/TSX 60 Index
XIU seeks to replicate the performance of the S&P/TSX 60 Index. The S&P/TSX 60 Index is governed by S&P Global (formerly Standard and Poor’s). The index composition is reviewed by an index committee that aims to act as a subset of the S&P/TSX Composite Index representing large cap companies traded on the Toronto Stock Exchange adjusted for sector balance. This sector balancing is a nuanced, but important caveat, as it indicated that the index is not simply the largest 60 companies by market capitalization but is tweaked to compensate for sector overrepresentation.
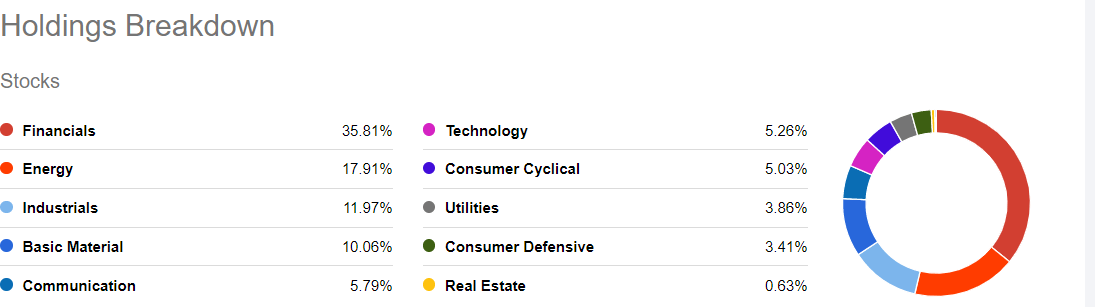
XIU Holdings Breakdown (Seeking Alpha)
The criteria regarding index composition starts with the largest securities on the TSX by share float and turnover. It is important to note that the biggest market capitalization doesn’t necessarily equate to the biggest share float. This criterion serves to remove some large cap companies with smaller share float due to high family share ownership, or high portions of illiquid executive or employee share ownership. An example of this selection is Brookfield Renewable Partners L.P. (BEP.UN:CA) with a market capitalization of $26B, but a relatively small float due to the large ownership stake of its parent company Brookfield Asset Management (BAM).
The index committee’s discretion to include or exclude companies based on sector balance is a result of the TSX’s heavy weighting in the financial, energy and materials sectors. In practice, this view to sector balance eliminates additional financial or energy companies from joining the index, even when they are larger by market capitalization than other candidates from underrepresented sectors. One victim of this industry allocation adjustment is Great-West Lifeco Inc. (GWO:CA) with a market cap of $28B, several times larger by market capitalization than XIU constituents such as Gildan Activewear Inc. (GIL) at $7B or SNC-Lavalin Group Inc. (SNC:CA) at a mere $4B in market capitalization. These inclusion decisions are overt attempts to grow the underrepresented consumer discretionary and industrial sectors respectively at the expense of the already enormous financial sector that accounts for more than one third of XIU’s holdings.
According to S&P Global, minimum index turnover is preferable. Additions and deletions to the S&P TSX 60 Index are usually the result of mergers or acquisitions. A company can also be removed when it no longer meets liquidity or market capitalization requirements or undergoes other corporate actions that remove it from eligibility. An example of this is Valeant Pharmaceuticals Ltd that briefly became Canada’s most valuable company by market capitalization in 2015 and 2016 before losing nearly all of its market capitalization and being absorbed by Bausch Health Companies (BHC) in a scandal-laden demise.
Performance
XIU has a 10-year average return of 7.85% and has achieved 7.08% since inception in 1999. $10,000 invested 10 years ago would be worth approximately $23,600, while the same amount invested at inception would be worth approximately $54,000.
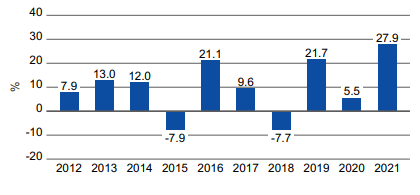
XIU Performance (iShares)
Since inception, XIU has delivered comparable returns to the S&P 500. It is worth noting however, that this is largely a result of XIU’s inception coinciding with the dotcom bubble that wreaked havoc in the U.S. stock market. Over most time frames, the S&P 500 has outperformed the TSX S&P 60 Index by a wide margin.
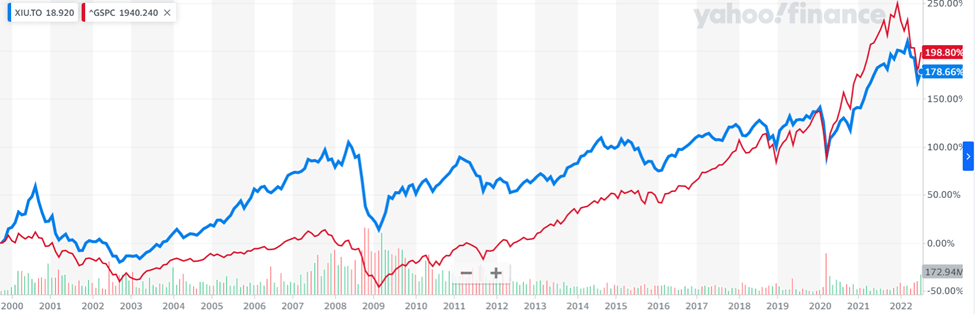
XIU Performance vs S&P 500 (Yahoo Finance)
While the U.S markets have outperformed Canadian markets in the long run, the S&P TSX 60 has demonstrated resilience in the recent market downturn. XIU is down around 4% YTD against the S&P 500 decline of over 14% over the same period.
Distribution Yield
XIU has a distribution yield of 3.11% and a 12-month trailing yield of 2.89%. This is considerably higher than the distribution yields of ETFs that track major U.S. indices such as SPY, with a forward yield of 1.55%. This is unsurprising given that XIU is comprised of mature banks, energy, telecoms, and pipelines, etc. that emphasize dividend payouts compared to the U.S. market with greater exposure to large technology firms that have used cash flow for growth rather than rewarding shareholders.
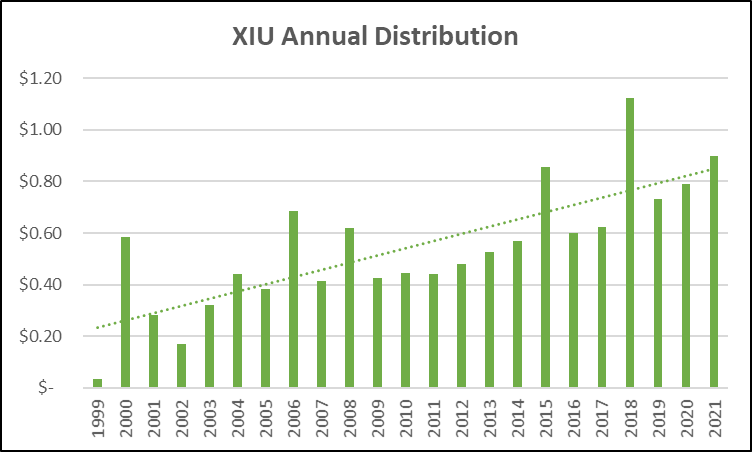
XIU Distribution History (Data source: iShares, Graph: Author)
XIU has paid a distribution quarterly since inception with steady compound annual dividend growth of 6.35% over the past 10 years. Although XIU has a yield of almost double SPY, the S&P 500 has outpaced the S&P TSX 60 dividend growth with a 10-year CAGR of 8.03%.
Alternative ETFs
XIU is one of the few funds in Canada that tracks the S&P/TSX 60 Index directly. Other large ETFs in Canada track the broader S&P/TSX Composite Index. Another iShares fund, iShares Core S&P/TSX Capped Composite Index ETF (XIC:CA) is the second largest ETF in Canada. Similar funds tracking the broader S&P/TSX Composite Index are offered by major ETF providers including BMO and Vanguard. These are the BMO S&P/TSX Capped Composite Index ETF (ZCN:CA) and the Vanguard FTSE Canada All Cap Index ETF (VCN:CA) respectively. As ZCN and VCN are similar to XIC, I will stick with the iShares XIC for comparison.
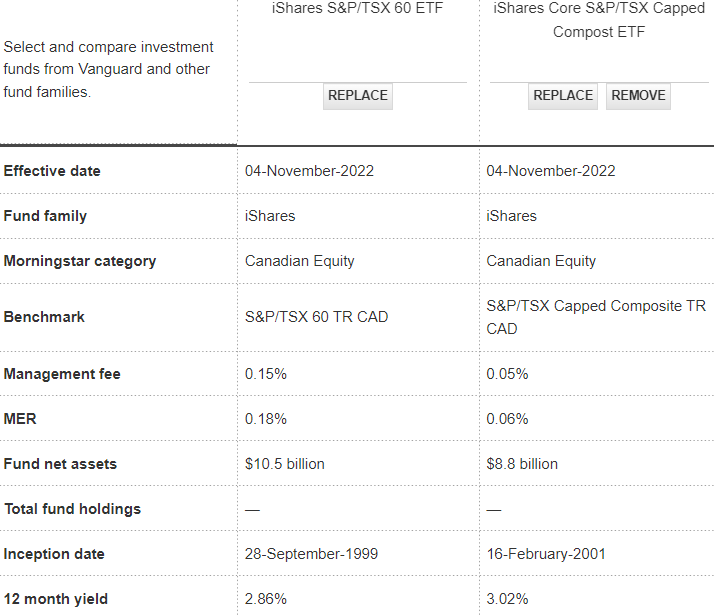
XIU vs XIC (Vanguard)
XIC has one of the lowest fees among Canadian ETFs with an MER of just .06%, compared to XIU’s 0.18%. The iShares Core S&P/TSX Capped Composite Index also has a slightly higher yield than XIU, at 3.02% vs 2.86%. Despite having higher fees and a lower yield, the iShares S&P/TSX 60 Index ETF outperformed the S&P/TSX Capped Composite Index ETF over the past 10 years. XIU has achieved average annual returns of 8.28% compared to 7.71% for XIC.
With 236 holdings, XIC holds 95% of all Canadian companies on the Toronto Stock Exchange. Compared to XIC, XIU lacks small cap exposure. Less established, smaller cap companies tend to grow earnings at higher rates than larger more mature firms. This exposure to more small cap and mid cap names also results in XIC being more diversified by sector than XIU. While still heavily concentrated in the financial and energy segments, XIC has about 5% less exposure to these two sectors than XIU does.
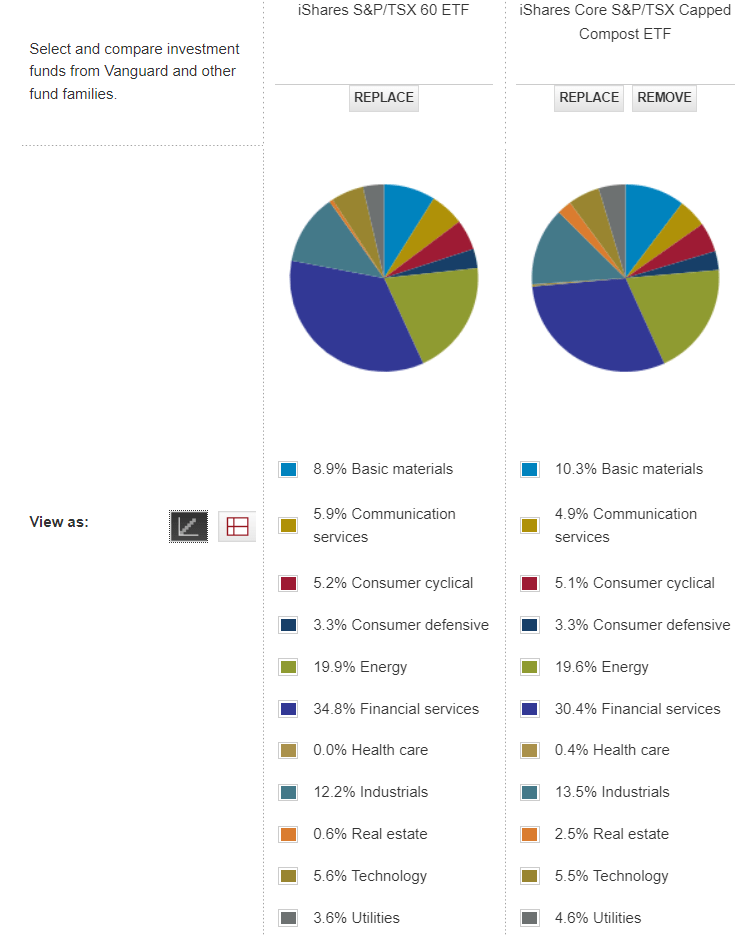
XIU vs XIC Holdings (Vanguard)
Risk Analysis
Investing in an ETF such as XIU with 60 individual holdings largely mitigates company specific risk by providing reasonable diversification. Potential concerns for holders of XIU are largely sector specific or macro-economic risks.
One of the potential headwinds for the Canadian economy is continued high inflation and rising interest rates. Canada’s large banks have significant exposure to the mortgage market. A sharp downturn in the Canadian mortgage market driven by higher interest rates would hurt the S&P/TSX 60 Index.
Another macroeconomic risk to note is the threat of trade and manufacturing competition with the U.S.; Canada’s largest trading partner. The current U.S. administration’s “Buy American” sentiment has been manifested in recent legislation such as the Build Back Better Act which will favour U.S. firms and materials for infrastructure projects and electric car manufacturing. While this sentiment has the potential to negatively affect some of Canada’s industrial production, much of this has been mitigated through lobbying efforts. For example, in July the U.S. Senate backed a bill that included the expansion of tax credits for electric vehicles produced in North America that does not exclude against vehicles manufactured in Canada.
On a valuation basis, the S&P/TSX 60 trades at under 16X, while the S&P 500 index is trading at over 21X. This attractive valuation provides a measure of safety should a purchase of XIU miss out on favourable sector performance in the short term. Lastly, XIU, like all other broad TSX index ETFs lacks exposure to some sectors such as consumer discretionary, healthcare and technology.
Investor Takeaways
The iShares S&P/TSX 60 Index ETF is a convenient and low-cost way to gain broad exposure to the large cap Canadian equities that have fueled the growth of the Toronto Stock Exchange. XIU’s concentration of large cap Canadian holdings has outperformed the broader S&P/TSX Composite Index over the past 10 years. The world’s oldest ETF is still a great way to participate in the Canadian equity market.