Weekly Closed-End Fund Roundup: June 19, 2022
tdub303/E+ via Getty Images
Author’s note: This article was released to CEF/ETF Income Laboratory members on June 21st, 2022. Please check latest data before investing.
The Weekly Closed-End Fund Roundup will be put out at the start of each week to summarize recent price movements in closed-end fund [CEF] sectors in the last week, as well as to highlight recently concluded or upcoming corporate actions on CEFs, such as tender offers. Data is taken from the close of Friday, June 10th, 2022.
Weekly performance roundup
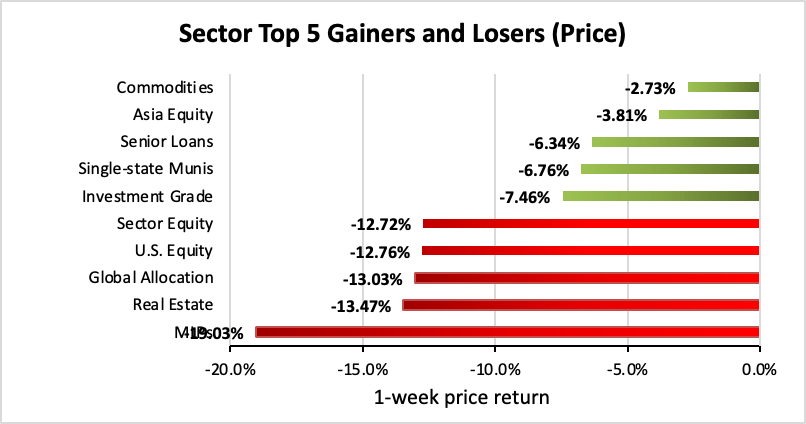
The bear market has arrived! 0 out of 23 sectors were positive on price (down from 1 last week) and the average price return was -9.59% (down from -2.13% last week). The lead gainer was Commodities (-2.73%) while MLPs lagged (-19.03%).
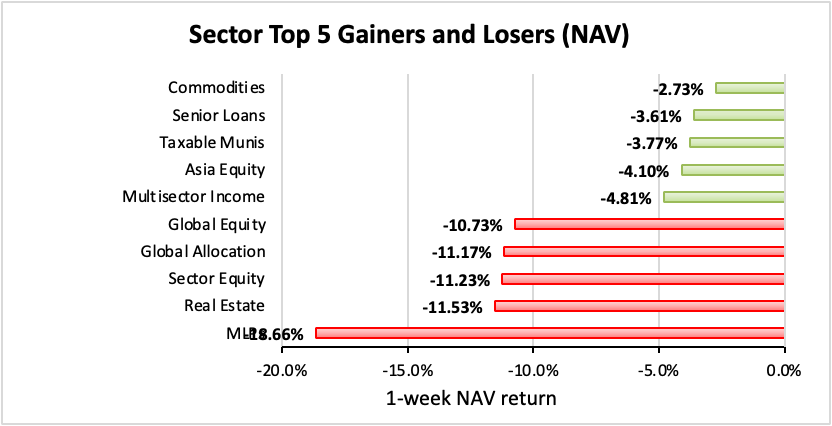
0 out of 23 sectors were positive on NAV (same as last week), while the average NAV return was -9.59% (down from -2.32% last week). The top sector by NAV was Commodities (-2.73%) while the weakest sector by NAV was MLPs (-18.66%).
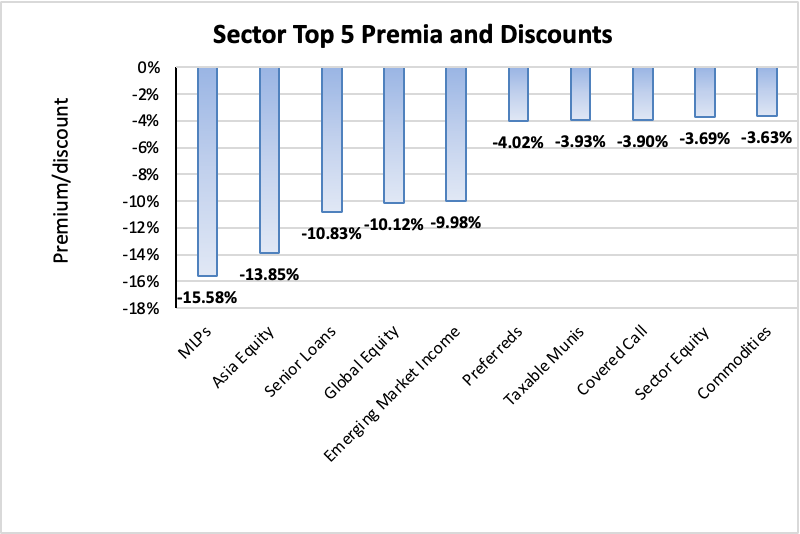
The sector with the highest premium was Commodities (-3.63%), while the sector with the widest discount is MLPs (-15.58%). The average sector discount is -7.53% (down from -4.94% last week).
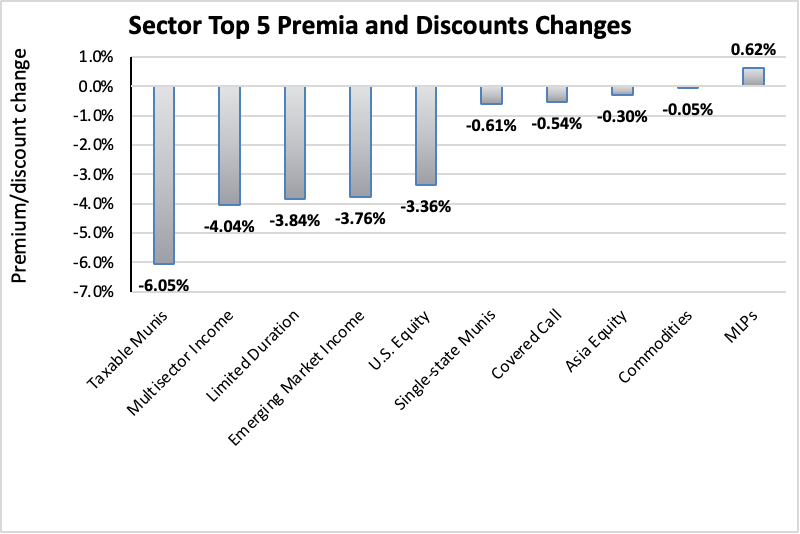
The sector with the highest premium/discount increase was MLPs (+0.62%), while Taxable Munis (-6.05%) showed the lowest premium/discount decline. The average change in premium/discount was -1.92% (down from +0.67% last week).
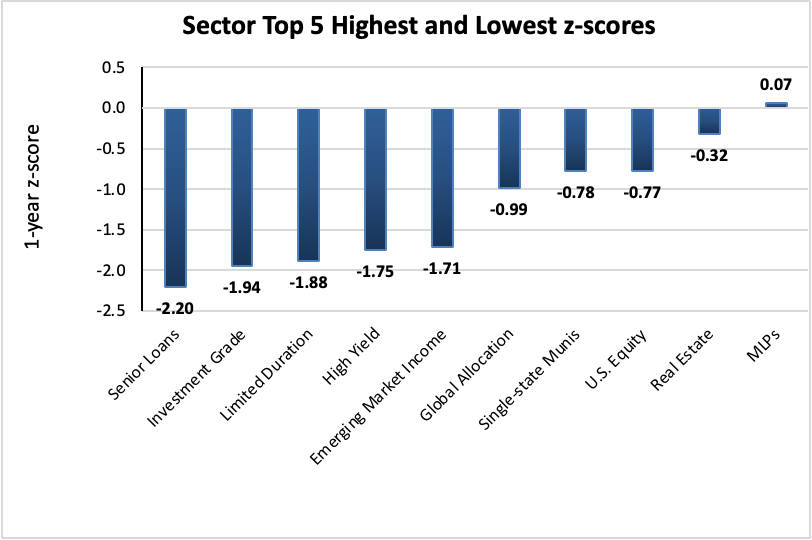
The sector with the highest average 1-year z-score is MLPs (+0.07), while the sector with the lowest average 1-year z-score is Senior Loans (-2.20). The average z-score is -1.25 (down from -0.38 last week).
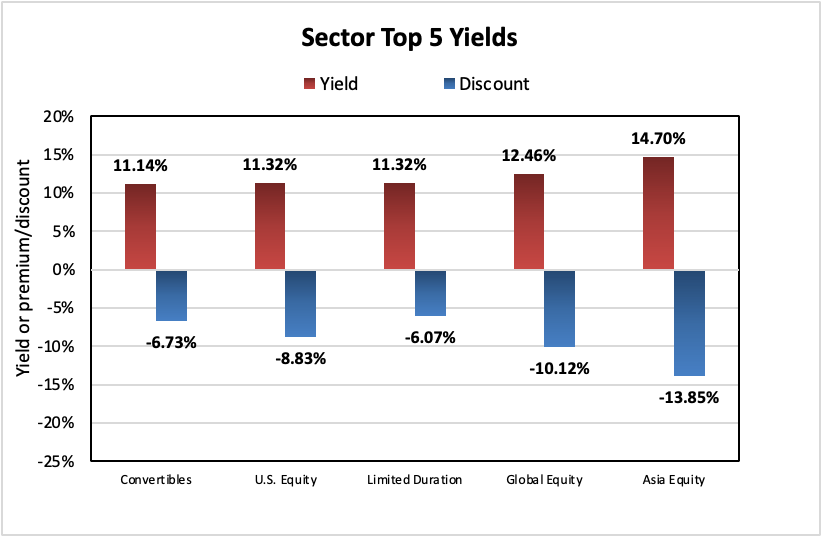
The sectors with the highest yields are Asia Equity (14.70%), Global Equity (12.46%), and Limited Duration (11.32%). Discounts are included for comparison. The average sector yield is +8.84% (up from +8.13% last week).
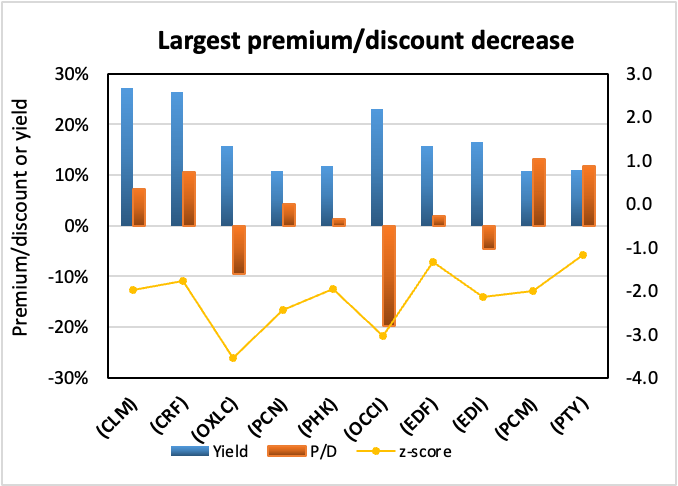
Individual CEFs that have undergone a significant decrease in premium/discount value over the past week, coupled optionally with an increasing NAV trend, a negative z-score, and/or are trading at a discount, are potential buy candidates.
| Fund | Ticker | P/D decrease | Yield | P/D | z-score | Price change | NAV change |
| Cornerstone Strategic Value | (CLM) | -24.34% | 27.09% | 7.23% | -2.0 | -23.71% | -6.39% |
| Cornerstone Total Return Fund | (CRF) | -21.59% | 26.44% | 10.69% | -1.8 | -22.54% | -7.42% |
| Oxford Lane Capital Corp | (OXLC) | -16.36% | 15.73% | -9.54% | -3.5 | -15.26% | 0.00% |
| PIMCO Corporate & Income Strgy | (PCN) | -12.12% | 10.90% | 4.38% | -2.5 | -15.60% | -5.95% |
| PIMCO High Income | (PHK) | -11.46% | 11.76% | 1.24% | -2.0 | -15.08% | -5.47% |
| OFS Credit Company Inc | (OCCI) | -11.24% | 23.01% | -19.85% | -3.0 | -16.51% | 0.00% |
| Virtus Stone Harbor Emerging Markets Inc | (EDF) | -11.21% | 15.69% | 2.00% | -1.3 | -20.03% | -10.85% |
| Virtus Stone Harbor Emg Mkts Total Inc | (EDI) | -9.81% | 16.47% | -4.49% | -2.1 | -19.30% | -10.67% |
| PCM Fund | (PCM) | -9.45% | 10.90% | 13.17% | -2.0 | -12.65% | -5.71% |
| PIMCO Corporate & Income Opportunity Fd | (PTY) | -8.97% | 11.03% | 11.75% | -1.2 | -13.63% | -6.69% |
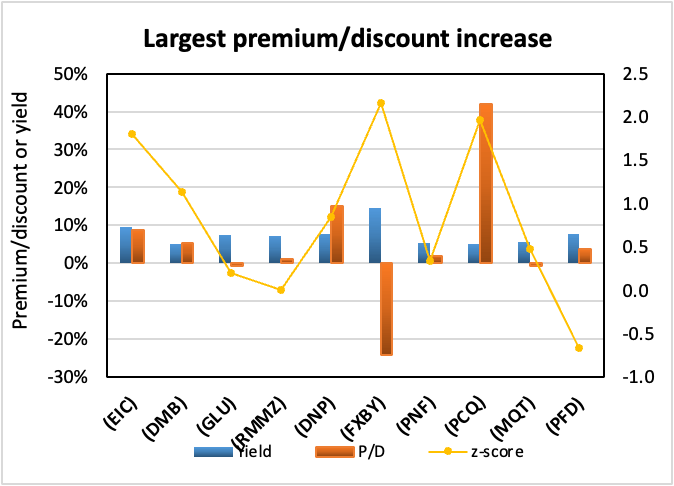
Conversely, individual CEFs that have undergone a significant increase in premium/discount value in the past week, coupled optionally with a decreasing NAV trend, a positive z-score, and/or are trading at a premium, are potential sell candidates.
| Fund | Ticker | P/D increase | Yield | P/D | z-score | Price change | NAV change |
| Eagle Point Income Co Inc | (EIC) | 15.06% | 9.46% | 8.79% | 1.8 | 5.04% | -9.75% |
| BNY Mellon Muni Bond Infrastructure Fund | (DMB) | 11.09% | 5.00% | 5.39% | 1.1 | 5.21% | -5.85% |
| Gabelli Global Utility & Income | (GLU) | 9.33% | 7.49% | -0.74% | 0.2 | -6.32% | -15.10% |
| RiverNorth Manage Dur Muni Inc Fd II Inc | (RMMZ) | 8.13% | 7.18% | 1.04% | 0.0 | -0.40% | -8.83% |
| DNP Select Income | (DNP) | 7.93% | 7.65% | 15.18% | 0.9 | -8.53% | -13.98% |
| FOXBY CORP | (OTCPK:FXBY) | 7.80% | 14.55% | -24.24% | 2.2 | -1.08% | -11.25% |
| PIMCO NY Municipal Income | (PNF) | 6.99% | 5.44% | 1.98% | 0.3 | -2.42% | -9.10% |
| PIMCO CA Municipal Income | (PCQ) | 6.90% | 5.19% | 42.06% | 2.0 | -3.90% | -8.56% |
| BlackRock Muniyield Quality II | (MQT) | 5.43% | 5.64% | -0.78% | 0.5 | -1.37% | -6.77% |
| Flaherty & Crumrine Preferred Income | (PFD) | 5.24% | 7.66% | 3.80% | -0.7 | -0.65% | -5.65% |
Recent corporate actions
These are from the past month. Any new news in the past week has a bolded date:
June 13, 2022 | Cornerstone Strategic Value Fund, Inc. Announces Completion Of Rights Offering.
June 13, 2022 | Cornerstone Total Return Fund, Inc. Announces Completion Of Rights Offering.
June 6, 2022 | Nuveen Municipal Closed-End Funds Announce Completion of Reorganization.
May 24, 2022 | NEUBERGER BERMAN HIGH YIELD STRATEGIES FUND ANNOUNCES FINAL RESULTS OF RIGHTS OFFERING.
Upcoming corporate actions
These are from the past month. Any new news in the past week has a bolded date:
May 2, 2022 | Gabelli Global Utility & Income Trust Announces Rights Offering for Common Shares Record Date and Summary of Terms.
Recent activist or other CEF news
These are from the past month. Any new news in the past week has a bolded date:
————————————
Distribution changes announced this month
These are sorted in ascending order of distribution change percentage. Funds with distribution changes announced this month are included. Any distribution declarations made this week are in bold. I’ve also added monthly/quarterly information as well as yield, coverage (after the boost/cut), discount and 1-year z-score information. I’ve separated the funds into two sub-categories, cutters and boosters.
Cutters

Boosters

Strategy statement
Our goal at the CEF/ETF Income Laboratory is to provide consistent income with enhanced total returns. We achieve this by:
- (1) Identifying the most profitable CEF and ETF opportunities.
- (2) Avoiding mismanaged or overpriced funds that can sink your portfolio.
- (3) Employing our unique CEF rotation strategy to “double compound“ your income.
It’s the combination of these factors that has allowed our Income Generator portfolio to massively outperform our fund-of-CEFs benchmark ETF (YYY) whilst providing growing income, too (approx. 10% CAGR).
Income Lab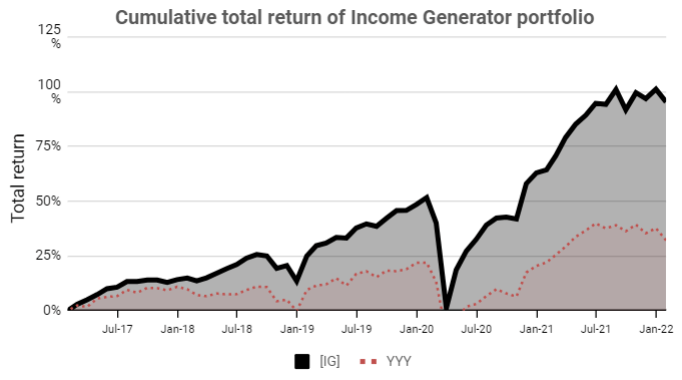
Remember, it’s really easy to put together a high-yielding CEF portfolio, but to do so profitably is another matter!