Webster Financial: Outlook Remains Bright For Both Loan Growth And Margin Expansion

tupungato
Earnings of Webster Financial Corporation (NYSE:WBS) would benefit from high-single-digit loan growth, which is in line with the historical trend. Further, margin expansion will support earnings growth. Overall, I’m expecting Webster Financial to report GAAP earnings of $3.77 per share for 2022 and $6.73 per share for 2023. Compared to my last report on the company, I’ve increased my earnings estimate because I’ve revised upwards both my loan balance and margin estimates. Next year’s target price suggests a high upside from the current market price. Therefore, I’m maintaining a buy rating on Webster Financial Corporation.
Loan Growth to Revert to the Historical Range
Webster Financial Corporation’s loan growth remained above the historical average in the third quarter, which exceeded my expectations. The portfolio grew by 4.8% during the quarter, or 19.3% annualized. Loan growth will likely revert to a level closer to the historical average in the coming quarters because of high-interest rates. The production of residential real estate loans is particularly sensitive to borrowing costs as new home buyers can put off their purchases until the next year or till another more feasible time. Fortunately, Webster Financial is more focused on commercial loans than residential loans. Residential real estate and home equity lines of credit made up 19% of total loans, while the rest were mostly commercial loans, according to details given in the third quarter’s 10-Q Filing.
However, I’m not expecting loan growth to drop below the historical range because of persistently strong job markets. While Webster Bank’s physical presence is concentrated in the northeastern U.S., especially in New York, Connecticut, Rhode Island, and Massachusetts, the bank caters to customers all over the country. Therefore, the national average unemployment rate is a good gauge of credit demand. As shown below, the unemployment rate hasn’t been this low in decades.
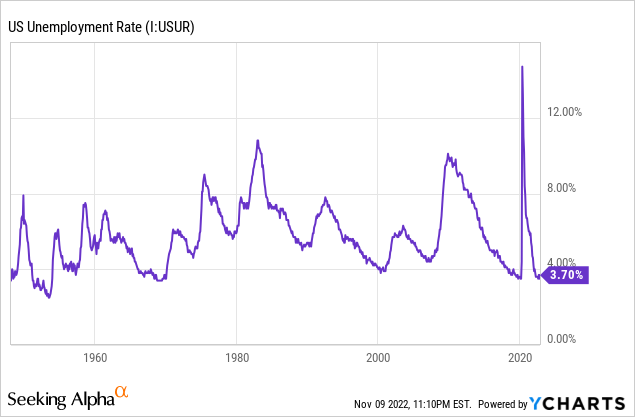
Considering these factors, I’m expecting the loan portfolio to grow by 2% every quarter till the end of 2023, leading to full-year loan growth of 119% for 2022 and 8% for 2023. Compared to my last report on Webster Financial, I haven’t changed my loan growth estimates for the fourth quarter of 2022 and the full year of 2023. However, my updated loan balance estimates are higher now because loan growth beat my expectations in the third quarter.
Meanwhile, I’m expecting other balance sheet items to grow somewhat in line with loans. The following table shows my balance sheet estimates.
| FY18 | FY19 | FY20 | FY21 | FY22E | FY23E | |
| Financial Position | ||||||
| Net Loans | 18,253 | 19,828 | 21,282 | 21,971 | 48,195 | 52,167 |
| Growth of Net Loans | 5.4% | 8.6% | 7.3% | 3.2% | 119.4% | 8.2% |
| Other Earning Assets | 7,454 | 8,477 | 8,978 | 10,834 | 15,406 | 16,032 |
| Deposits | 21,859 | 23,325 | 27,335 | 29,847 | 55,089 | 59,630 |
| Borrowings and Sub-Debt | 2,635 | 3,704 | 1,696 | 1,249 | 5,880 | 5,999 |
| Common equity | 2,741 | 3,063 | 3,090 | 3,293 | 7,445 | 8,038 |
| Book Value Per Share ($) | 29.7 | 33.3 | 34.3 | 36.5 | 42.8 | 46.2 |
| Tangible BVPS ($) | 23.6 | 27.2 | 28.1 | 30.3 | 27.2 | 30.6 |
| Source: SEC Filings, Author’s Estimates(In USD million unless otherwise specified) | ||||||
Further Margin Expansion to Lift the Bottom Line
Webster Financial Corporation’s net interest margin expanded by 26 basis points in the third quarter after increasing by 24 basis points in the second quarter of this year. The rising rate environment was the biggest reason for the margin growth.
Due to the large securities and residential loan balances, slightly more earning assets carry fixed rates than variable rates. Fixed-rate loans and securities made up 51% while floating and periodic-rate assets made up 49% of total earning assets at the end of September 2022, as mentioned in the earnings presentation. At the same time, a majority of deposits carried adjustable rates. Interest-bearing checking, money market, savings, and health savings accounts altogether made up 52% of total deposits at the end of the last quarter.
Although the fixed-to-variable ratio is quite close on both sides of the balance sheet, Webster Financial has expanded its margin in the last two quarters, which shows that the bank has a lot of pricing power. The results of the management’s interest-rate sensitivity model also show that asset repricing can overtake liability repricing. According to the results of the model, a 200-basis points hike in interest rates could boost the net interest income by 8% over twelve months, as mentioned in the earnings presentation.
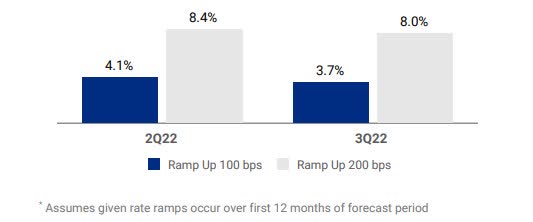
3Q 2022 Earnings Presentation
I’m expecting the fed funds rate to increase by 75 basis points till the mid of 2023 from the current level of 4.0%. Considering these factors, I’m expecting the margin to grow by 20 basis points in the last quarter of 2022 and 12 basis points in 2023. Compared to my last report on Webster Financial, I’ve increased my margin estimates for the next five quarters because the margin growth so far has exceeded my expectations. Further, my interest rate outlook is now more hawkish than before.
Expecting Earnings of $6.73 Per Share for 2023
The anticipated loan growth and margin expansion will drive earnings through the end of 2023. Meanwhile, the net-provision-expense-to-total-loan ratio will likely remain at the same level as the average for the last five years.
Overall, I’m expecting Webster Financial to report earnings of $3.77 per share for 2022 (including one-off merger-related expenses related to the Sterling Bancorp acquisition earlier this year) and $6.73 per share for 2023. The following table shows my balance sheet estimates.
| FY18 | FY19 | FY20 | FY21 | FY22E | FY23E | |
| Income Statement | ||||||
| Net interest income | 907 | 955 | 891 | 901 | 2,025 | 2,527 |
| Provision for loan losses | 42 | 38 | 138 | (55) | 266 | 112 |
| Non-interest income | 283 | 285 | 285 | 323 | 447 | 437 |
| Non-interest expense | 706 | 716 | 759 | 745 | 1,362 | 1,305 |
| Net income – Common Sh. | 352 | 373 | 211 | 399 | 657 | 1,170 |
| EPS – Diluted ($) | 3.81 | 4.06 | 2.35 | 4.42 | 3.77 | 6.73 |
|
Source: SEC Filings, Author’s Estimates (In USD million unless otherwise specified) |
||||||
In my last report on Webster Financial, I estimated earnings of $3.49 per share for 2022 and $6.07 per share for 2023. I’ve increased my earnings estimates for both years as I’ve revised upwards my margin estimates. Further, I’ve slightly raised my loan balance estimates as the third quarter’s performance beat my expectations.
My estimates are based on certain macroeconomic assumptions that may not come to pass. Therefore, actual earnings can differ materially from my estimates.
Maintaining a Buy Rating Due to a High Price Upside
Webster Financial has held its quarterly dividend constant at $0.40 per share since the second quarter of 2019. This dividend level and my earnings estimate suggest a payout ratio of 24% for 2023, which is below the last five-year average of 43%. Due to the high variance between the projected payout ratio and the historical average payout ratio, there is room for a dividend hike. Nevertheless, I’m not expecting Webster Financial to change its dividend level this year to remain on the safe side.
I’m using the historical price-to-tangible book (“P/TB”) and price-to-earnings (“P/E”) multiples to value Webster Financial. The stock has traded at an average P/TB ratio of 1.58 in the past, as shown below.
| FY19 | FY20 | FY21 | Average | |||
| T. Book Value per Share ($) | 27.4 | 28.1 | 30.3 | |||
| Average Market Price ($) | 49.8 | 32.5 | 53.7 | |||
| Historical P/TB | 1.82x | 1.16x | 1.77x | 1.58x | ||
| Source: Company Financials, Yahoo Finance, Author’s Estimates | ||||||
Multiplying the average P/TB multiple with the forecast tangible book value per share of $30.6 gives a target price of $48.4 for the end of 2023. This price target implies a 10.3% downside from the November 9 closing price. The following table shows the sensitivity of the target price to the P/TB ratio.
| P/TB Multiple | 1.38x | 1.48x | 1.58x | 1.68x | 1.78x |
| TBVPS – Dec 2023 ($) | 30.6 | 30.6 | 30.6 | 30.6 | 30.6 |
| Target Price ($) | 42.3 | 45.3 | 48.4 | 51.4 | 54.5 |
| Market Price ($) | 54.0 | 54.0 | 54.0 | 54.0 | 54.0 |
| Upside/(Downside) | (21.7)% | (16.0)% | (10.3)% | (4.7)% | 1.0% |
| Source: Author’s Estimates |
The stock has traded at an average P/E ratio of around 12.8x in the past, as shown below.
| FY19 | FY20 | FY21 | Average | |||
| Earnings per Share ($) | 4.06 | 2.35 | 4.42 | |||
| Average Market Price ($) | 49.8 | 32.5 | 53.7 | |||
| Historical P/E | 12.3x | 13.9x | 12.1x | 12.8x | ||
| Source: Company Financials, Yahoo Finance, Author’s Estimates | ||||||
Multiplying the average P/E multiple with the forecast earnings per share of $6.73 gives a target price of $85.8 for the end of 2023. This price target implies a 59.1% upside from the November 9 closing price. The following table shows the sensitivity of the target price to the P/E ratio.
| P/E Multiple | 10.8x | 11.8x | 12.8x | 13.8x | 14.8x |
| EPS 2023 ($) | 6.73 | 6.73 | 6.73 | 6.73 | 6.73 |
| Target Price ($) | 72.4 | 79.1 | 85.8 | 92.6 | 99.3 |
| Market Price ($) | 54.0 | 54.0 | 54.0 | 54.0 | 54.0 |
| Upside/(Downside) | 34.1% | 46.6% | 59.1% | 71.5% | 84.0% |
| Source: Author’s Estimates |
Equally weighting the target prices from the two valuation methods gives a combined target price of $67.1, which implies a 24.4% upside from the current market price. Adding the forward dividend yield gives a total expected return of 27.3%. Hence, I’m adopting a buy rating on Webster Financial Corporation.