Was The ‘Everything Bubble’ The Worst Time Ever To Retire Early?
matt_scherf/E+ via Getty Images
Retirement is incredibly simple – just relax and live off of your money. But the question of how much money you can spend is a devilishly complicated exercise in economics, finance, and risk management. Decades down the line, small changes in behavior can compound into surprising wealth – or ruin. Spend too much, and you could run out of money down the road with few options for employment. Spend too little, and you’ve piled up money without the opportunity to enjoy it. Similarly, taking too much risk in your portfolio can lead to rapid ruin, while taking too little can lead to slow decay in the long run.
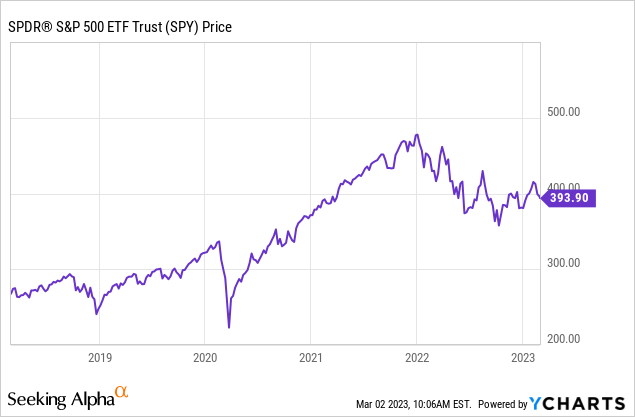
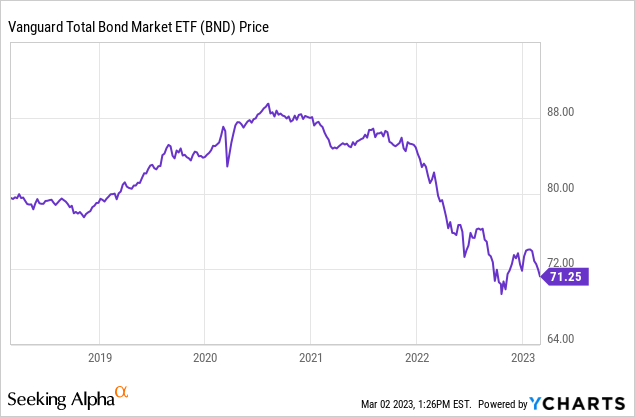
During the pandemic, roughly 3 million more Americans decided to call it quits relative to the prior trend. The bad news – they did so into an “everything bubble” in stocks (SPY), bonds (BND), and property from late 2019 to early 2022 and right before a tsunami of inflation. However, the good news is that those looking to retire in the coming years are starting to have much more realistic prospects for building a prosperous retirement, courtesy of falling valuations and asset prices across the board.
A Retiree’s Worst Nightmare: Sequence Of Returns Risk
The biggest risk to someone looking to live off of their assets is called sequence of returns risk. Let’s say you’re a typical retiree and subscribe to the canonical 4% rule. You’ve got $2,000,000 in assets, so mainstream actuarial calculations say you can spend about $80,000 per year and increase periodically for inflation. If say stocks fall 50% next year, you’ve only got $1,000,000, but you still need the $80,000 to live, so you start to seriously deplete your portfolio. Even if stocks go back to their original price in 2-3 years, the damage will largely be done, because you’ve sold out a lot of your asset base at low prices.
Sequence of returns risk proved devastating for investors who retired into the teeth of the dot-com bubble in 2000. For example, if we run calculations for a hypothetical retiree with $2,000,000 from 2000 to now, we see that a 75% stock/ 25% bond portfolio is down to $1.46 million from $2 million. That doesn’t sound like a disaster, but the portfolio is down about 60% on an inflation-adjusted basis, while you need roughly $140,000 in withdrawals now to match what you could buy with $80,000 in 2000. At the current pace, this portfolio is likely to go to zero if stocks experience another severe bear market. 2000 was a bad time to retiree, but it actually wasn’t the worst because bond yields started so high. Retirees from the 1960s actually did far worse, because initial stock valuations were high, bond yields were low, and then inflation exploded in the 1970s.
The worst thing that can happen to investors from a sequence of returns perspective is that they spend years saving and investing when valuations are high, and then when they need to sell, valuations tank. Conversely, the best thing that can happen is that savers invest when valuations are low, and then valuations swell during the early years of their retirement.
We don’t know how history will bear out for pandemic retirees, but they’re already in some serious trouble. If you retired with $2,000,000 in January 2022 under these same parameters, you’re already down to $1.62 million, while the cost of living is soaring. Depending on how inflation shakes out this year, you’ll need closer to $86,000-$88,000 to maintain your lifestyle, while your asset base has shrunk. If stocks fall further but inflation remains stubborn, it’s possible that 2022 could be even worse than the early 2000s for retirement, and as bad or worse than the 1960s. The combination of high stock valuations, low bond yields, and an inflation boom are a brutal combination for retirees. However, the good news is that as asset prices fall, you can actually benefit from sequence of returns risk by investing money at higher yields and at lower valuations. Moreover, now that asset prices are closer to where the free market would set them rather than being artificially inflated by stimulus, investors have far fewer monsters lurking in their closets.
Does The 4% Rule Work?
Mostly, but not always. The 4% rule was made famous by a group of finance professors in Texas. Their influential 1998 paper, known as the “Trinity Study“, is the bedrock of contemporary financial planning. The basic conclusion was that a 4% withdrawal rate (SWR) had about a 98% success rate across a range of stock/bond asset classes over a 30-year timeframe. However, there are a few caveats worth mentioning.
- Early retirees shouldn’t take the Trinity study as gospel. The longest timeframe in the study is 30 years, which makes sense for a typical 65-year-old retiree. However, if you retire at 40, your effective timeframe is 40-50 years. A lot of cases where the 4% rule worked for 30 years look like the 2000s retirees where they’re one bear market away from running out of money. Success rates for longer timeframes and a 4% withdrawal rate with optimal allocations are often closer to 80% than 100%. One important note is that 60/40 is not necessarily the best allocation because it doesn’t take enough risk. A 60/40 portfolio over 60 years has about a 40% chance of completely running out of money, and is a coin flip to maintain its purchasing power. More recent research by Early Retirement Now sheds some light.
Odds of Not Running Out of Money By Asset Allocation and Withdrawal Rate
Safe Withdrawal Rates (Early Retirement Now)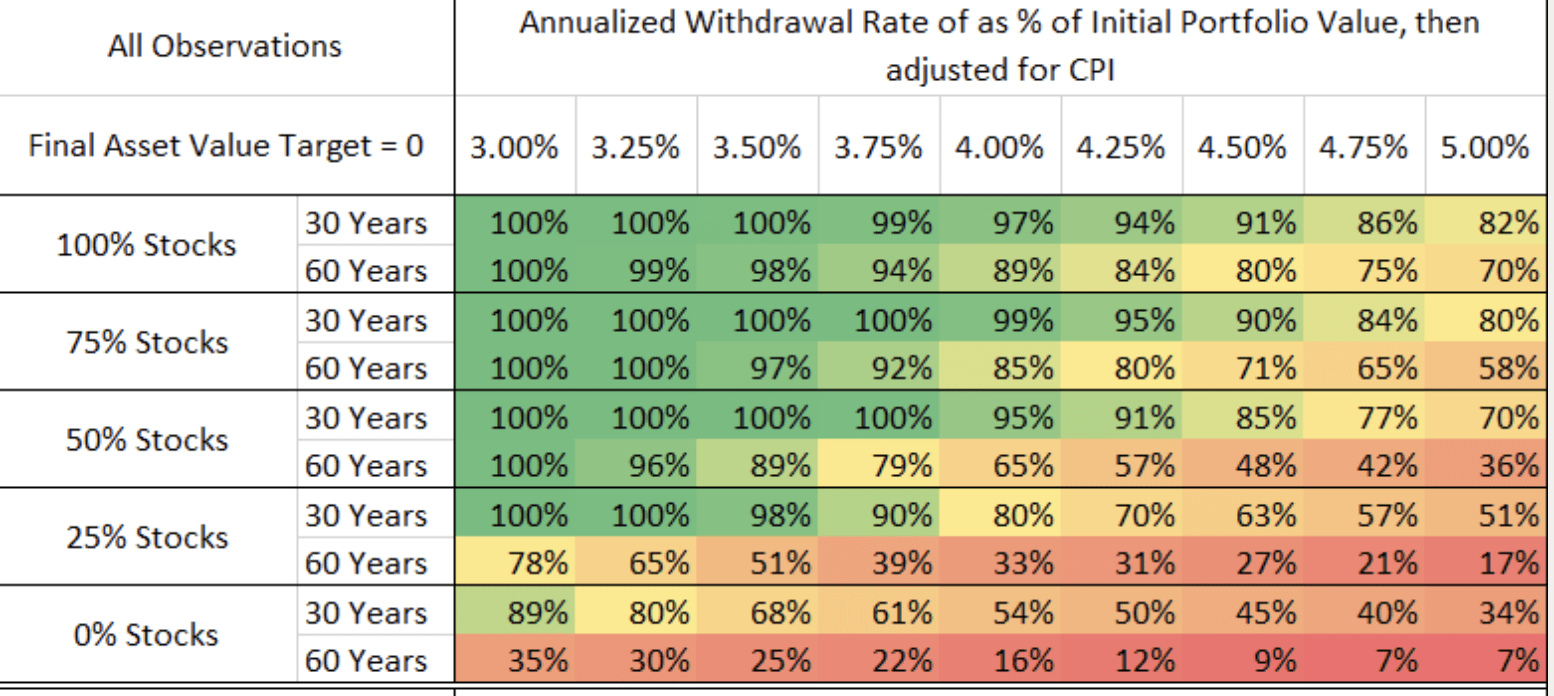
Odds of Maintaining Purchasing Power, By Asset Allocation and Withdrawal Rate
Safe Withdrawal Rates (Early Retirement Now)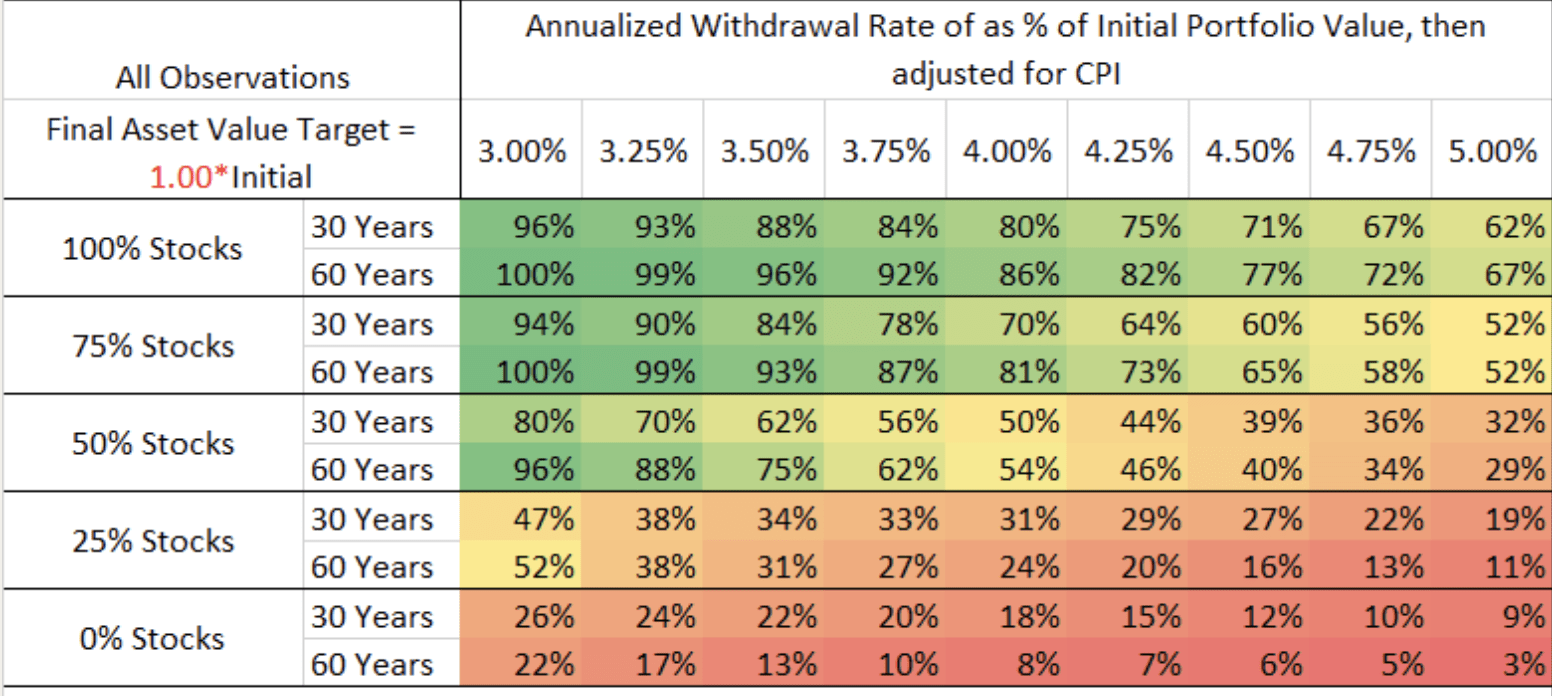
There are a lot of ways to mess this up! The red on the graph indicates probable failure, while green indicates probable success. Investors need to take a substantial amount of short-term risk in order to achieve long-term goals, and while 4% is a good benchmark, it’s not a slam dunk.
- There are a couple of other problems, the biggest one being valuations. It turns out that starting equity valuations are a strong predictor of whether you will be able to have a prosperous retirement. Starting real yields for bonds are also an important indicator. Both of these were absolutely blown out during the pandemic. I don’t generally favor making market predictions using the Shiller CAPE ratio because the corporate tax rate in the US was cut from 35% to 21% in 2018, deflating past earnings. This makes markets look somewhat more expensive than they really are, but it’s quite useful in the historical context.
Success Rate By Shiller PE (Early Retirement Now)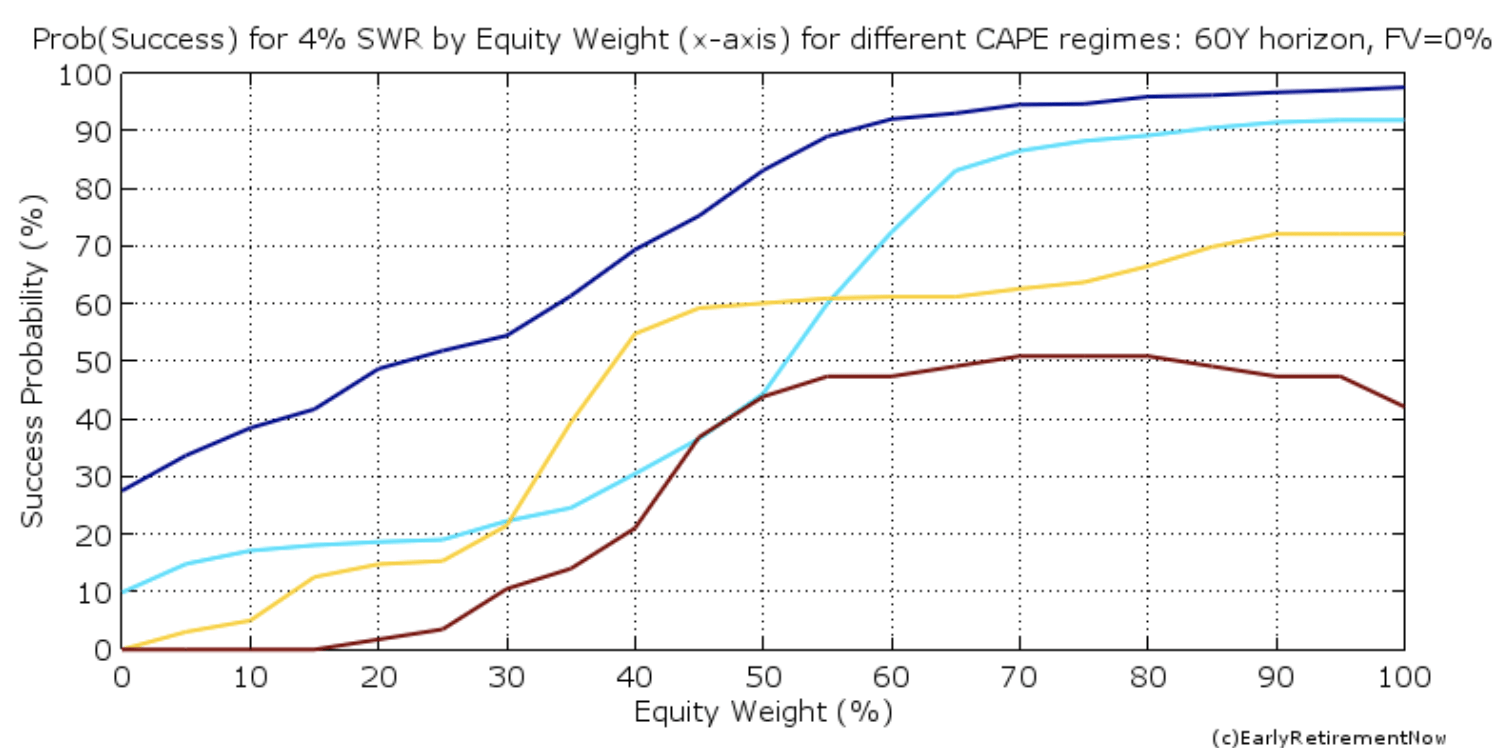
Here, the red line indicates the success rate for Shiller PE ratios over 30 years of retirement. The best you can do is roughly a coin flip. This is based on total failure rather than maintaining purchasing power, so the odds of increasing purchasing power were even lower.
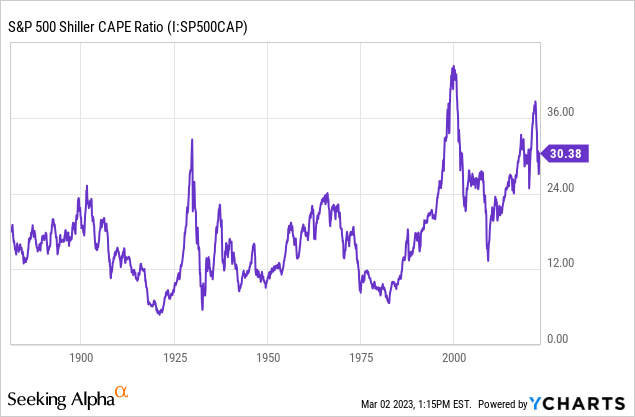
Here’s the Shiller PE history over the past 100-plus years. From an actuarial perspective, anything under 20x has a very high historical success ratio for retirees, 20-30x works better than 2/3rds of the time, and Shiller PEs over 30x result in long-term failure 50% of the time or more. The time-series sample size is small, but that’s always the case when looking at modern financial markets.
This isn’t completely fatal to your ability to retire, but what’s generally necessary is to lower your expectations. Withdrawal rates of around 3% work in high-valuation environments, while rates of 4% tend to get you in trouble.
- Unconditional vs. conditional probability also is important here. The Trinity Study is based on unconditional probability, meaning retirement dates are chosen at random. In real life, people choose when to retire based on how the market is doing. This normally doesn’t matter, but if asset bubbles cause people to think they can retire, then they will get themselves in trouble. The S&P 500 went up over 100% off of COVID lows, which undoubtedly played a role in making millions of people think they could retire. The higher valuations go, the more implicit leverage builds up in the system from new retirees who need to sell X amount of assets to fund their retirement standard of living.
Is Retiring Now Better?
In 2021 and early 2022, a lot of asset prices were frankly artificial. This wasn’t hard to see, but there were no clear answers about what to do about it. Traditional strategies like allocating to bonds failed because bond yields were manipulated by QE, and allocating to property really didn’t work because the same QE drove real estate prices to the moon. I battled some people at the time because they thought pandemic money printing had made them wealthier when in fact it had not. You basically had to take whatever your net worth was at the time and lop 25% off or so to account for the obvious bubble at the time and figure out what you could actually spend. The best move would have been to sit in cash and wait for inflation to explode, therefore forcing the Fed to slam on the brakes with rate hikes. This would have been incredibly hard to see in 2021, but in 2022, there were several irrational bear market rallies that gave investors the opportunity to raise cash.
Fortunately, current asset prices give a much more realistic view of what is possible. Dividend yields are higher. Bond yields are much, much higher than they were earlier in the pandemic. Stock valuations are on the high side of normal, but the worst of the bubble excesses are gone. You can get about 4.5% in tax-free high-yield municipal bonds, and stocks are beginning to offer better long-run returns as well. I’ll cover in-depth what I think a safe withdrawal rate should be going forward, but I think investors are looking much better now. My basic capital market assumptions for a portfolio of 25% municipal bonds and 75% global stocks are for a long-run return of about 7.5% and an inflation rate of about 2.5%. That’s a real return of 5%, which is higher than 4%. Investors should be fine again with a withdrawal rate closer to 4%, but an upside surprise to inflation and/or a poor sequence of returns could still threaten the viability of this over the next few years.
Retirement Resources
- Early Retirement Now. I heavily linked to this blog in this article as it’s the most thorough quantitative approach to FIRE of anywhere I’ve seen on the internet. If you want to go down the rabbit hole, there’s a 50+ part series on how much you can spend in retirement.
- Open-Source Social Security Calculator. An open-source calculator on when to take Social Security. You can adjust for things like your health status, marital status, whether you want to keep working, etc. When to take Social Security is mind-numbingly complicated, but this is a great place to start.
- Michael Kitces’s blog. Kitces is an RIA, is the king of nitty-gritty tax strategies like IRA conversions, the 0% capital gains bracket, etc., and has great research on investing as well.
- Bogleheads. Bogleheads is a website devoted to the cult of Vanguard. You may not share their beliefs in market efficiency, but there’s a big forum on HNW people who share their investment strategies with each other in real-time in forums. They also have great research on tax stuff.
- Financial Samurai. This site is more entertaining and less technical than the others but has a good perspective from an early retiree from the financial world.
- Last but not least, a few points from my personal research on what the mainstream gets wrong about retirement.
Bottom Line
Due to massive inflation, high starting asset valuations, and now a bear market, the pandemic was a very unfavorable time to start retirement (unless you retired right when it started). However, while asset management is mostly an art, risk management is more of a science, and there are some great online resources for those who want to learn. The bad news is that the bear market may cause undercapitalized retirees to run out of money. The silver lining is that the bear market will favor younger workers who are able to save money and buy assets others are selling to set up their own nest egg. The “everything bubble” hasn’t yet fully popped so we don’t know for sure, but history will likely show that millions of pandemic retirees had uniquely bad timing.