VTV ETF: ‘Value’ Is Highly Overvalued Today

olm26250/iStock via Getty Images
Recent years have seen significant market shifts that have temporarily led to the outperformance of either growth or value stocks. Historically, both “high growth” and “low valuation” stocks outperform broader market indices but are highly dependent on other market factors. In general, value outperforms during rising interest rates or economic recovery. Comparatively, growth stocks often outperform when economic growth and interest rates are stable and not volatile, creating an ideal environment for companies to pursue innovation without external pressure.
Over most of the past decade, the market environment was highly favorable to growth stocks as low-interest rates and stable economic growth allowed technology companies an easy financing and innovation environment. The era of “ultra-low” rates was particularly beneficial as it promoted high valuations and excessive venture capital financing as more prominent investors avoided fixed-income assets. Today, the market is violently shedding the excesses created in the 2010s, recently leading to the collapse of technology investment banks like Silicon Valley Bank (SIVB).
Last year, the sharp rise in interest rates also led to severe losses for growth stocks as tighter financing conditions promoted lower valuations and caused many “growth companies” to pursue significant layoffs. Value stocks, such as those in Vanguard (NYSEARCA:VTV), outperformed considerably, losing almost no value in 2022. See below:
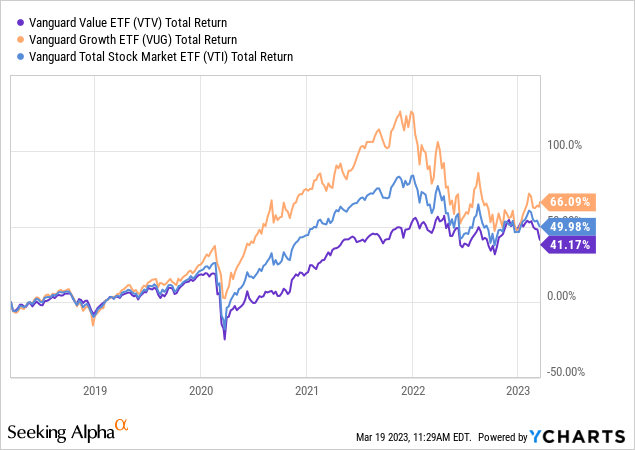
The considerable outperformance of VTV begs the question, should investors park their money in the ETF or other value-oriented funds? On the one hand, the higher interest rate dynamic does comparatively benefit VTV over growth stocks or the market in general. However, we must remember that VTV’s strong performance has made it more expensive or reduced its “discount” to growth stocks. Additionally, value stocks are not necessarily safe-haven and often decline more than peers during recessionary dynamics. Considering VTV’s largest sector category is financials, I believe VTV may be at considerable risk of suffering a more extensive correction over the coming months. However, VTV may be a more attractive opportunity once the market has reached a firm bottom.
When Does Value Perform Best?
The relative performance of growth vs. value stocks often comes in waves, depending mainly on market trends. That said, investor interest may also be a factor, as many retail investors tend to prefer “socially popular” companies, of which value stocks are rarely, but occasionally, a large mixture. In 2020 and 2021, when many new investors entered the market, value underperformed considerably as investors flocked to technology brands like Apple, Nvidia, Tesla, etc. The current top stocks in VTV include Berkshire (BRK.A)(BRK.B), Exxon Mobil (XOM), UnitedHealth (UNH), JPMorgan (JPM), and Johnson & Johnson (JNJ) – comparatively more established and “boring” than the top “growth” stocks.
There is a general correlation between VTV’s outperformance compared to the total stock market (VTI) and the bond market, namely, real interest rates or the 10-year Treasury bond yield after expected 10-year average inflation. See below:
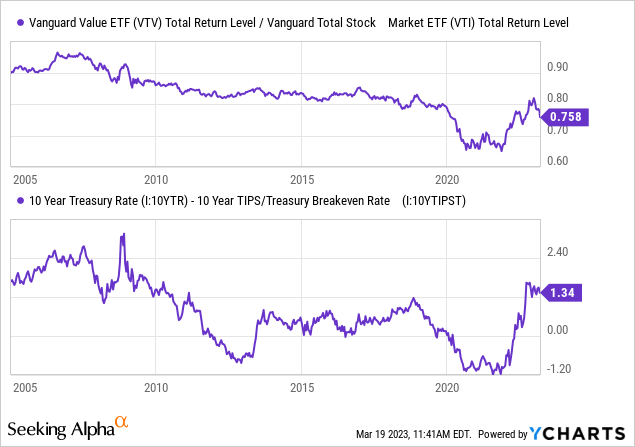
The relationship between these two is not perfect, but there is an evident pattern in the troughs and peaks that illustrate the connection. The pattern is also quite clear, looking at the relative rolling performance of value, particularly in instances such as 2012, when value underperformed considerably as real interest rates declined.
There are a few reasons for this crucial relationship. One, high real interest rates are a negative factor for higher-valuation growth stocks because they dramatically lower the discounted fair value of future cash-flow projections. Thus, high real interest rates cause “value” to outperform broadly because growth underperforms. Secondly, high real interest rates also constrict economic growth and lower companies’ ability to borrow money, often to the benefit of companies lending money or those not pursuing growth. High financing costs lower competitive output growth, leading to higher prices and profits for established firms. Today’s energy and mining sectors are good examples of this trend.
Of course, this pattern does not always hold, as high real interest rates can often cause, or exacerbate, economic recessions. I believe there are ultimately two types of value stocks, which ETFs like VTV fail to distinguish. There are those that have lower “P/E” ratios because they are established and not pursuing growth (such as Exxon Mobil and most of the top stocks in VTV), and there are those with lower valuations due to excessive cyclical risk. Financials (20% of VTV) and industrials (14% of VTV) often fit into that category. This pattern can be seen in the relationship between the yield curve and the relative performance of “value”:

This figure requires longer-term data, so the S&P 500 “value” index is used instead of VTV, although the two are very similar.
This pattern is not as straightforward as that between value and real interest rates, although it is still apparent considering the delayed impact the yield curve often has on the stock market. The yield curve is a strong historical predictor of long-term economic growth. The time between yield-curve inversion and a recession can be between one to three years, but inverted yield curves always end in recessions. For example, in the late 90s, the yield curve was very flat for a few years, leading to a large market crash and minor recession around 2000. The curve fell back around 2006, leading to significant underperformance for value by the late 2000s.
The yield curve was low during most of the 2010s, creating negative pressure on bank net interest margins and hampering industrial productivity growth. Banks often reduce capital financing when the yield curve is low for a prolonged period because their financing costs rise disproportionately to long-term lending rates. Both banks’ interest rate-sensitive companies that require significant financing (real estate) usually struggle when the yield curve is as inverted as it is today. Indeed, I believe this factor is the primary driver of the growing crisis in the banking industry as they struggle with rising deposit costs (or deposit outflows) and fixed low asset returns in the case of extreme Treasury ownership.
By historical norms and real-world events playing out today, the immense yield curve inversion is a huge red flag for cyclical stocks. Financials will likely take the most brutal hit, but real estate, industrial, and consumer discretionary companies should also. These four sectors collectively comprise around 44% of VTV’s holdings. The fund is biased toward these sectors because they usually carry higher cyclical risks and lower valuations. Even if these lower valuations equate to superior long-term performance, they offer little “alpha” since they have more “beta” risk. I believe today’s extreme yield curve inversion and stress in the banking market are signals that this risk factor is spreading across the stock market (or economy). Notably, financial stocks can lose most of their value quickly and are far less “durable” than others due to their immense leverage. Thus, even if many banks seem discounted today, a slight rise in loan losses or a government policy mistake may quickly bankrupt many.
The Bottom Line
Overall, the macroeconomic environment has one strong positive factor for VTV and one sizeable negative factor. Today’s high real interest rate makes cheaper mature companies particularly attractive because it limits competition and supports dividends. A few notable sectors are healthcare, consumer staples, most telecommunications, and energy (which has arguably fewer cyclical risks today than in the past). These sectors account for around 32% of VTV’s collective value, with healthcare making up 19%. I believe these sectors may offer real value today because they’re less exposed to cyclical risk factors and stand to benefit from high real interest rates.
That said, I would not buy VTV today, and I am bearish on the fund due to its excessive exposure to cyclical stocks such as financials, industrials, and consumer discretionary. The higher real interest rate environment is less important for these sectors, but the extreme yield curve inversion bodes a strong recessionary signal. For financials, today’s immense curve inversion directly limits profitability as deposit rates rise. Personally, I would avoid VTV and these sectors until the yield curve is back in the “normal” 1-2% range, which would likely occur during a recession but not before. Cyclical stocks are best when economic growth outlooks are just beginning to recover. In my view, the economic growth outlook is still deteriorating today and will continue to do so until bank, corporate, and potentially government debt issues are resolved.
Alternatives
Due to my view regarding the economy, I am not particularly bullish on any large-basket ETF. However, I suspect a more robust relative performance will be found in higher quality, low valuation stocks or high dividend stocks that exclude financials and real estate (which have high dividends by nature and not due to company maturity or quality). In today’s specific market dynamic, I would be looking for companies with less cyclical cash flows and mature market positions (using cash flows for dividends more than growth), ideally trading at a reasonable valuation.
The iShares Core High Dividend ETF (HDV) may be a decent example. The fund has a much higher yield (4.4%) and a lower average valuation than VTV (“P/E” weighted average of 12.2X compared to 15X). HDV also owns more energy, healthcare, telecom, and consumer staples and has no financials, giving it preferable sector exposure in today’s market. That said, with the yield curve as inverted as it is, I believe short-term bonds offer the best risk-reward overall, with 1-3 Treasuries (SHY) having better yields than both VTV and HDV.