VLT – Small Bond Fund From Invesco, 11% Yield (NYSE:VLT)
SolStock/E+ via Getty Images
Thesis
Invesco High Income Trust II (NYSE:VLT) is a high yield closed-end fund (“CEF”) from a premier asset manager. The fund has an average leverage of 27% but a very small AUM which is under $100mm. The fund is trading at a -10% discount and has an 11% yield but exposes poor long term analytics: a 5-year Sharpe ratio close to zero and a 5-year standard deviation of 13. More worryingly, while the fund outperforms the unleveraged SPDR Bloomberg Barclays High Yield Bond ETF (JNK) during easy monetary cycles, it exposes similar long term annual total returns which come in at 3.8% on a 10-year basis. The CEF underperforms significantly when compared to a fixed high-yield (“HY”) bond CEF from Credit Suisse, namely Credit Suisse Asset Management Income Fund (CIK).
VLT is poorly set-up for a potential upcoming recession with a credit profile which is concentrated on “B” and “CCC” credits. In today’s environment with record low default rates we would prefer to see credit funds with exposures to better rated credits in order to underwrite exposures. Overall there is not much to like about VLT – a CEF is a leveraged vehicle which is supposed to outperform more static and unleveraged funds such as ETFs. We do not see that in VLT, nor do we see appealing long term analytics. For holders of the fund we would hold for another 1-2 years to capture a tightening in credit spreads, while new money looking to enter the space would be better suited to look at the PIMCO or Credit Suisse CEFs.
Holdings & Risks
The fund invests in fixed high yield bonds that are tilted towards the bottom of the credit spectrum:
Ratings Distribution (Fund Fact Sheet)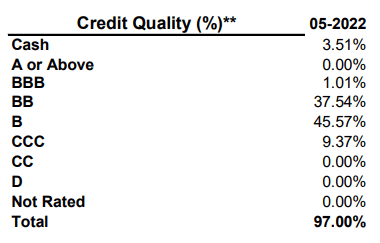
We can see that more than 50% of the fund holdings reside in the riskiest buckets – namely “B” and “CCC.” With a potential recession around the corner the fund is poorly set-up from a fundamental perspective for an increase in default rates.
The fund has a high industry concentration as well:
Sectors (Fund Fact Sheet)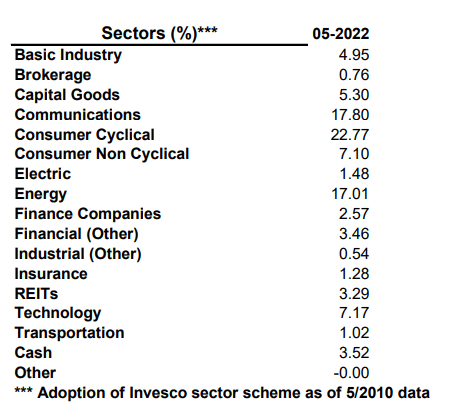
We can see from the above table that the fund is overly concentrated in Consumer Cyclical sectoral bonds. Anything above 15% sector allocation constitutes a high concentration in our book. The fund has several sectors which have allocations above that threshold. Namely Consumer Cyclical, Communications and Energy. It looks to us that the fund managers are taking well researched bets in concentrated sectors. While this is ok when extensive research is performed one can never escape an uncontrolled event in one of those areas. Think energy after the Covid-19 crisis – we witnessed a multitude of defaults on the back of the sudden disappearance of demand. We would much rather prefer a more diversified fund.
The fund is quite clear in delineating its risks between credit risk and market risk:
These funds are subject to credit and interest-rate risk. Credit risk refers to the ability of an issuer to make timely payments of interest and principal. Investments in securities rated below investment grade present greater risk of loss to principal and interest than investment in higher-quality securities. Interest-rate risk refers to fluctuations in the value of a fixed-income security resulting from changes in the general level of interest rates. In a declining interest-rate environment, the portfolio may generate less income. In a rising interest-rate environment, bond prices fall. Should the funds employ leverage, the portfolios may experience increased volatility.
Source: Fund Fact Sheet
The market risk resides with the fund duration which clocks in at 4.46:
Characteristics (Fund Fact Sheet)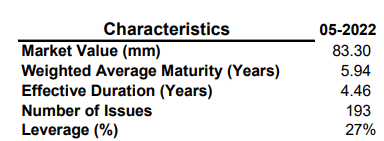
The fund has a fairly average to long duration for a fixed income HY bond fund. A reminder that HY bonds usually have maturities of 5 years and in. One of the reasons for the fund’s decline this year is constituted by its duration bucketing. 5-year rates have risen more than 200 bps this year contributing substantially to the fund’s underperformance.
The fund is fairly granular with over 190 individual issuers and has a leverage of 27%, fairly average for a high yield CEF.
Performance
The fund is down -23% year to date, underperforming slightly a HY CEF from Credit Suisse:
YTD Return (Seeking Alpha)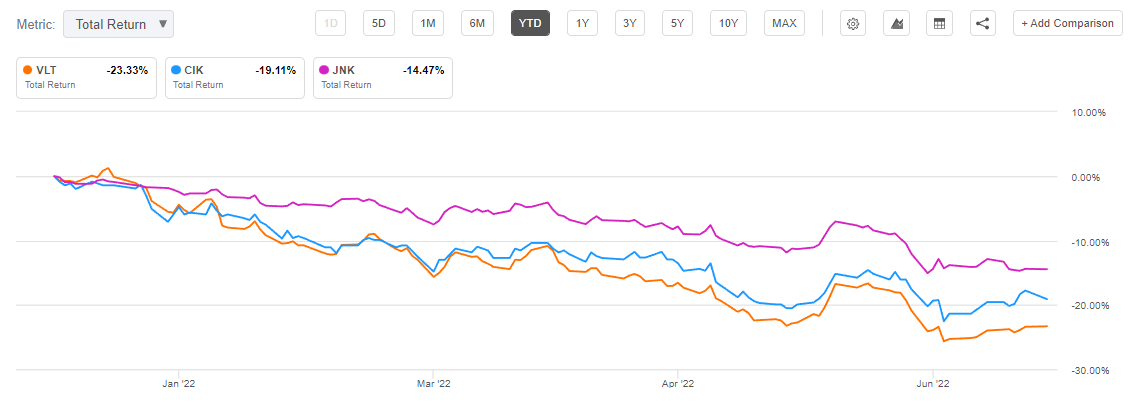
We can see that the CEFs are down more than the SPDR Bloomberg High Yield Bond ETF, which is an unleveraged vehicle that buys high yield bonds. VLT and CIK are down by a higher amount due to their leverage.
On a 5-year basis VLT exhibits the same performance as JNK while CIK outperforms:
5-Year Total Return (SeekingAlpha)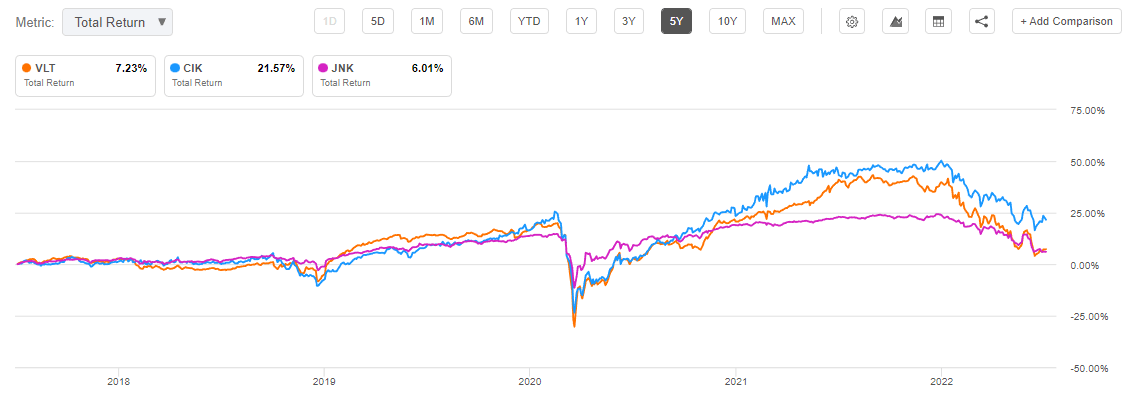
We can observe the same divergence on a 10-year time frame as well:
10-Year Total Return (Seeking Alpha)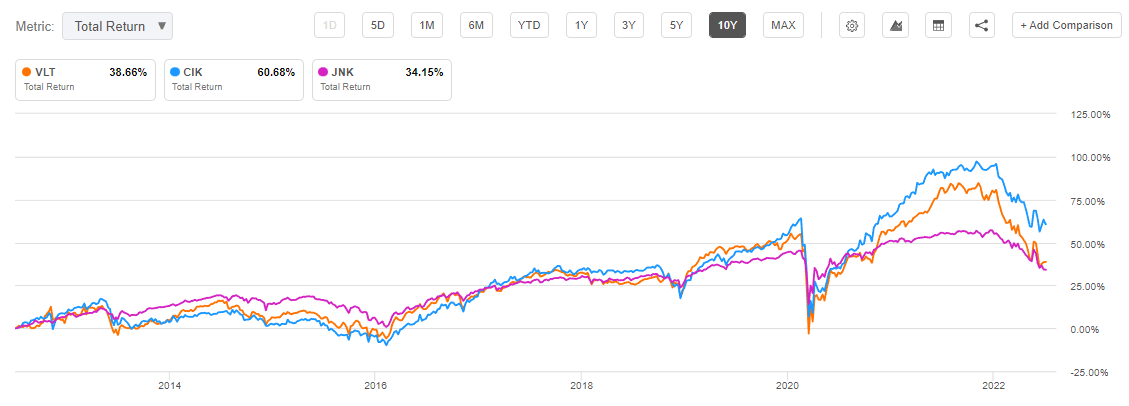
We do not like the fact that VLT, as a leveraged vehicle, long term produces the same results as the unleveraged ETF JNK. VLT has a higher standard deviation and therefore holders of the fund should be compensated for taking higher risks by a higher rate of return. Anytime a CEF performs in line with an unleveraged ETF it raises a massive red flag.
Premium / Discount to NAV
The fund usually trades at a discount to NAV:
Premium / Discount to NAV (Morningstar)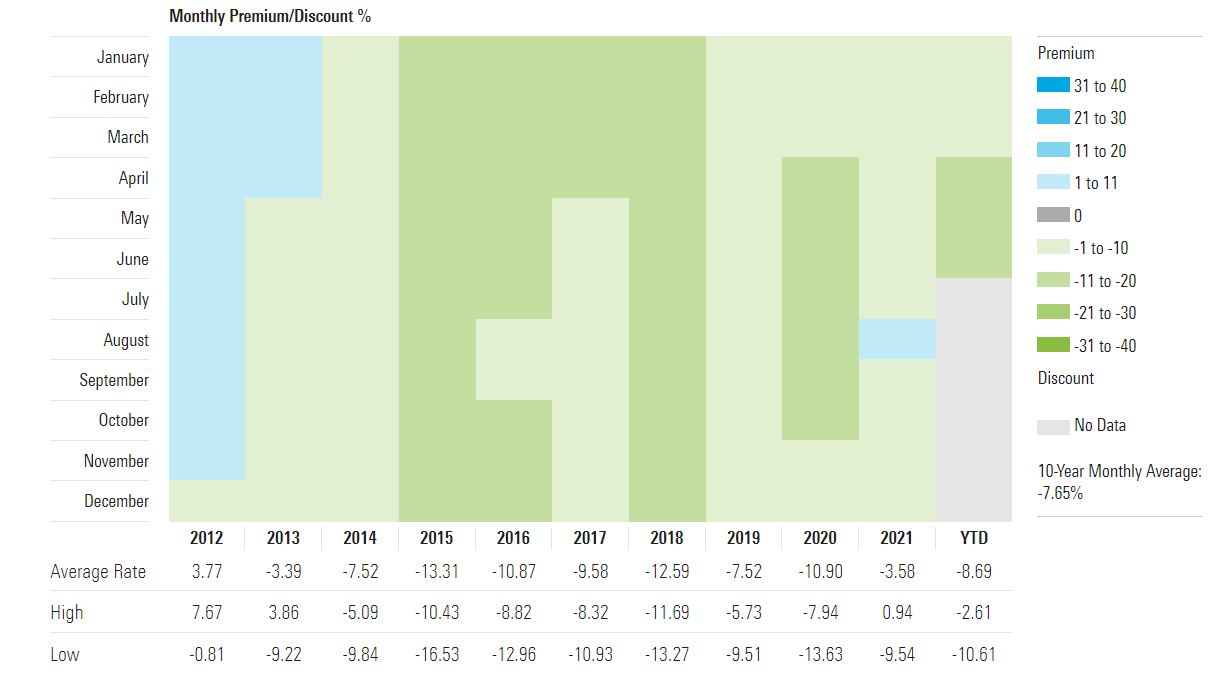
In the past decade the fund has usually traded at a discount to NAV. The current discount to NAV is -10% and it falls in line with the averages for the past years. We expect this discount to persist as a risk-off environment permeates the market.
Distributions
The fund has a managed distribution plan:
Invesco High Income Trust II has adopted a Managed Distribution Plan whereby the fund will increase its monthly dividend to common shareholders to a stated fixed monthly distribution amount based on a distribution rate of 8.5 percent of the closing market price per share as of August 1, 2018, the effective date of the Plan. If sufficient investment income is not available for a monthly distribution, the Trust will distribute long-term capital gains and/or return of capital in order to maintain its managed distribution level under the Plan. A return of capital may occur, for example, when some or all of the money that shareholders invested in the Trust is paid back to them.
Source: Fund Fact Sheet
As of the latest Section 19(a) report the distribution is parsed out as follows:
Section 199(a) (Section 19 Report)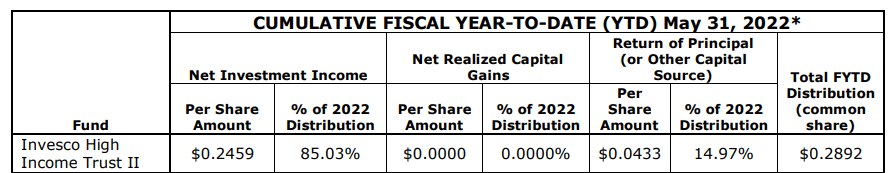
We can see from the above that around 85% of the distribution is constituted by investment income, while approximately 15% represents return of capital.
Conclusion
VLT is a fixed income CEF focusing on fixed rate HY bonds. The vehicle has a small AUM and poor long term analytics: a 5-year Sharpe ratio close to zero and a 5-year standard deviation of 13. Long term VLT yields the same annualized total return as the unleveraged ETF JNK. We do not feel an investor is properly compensated here for the risk taken with better alternatives in the HY CEF space. For holders of the fund, we would hold for another 1-2 years to capture a tightening in credit spreads, while new money looking to enter the space would be better suited to look at the PIMCO or Credit Suisse CEFs.