Vetting GCOW: Michael Burry Says ‘Free Cash Flow On Sale’ (BATS:GCOW)
Darren415
Introduction
Per its prospectus, the Pacer Global Cash Cows Dividend ETF (BATS:GCOW) (the ‘Fund’) is an ETF (i.e., exchange-traded fund) that “seeks to track the total return performance, before fees and expenses, of the Pacer Global Cash Cows Dividend Index (the ‘Index’).” The Fund features a 0.60% expense ratio and assets under management are approximately $645 million.
While I do not own shares of the Fund, I have moved it to my Watchlist and will consider purchasing shares over the next few months. From a rating standpoint, I deem GCOW a HOLD.
The Portfolio Methodology
The Index utilizes a rules-based methodology that provides exposure to global companies with high dividend yields that are well supported by free cash flow (“FCF”). The Index is derived from companies included in the FTSE All-World Developed Large Cap Index, which companies are then screened based on their projected average projected free cash flows and projected earnings over the next two fiscal years. Companies without projected free cash flows or earnings are removed from the Index universe. Moreover, financial companies (excluding real estate investment trusts, or REITs) are excluded from the Index. After this vetting process is completed: 1) the remaining companies are ranked by their free cash flow yield for the trailing 12-month period; 2) the 300 companies with the highest free cash flow yield are then ranked by their dividend yield; and 3) the 100 companies with the highest dividend yields are included in the Index.
The table below shows how this screening process works, including key financial metrics:
Stock Selection Process (Fund Website)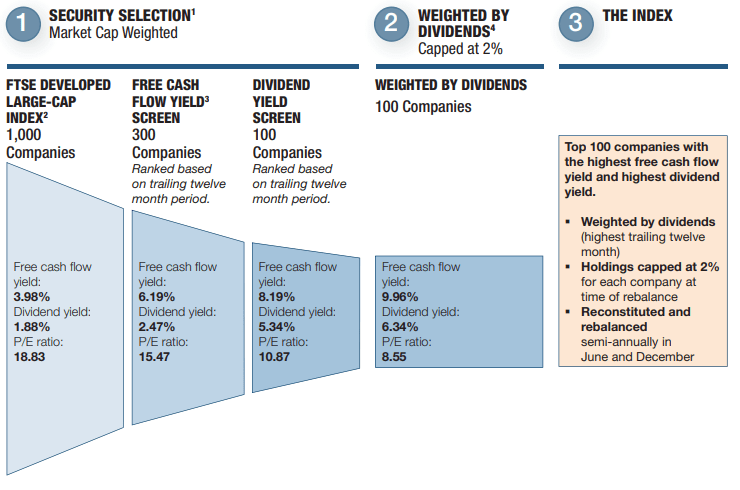
The Index is rebalanced semi-annually on the 3rd Friday of June and December. Upon each such rebalancing, the individual company weightings in the Index are capped at 2% of the weight of the Index.
In short, the Fund’s free cash flow screening process aims to identify companies that pay (and will continue to pay) consistent dividends. Indeed, a company’s ability to generate a high free cash flow yield normally does evidence a capacity to pay dividends, and paying a dividend usually evidences management’s confidence in the viability of a company’s business. This quantitative, rules based approach to finding quality is a plus in my view.
Michael Burry
In a recent tweet, legendary investor Michael Burry noted the following:
Cassandra Tweet (Twitter)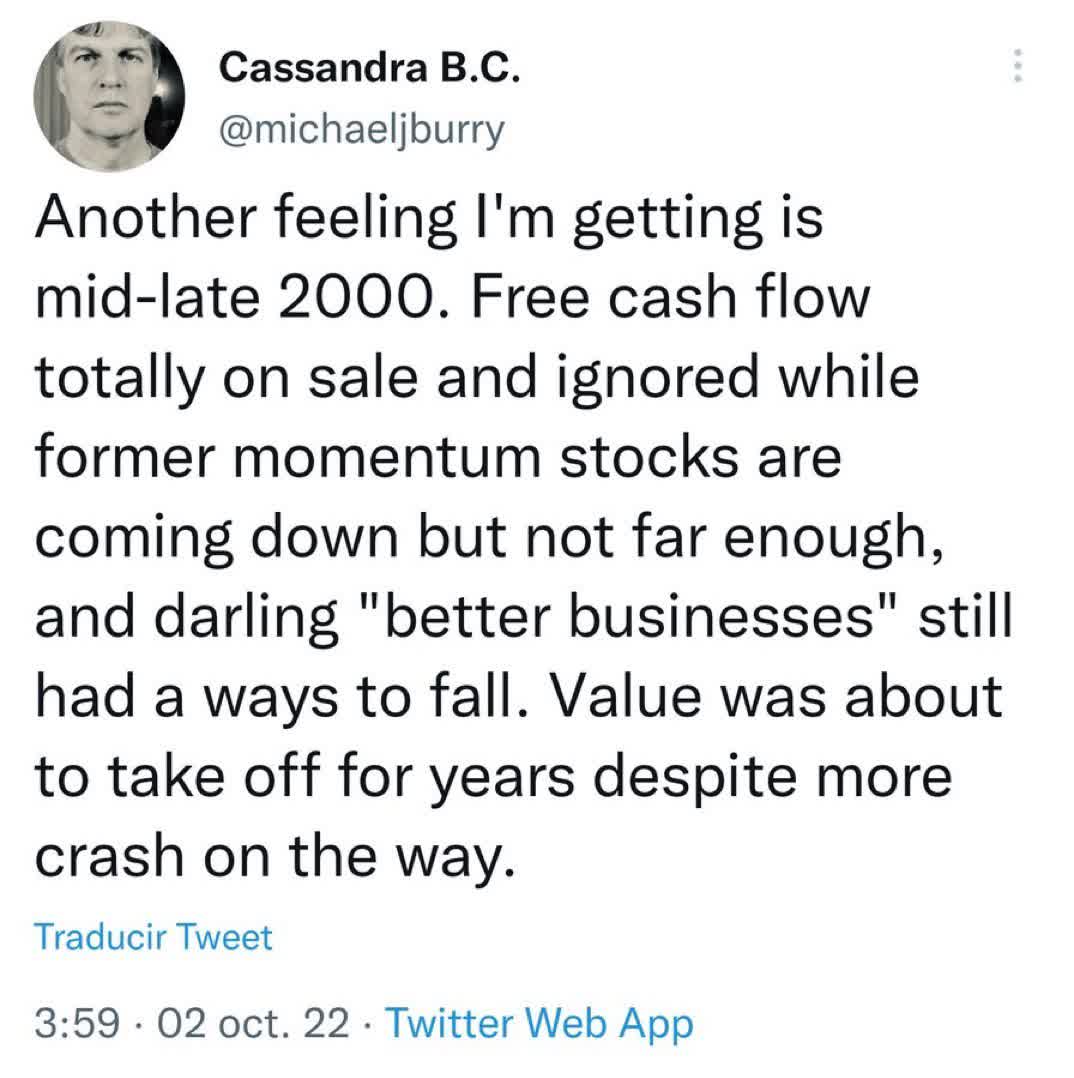
Assuming Michael Burry’s assessment of free cash flow companies being on sale is correct, the Fund may be a good investment after the year-to-date sell-off. I have added it to my personal Watchlist for this reason and will consider buying shares over the next several months, particularly on material dips. In my view, Burry’s endorsement of this investment style category is a plus.
Top 10 Holdings
Per Seeking Alpha, the Fund’s top ten holdings are as follows as of September 30, 2022:
Gilead Sciences Inc 2.46%
Unilever PLC ADR 2.38%
AbbVie Inc 2.31%
BP PLC ADR 2.24%
SoftBank Corp 2.23%
Exxon Mobil Corp 2.22%
Novartis AG ADR 2.15%
IBM Corp 2.13%
Deutsche Telekom AG 2.11%
Glencore PLC 2.06%
Total 22.29% [Overall # of Holdings 110]
Notably, the technology sector constitutes less than five percent of the Fund’s holdings, making this Fund a relative defensive, value-oriented fund. With growth crashing in this rising rate environment, the Fund’s value approach is likely a positive factor, at least in the near term.
Dividends
The fund has paid a consistent dividend since its inception in 2016 (see below); the current dividend yield is near 4.50% (per Seeking Alpha as of the October 30, 2022); and the trajectory of the dividend over time seems to be up, even if not up in a straight line. The strong dividend is a positive factor in my view.
| Ex-Div Date | Record Date | Pay Date | Frequency | Amount | Adj. Amount |
| – | – | – | – | – | |
| 09/22/2022 | 09/23/2022 | 09/28/2022 | Quarterly | 0.4594 | 0.4594 |
| 06/23/2022 | 06/24/2022 | 06/29/2022 | Quarterly | 0.2842 | 0.2842 |
| 03/24/2022 | 03/25/2022 | 03/30/2022 | Quarterly | 0.2679 | 0.2679 |
| – | – | – | – | – | |
| 12/23/2021 | 12/27/2021 | 12/30/2021 | Quarterly | 0.2827 | 0.2827 |
| 09/23/2021 | 09/24/2021 | 09/29/2021 | Quarterly | 0.6101 | 0.6101 |
| 06/21/2021 | 06/22/2021 | 06/25/2021 | Quarterly | 0.1920 | 0.1920 |
| 03/22/2021 | 03/23/2021 | 03/26/2021 | Quarterly | 0.2462 | 0.2462 |
| – | – | – | – | – | |
| 12/21/2020 | 12/22/2020 | 12/28/2020 | Quarterly | 0.2921 | 0.2921 |
| 09/21/2020 | 09/22/2020 | 09/25/2020 | Quarterly | 0.5125 | 0.5125 |
| 06/22/2020 | 06/23/2020 | 06/26/2020 | Quarterly | 0.1625 | 0.1625 |
| 03/23/2020 | 03/24/2020 | 03/27/2020 | Quarterly | 0.2153 | 0.2153 |
| – | – | – | – | – | |
| 12/24/2019 | 12/26/2019 | 12/27/2019 | Quarterly | 0.3476 | 0.3476 |
| 09/24/2019 | 09/25/2019 | 09/26/2019 | Quarterly | 0.4325 | 0.4325 |
| 06/25/2019 | 06/26/2019 | 06/27/2019 | Quarterly | 0.2820 | 0.2820 |
| 03/26/2019 | 03/27/2019 | 03/28/2019 | Quarterly | 0.3215 | 0.3215 |
| – | – | – | – | – | |
| 12/24/2018 | 12/26/2018 | 12/27/2018 | Quarterly | 0.2568 | 0.2568 |
| 09/25/2018 | 09/26/2018 | 09/27/2018 | Quarterly | 0.3769 | 0.3769 |
| 06/26/2018 | 06/27/2018 | 06/28/2018 | Quarterly | 0.2444 | 0.2444 |
| 03/27/2018 | 03/28/2018 | 03/29/2018 | Quarterly | 0.2230 | 0.2230 |
| – | – | – | – | – | |
| 12/27/2017 | 12/28/2017 | 12/29/2017 | Quarterly | 0.2248 | 0.2248 |
| 09/26/2017 | 09/27/2017 | 09/28/2017 | Quarterly | 0.2632 | 0.2632 |
| 06/27/2017 | 06/29/2017 | 06/30/2017 | Quarterly | 0.2180 | 0.2180 |
| 03/28/2017 | 03/30/2017 | 03/31/2017 | Quarterly | 0.1726 | 0.1726 |
| – | – | – | – | – | |
| 12/28/2016 | 12/30/2016 | 01/03/2017 | Quarterly | 0.2281 | 0.2281 |
| 09/13/2016 | 09/15/2016 | 09/16/2016 | Quarterly | 0.1159 | 0.1159 |
| 06/14/2016 | 06/16/2016 | 06/17/2016 | Other | 0.1788 | 0.1788 |
Source: Seeking Alpha
Strategically, I may dip my toe into the Fund right before the next ex-dividend date in December (not currently announced), if not sooner.
Performance
YTD Performance (Seeking Alpha)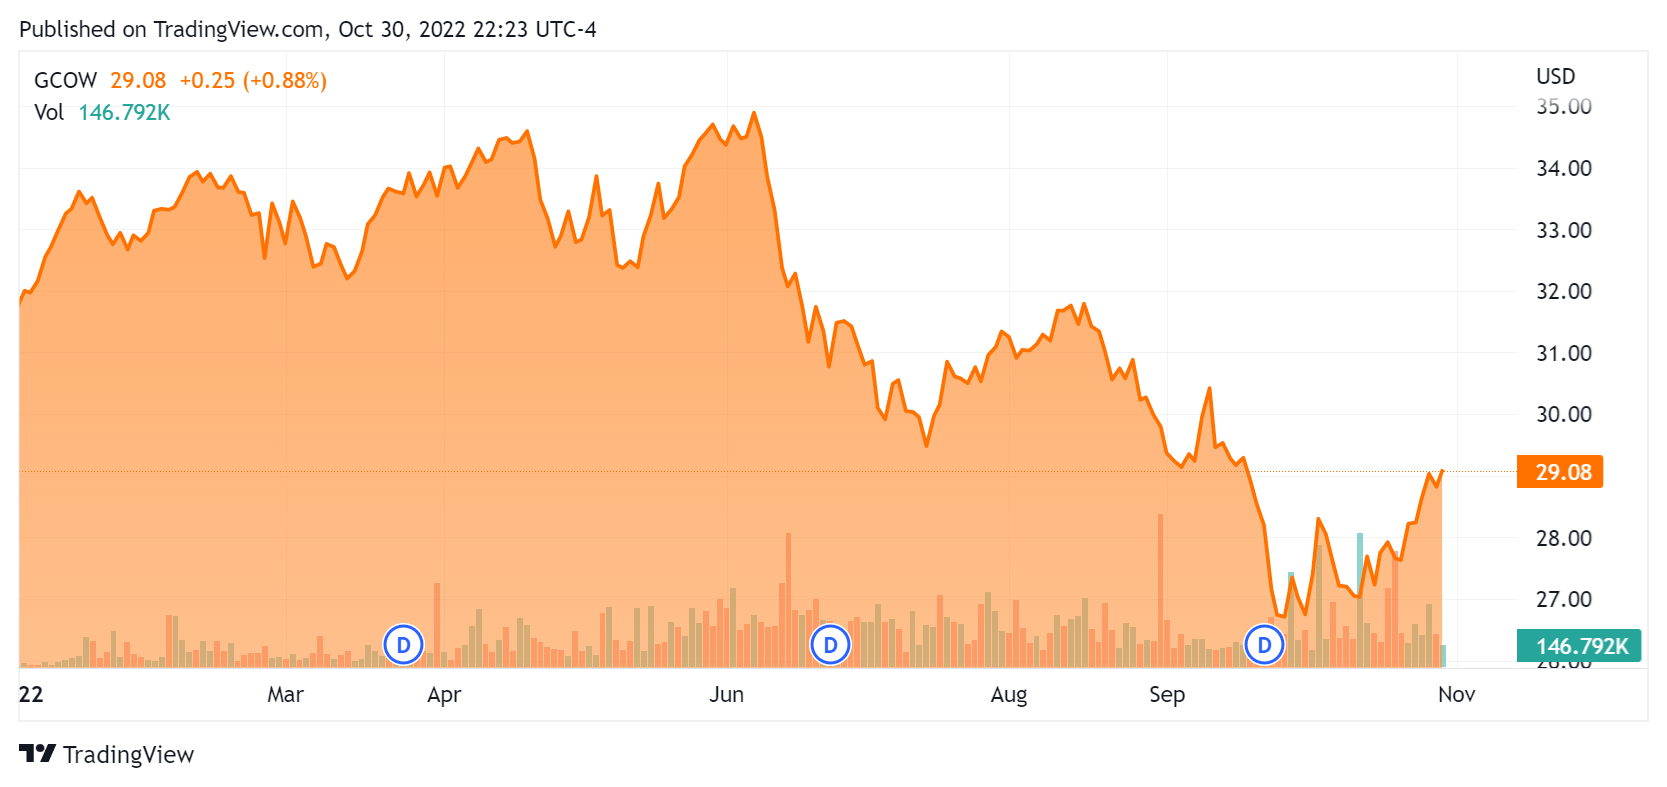
While the Fund is down year to date (5.12% as of 10/31), it is performing far better than the S&P500 (down 18.2% y-t-d), the Dow (down 9.6%) and the Nasdaq 100 (down 29.3%) [in each case as of October 30th]. Long-term performance has materially trailed these indexes, however, and should growth stocks reassert themselves, I would expect the Fund to underperform again. The real question is whether value stocks are about to dominate growth over the next three to five years; if they are, then the Fund should do well.
Conclusion
In an environment where capital is becoming more expensive and liquidity is drying up, the Fund features global companies that are generating cash and willing to share that cash with their investors. The quantitative stock selection process ensures that quality companies remain in the Fund. If we are entering into an extended period of significant underperformance of growth funds, the Fund should outperform.
Year-to-date, value stocks are materially outperforming growth stocks, as can be seen in the ETF comparison below.
Value versus Growth (YCharts/Seeking Alpha)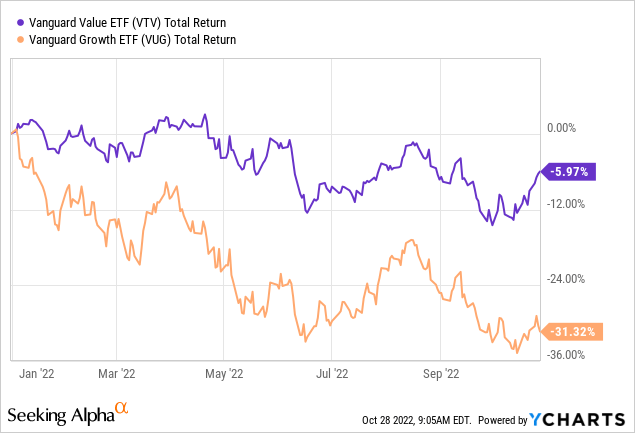
Moreover, even if the above trend in favor of value funds does not persist (a risk for sure), I think the Fund can serve as a bond proxy of sorts given its high yield and defensive characteristics. Indeed, the cash flowing companies in the Fund are, in my view, a better investment than buying intermediate or longer-term bonds of overly indebted governments, including Uncle Sam.
For the foregoing reasons, I have added the Fund to my Watchlist. Since I think the overall market has further to fall, however, I currently consider the Fund a Hold. Other Fund risks are enumerated in the Fund’s prospectus. Do your own due diligence! Cheers.