UPRO Investor Activity Neutral But Sentiment Still Says Higher
Pgiam/iStock via Getty Images
Article Summary and Conclusion
This is a follow-up to our November 23rd article on the ProShares UltraPro S&P500 (NYSEARCA:UPRO) ETF, titled: UPRO Still Positive After 2 Years And 2 Bear Markets. At time of that publication, UPRO was $37.86. It is currently $35.41, which is down 6.5%. Internal investor activity in UPRO is unequivocal at this time and not indicating a direction for the market. This is opposite to what cash flow metrics in other ProShares ETFs are indicating, that we are probably in a trading range market. This is explained in this article: Is Recent Investor Activity In SQQQ Signaling A Changing Market?
The short-term Master Sentiment Indicator, however, which gave a buy signal at the end of the year, still points to higher prices. Because of this, the current market environment is favorable for short term traders to go long UPRO when short term, oversold conditions exist.
Risk Warning
The following warning about using highly leveraged ETFs is provided by ProShares:
ProShares UltraPro S&P500® (the “Fund”) seeks daily investment results, before fees and expenses, that correspond to three times (3x) the return of the S&P500 Index (the “Index”) for a single day, not for any other period. A “single day” is measured from the time the Fund calculates its net asset value (“NAV”) to the time of the Fund’s next NAV calculation.
The return of the Fund for periods longer than a single day will be the result of its return for each day compounded over the period. The Fund’s returns for periods longer than a single day will very likely differ in amount, and possibly even direction, from the Fund’s stated multiple (3x) times the return of the Index for the same period. For periods longer than a single day, the Fund will lose money if the Index’s performance is flat, and it is possible that the Fund will lose money even if the level of the Index rises.
One should also read this detailed message from the SEC on the risks inherent in leveraged ETFs: Updated Investor Bulletin: Leveraged and Inverse ETFs.
Short Term – Master Sentiment Indicator
The master sentiment index, which is graphed below, is a composite indicator made from seven other short-term sentiment indicators. This explanation is from an earlier article:
The ST-MSI (Short Term Master Sentiment Indicator) is composed of seven sentiment indicators that are calculated daily. We adjust the data of each to reflect a shorter-term view of the market. They’re combined into one indicator using our SK ranking system. The components that make up the ST-MSI are:
- Hulbert Rating Service (Stocks)
- Hulbert Rating Service (Nasdaq)
- VIX
- 20% Equity P/C
- 20% Total P/C
- ProShare Bull/Bear Purchase Ratio
- ProShare UltraPro Bull/Bear Purchase Ratio”
In our SK ranking system, the green zone represents moments of extreme bearish sentiment, which represent buying opportunities, while the red zone represent extreme bullishness. It is a contrary opinion indicator. The black dashed arrows indicate market moments since 2016 when there was extreme bearishness. The last extreme reading was in January. In our opinion this indicator is still signaling higher prices.
Short Term Master Sentiment Indicator (Michael McDonald)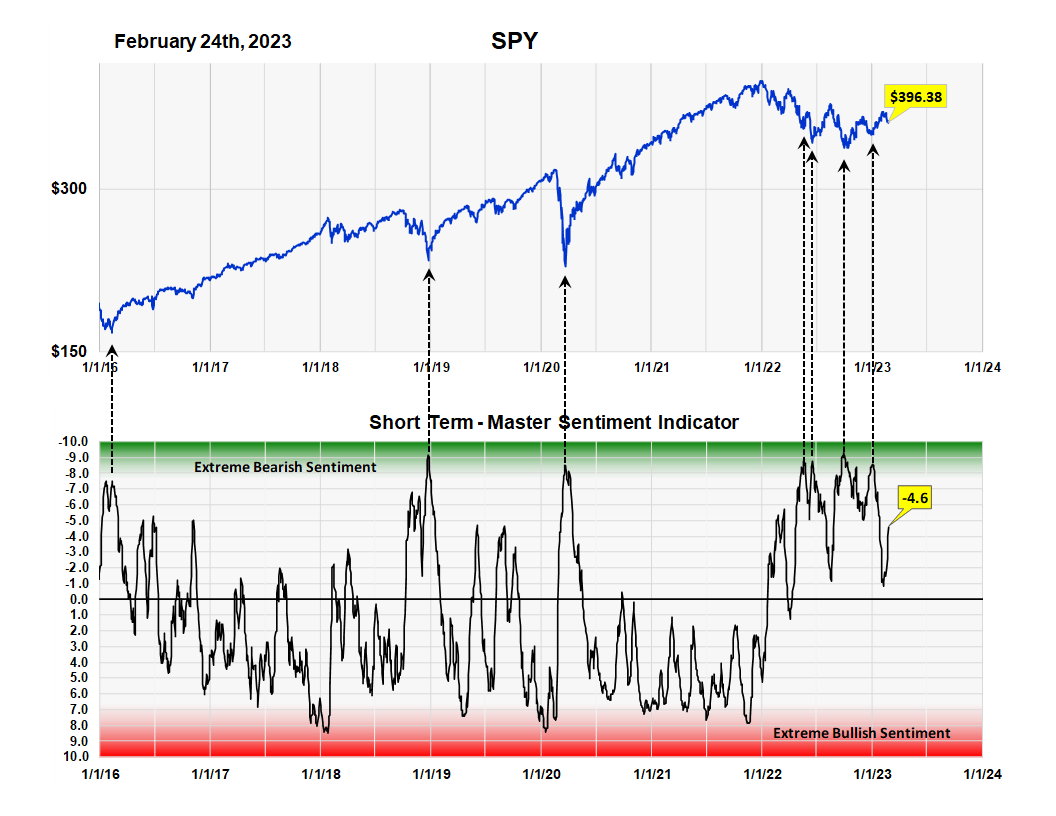
History of UPRO NAV
The fund’s NAV since inception is shown in the chart below. As the graph shows, from the low in March of 2020 to the high at the end of 2022, the price of UPRO went from $9.35 to $77.17. This is a gain of 725%. From that high to the low in October, the fund declined 63%. It’s currently up 25% from year end low. These wide swings both up and down, show the tremendous profit potential of leveraged ETFs, as well as their substantial risks.
History of UPRO NAV (Michael McDonald)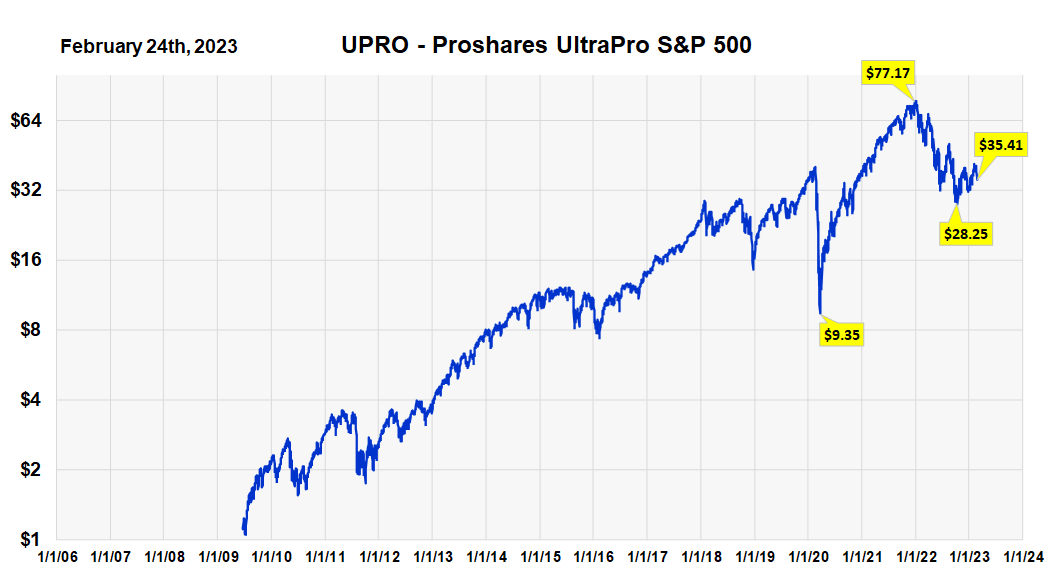
UPRO Shares Outstanding
The chart of shares outstanding in this fund shows that, in the past, investors in UPRO have shown relatively good market timing. Peaks in shares outstanding occur when more investors are entering the fund then leaving and they seem to occur at major price lows as indicated by the black arrows.
The current number of 62,400,000 shares hasn’t changed much over the last four months. This means that the number of investors entering the fund has been about equal to the number leaving. This means no net opinion. In fact, the number of shares outstanding is about 40% less than in 2016 which means to us that investors seem to be slowly losing interest in this highly leveraged fund
History of UPRO Shares Outstanding (Michael McDonald)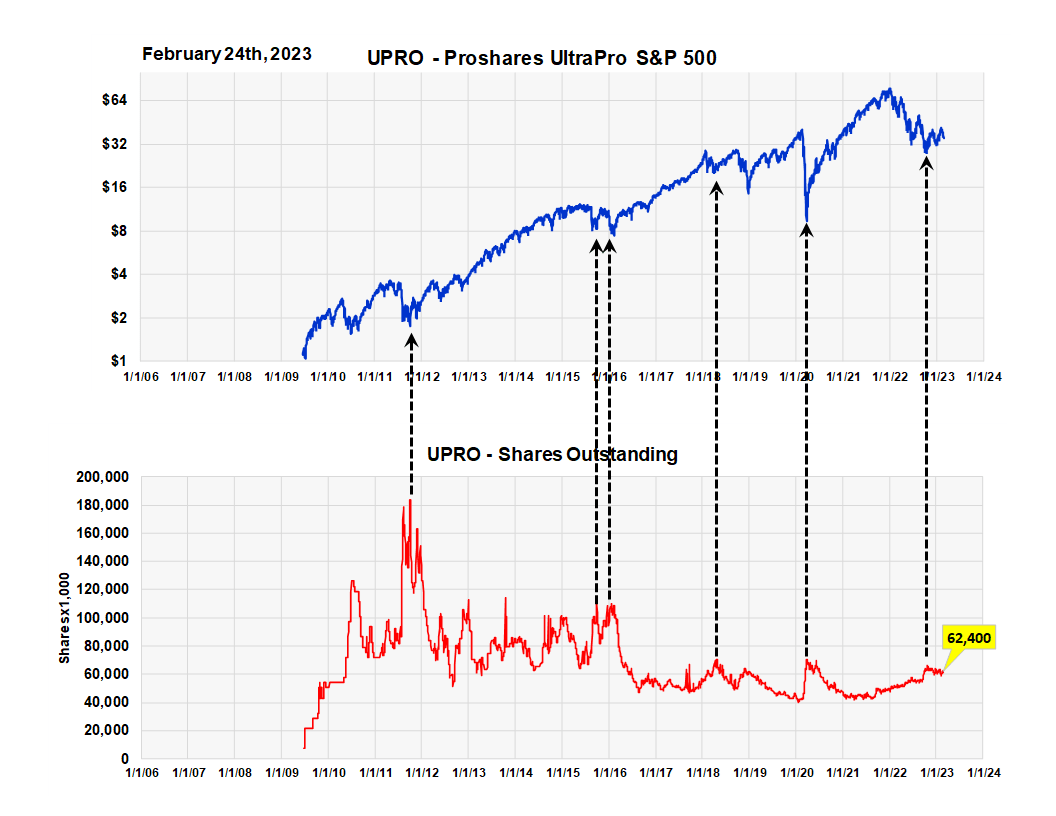
Total Assets Under Management – UPRO
UPRO is the seventh largest fund in the ProShares family and, with $2.2 billion in assets, it accounts for 3.6% of the fund family. The fact that total assets have been flat over the last four months, which is similar to the number of shares outstanding, is telling us that investor activity in UPRO isn’t saying much about the direction of the market at this time.
History of UPRO AUM (Michael McDonald)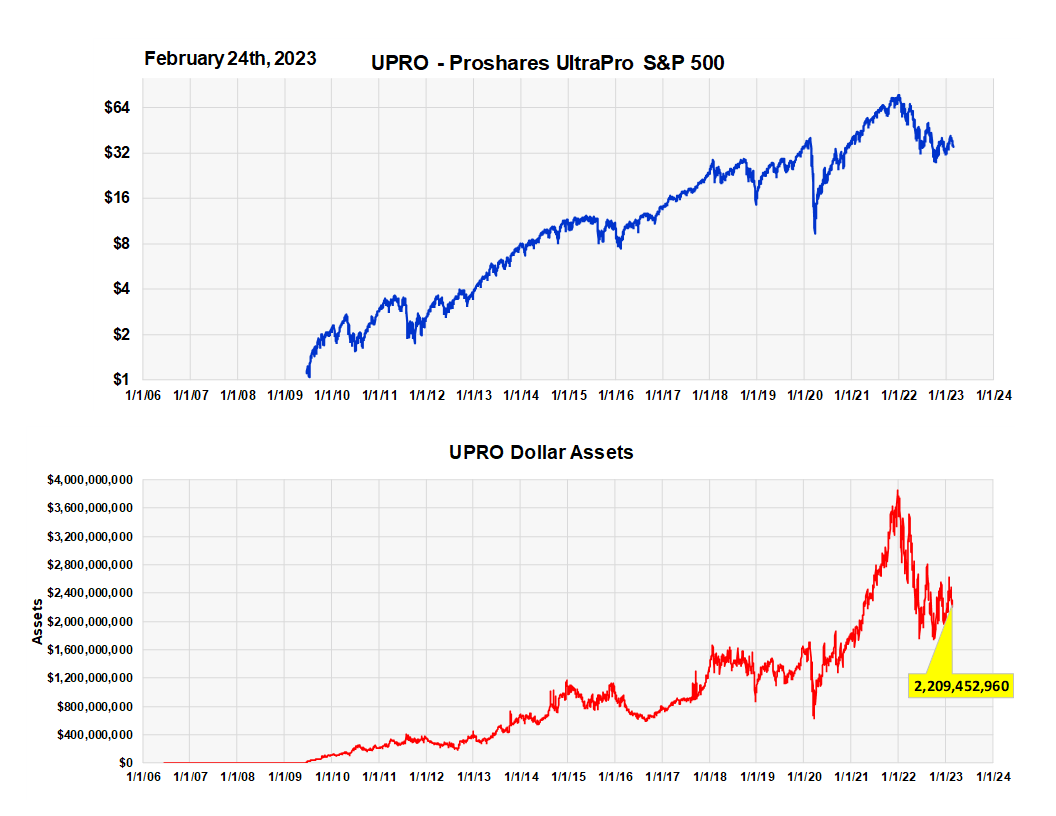
Buying levels in UPRO
We have another way of measuring investor buying. It’s by calculating the dollar amount of daily buying in UPRO as a percentage of total assets. The graph points to periods of high percent of since 2016 with black, dashed arrows.
The ratio is currently at 19.1%. A low number is 10%. The highest ratio in the last eight years was 70%. As the chart shows, the current ratio is historically in the middle range of values and so, like SO and AUM, the buying levels of UPRO also aren’t saying much about investor expectations for this market.
Daily Purchasing of UPRO as percent of Assets (Michael McDonald)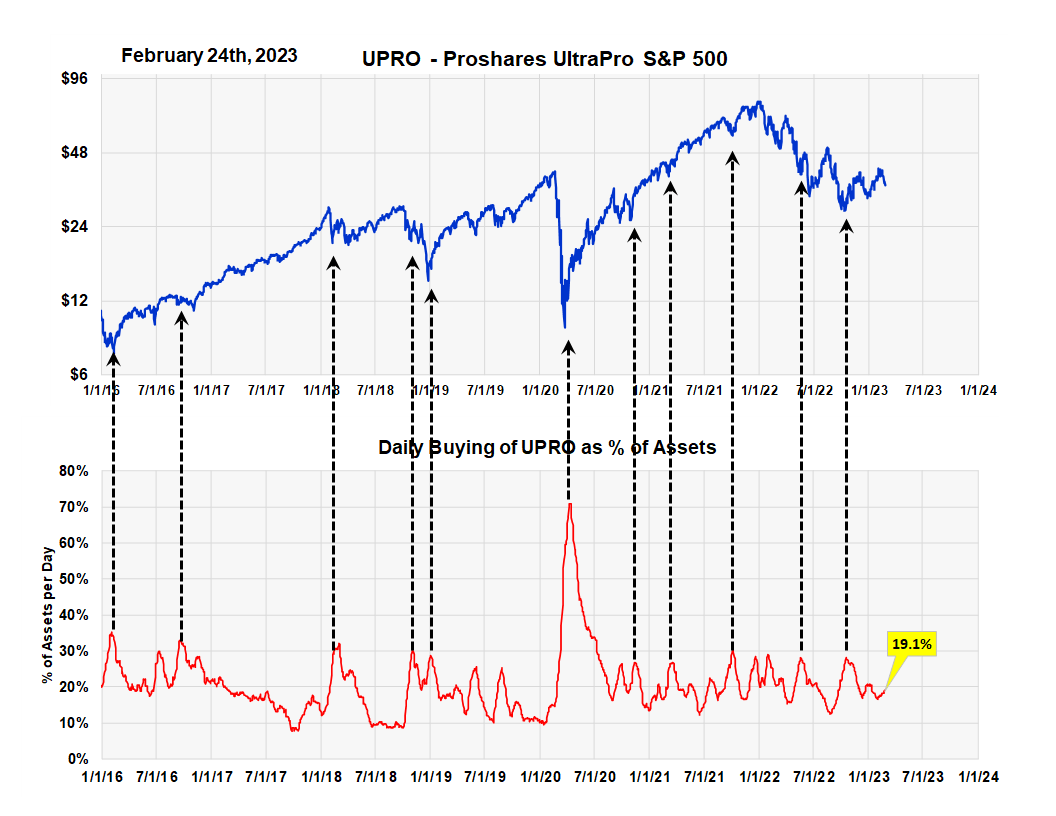
UPRO cash flow
And lastly, cash flow. If more people sell than buy over a given period of time, there is a net outflow of money. If more buy than sell, there is a net flow of money into the fund. We then divide the amount by the average AUM over the period. In our calculation the time period is 40 trading days.
As the chart shows investor timing in SSO is rather good. At price lows you get positive cash flow as one would hope. Since the October buy signal, when cash flow was positive and indicated by the last dashed black arrow, the ratio has hovered around zero for four months. This net zero reading indicates that investor activity in UPRO at this time is not telling us much about market direction.
.
Forty Day Investor Cash Flow Cash in UPRO (Michael McDonald)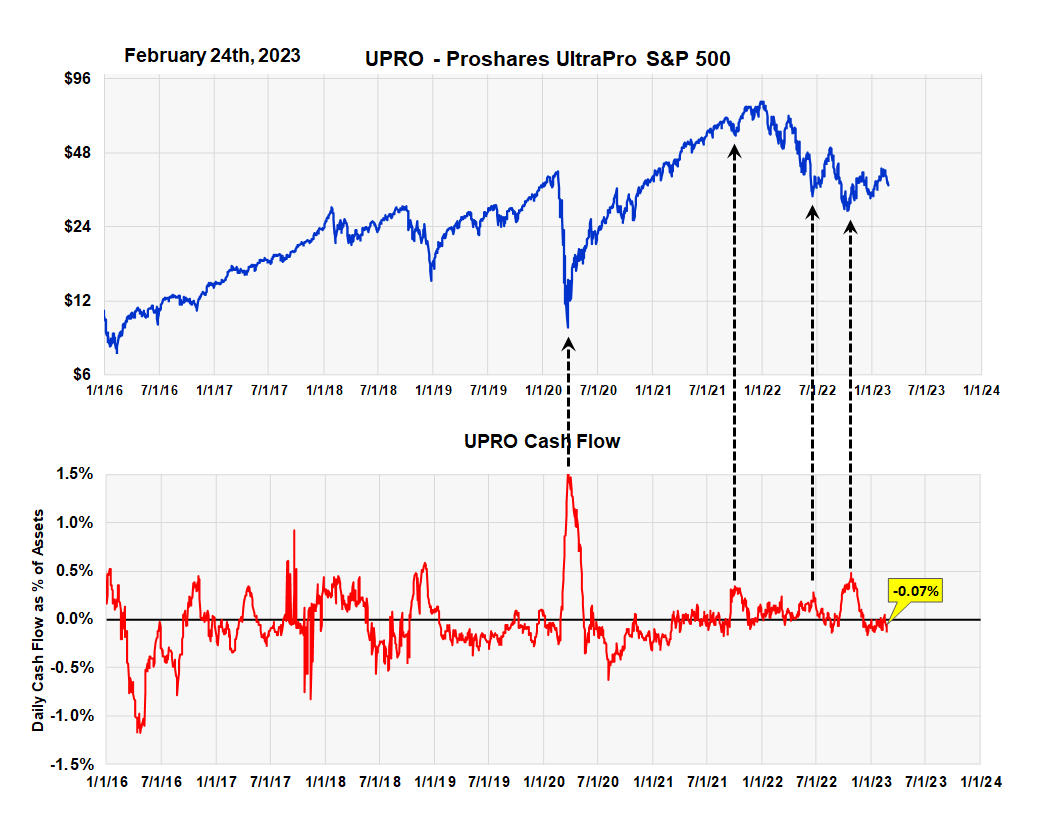
Takeaway
At the moment, investor activity in UPRO is not telling us much about what investors think about market direction. The last indication occurred at the October bottom when there was measurable cash flow into the fund. The one important sentiment indicator pointing to higher prices is the ST-MSI (short-term master sentiment index). It continues to confirm the strong buy signal at the beginning of this year. Because of this we recommend short-term traders tactically go long UPRO when oversold conditions present themselves.
Additional Risk Warning
From ProShares: Longer holding periods, higher Index volatility, and greater leveraged exposure each exacerbate the impact of compounding on an investor’s returns. During periods of higher Index volatility, the volatility of the Index may affect the Fund’s return as much as or more than the return of the Index.
The Fund presents different risks than other types of funds. The Fund uses leverage and is riskier than similarly benchmarked funds that do not use leverage. The Fund may not be suitable for all investors and should be used only by knowledgeable investors who understand the consequences of seeking daily leveraged (3x) investment results of the Index, including the impact of compounding on Fund performance. Investors in the Fund should actively manage and monitor their investments, as frequently as daily. An investor in the Fund could potentially lose the full value of their investment within a single day.