Ubiquiti: Needs Some Help To Rebound In 2023 (NYSE:UI)
jamesteohart
Ubiquiti Inc. (NYSE:UI) has been showing signs of slowing down, and it is reflected in its share price, which has plummeted from its 52-week high of 350.63 per share to its recent low of about $260.00 per share.
Although its revenue continued to grow, it failed to meet expectations by over $40.00 million, and with supply constraints continuing to weigh on the company, and rising input costs related to interest expenses and materials, the company will probably have to spend more in order to move the top line in the quarters ahead, which would further degrade its profitability metrics.
The major thing, in my opinion, the company has going for it is its net income margin, which has vastly outperformed the sector median, and is helping the company to boost the bottom line, even as other metrics underperform the sector.
In this article we’ll look at some of the numbers from its latest earnings report, its profitability metrics, its struggle to maintain momentum, and how I see the stock performing in the latter part of 2023 and early 2024.
TradingView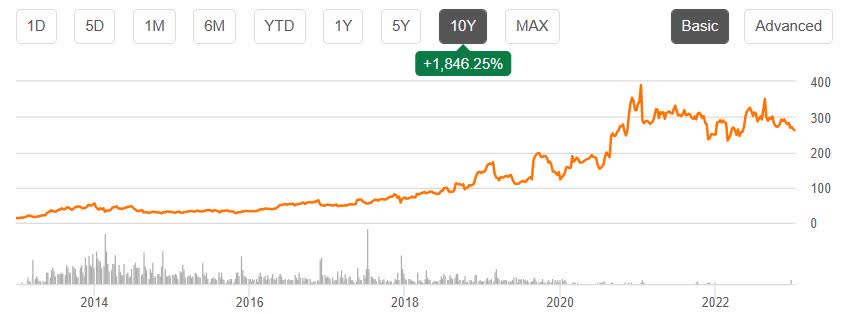
Some of the numbers
Revenue in the second fiscal quarter of 2023 was $493.6 million, compared to revenue of $431.6 million in the second fiscal quarter of 2022; it was up 14.37 percent year-over-year, but missed expectations by $40.97 million.
Its Enterprise Technology segment accounted for the bulk of the revenue, coming in at $417.4 million in the quarter, compared to $330.4 million in revenue year-over-year. Service Provider Technology generated revenue of $76.2 million in the second fiscal quarter of 2023, compared to $101.2 million in revenue in the same reporting period last year.
Gross margin in the quarter was 40.0 percent, up 5.6 percent sequentially, but down 0.5 percent year-over-year. The improvement in gross profit sequentially was attributed to a more favorable product mix and a drop in shipping costs. On a year-over-year basis, the decline in gross margin came from a less favorable product mix and higher shipping costs.
Net income in the reporting period was $112.2 million, or $1.86 per diluted share, compared to $103.6 million, or $1.66 per diluted share in the second fiscal quarter of 2022.
The company had cash and cash equivalents of $159.5 million at the end of calendar 2022, and long-term debt of $869.9 million.
Profitability
When measured against the sector median, UI stands out against its peers, with the major exception being gross profit margin (TTM), where it was 36.51 percent, compared to the sector median of 49.18 percent, a differential of 25.76 percent.
On the other hand, in a metric that I consider to be more important – net income margin (TTM) – it was far superior to the sector median, with 19.42 percent in that category, compared to a 2.89 percent sector median, better on average by 572.57 percent.
Return on total capital (TTM) was 43.39 percent, compared to 3.23 percent for the sector, better by 1,239.18 percent.
Return on total assets (TTM) was 27.45 percent, compared to the sector median of 1.54 percent, better by 1,682.67 percent.
Cash from operations was $176.47 million, compared to the sector median of $56.01 million, higher by 215.05 percent.
Finally, net income per employee (TTM) was $252.90k, compared to the sector median of $4,703.97, better by 5,276.34 percent.
While most of the numbers above moderate over a 5-year period (see the chart below), the company still outperforms in most metrics over the long term as well when measured against the sector.
Seeking Alpha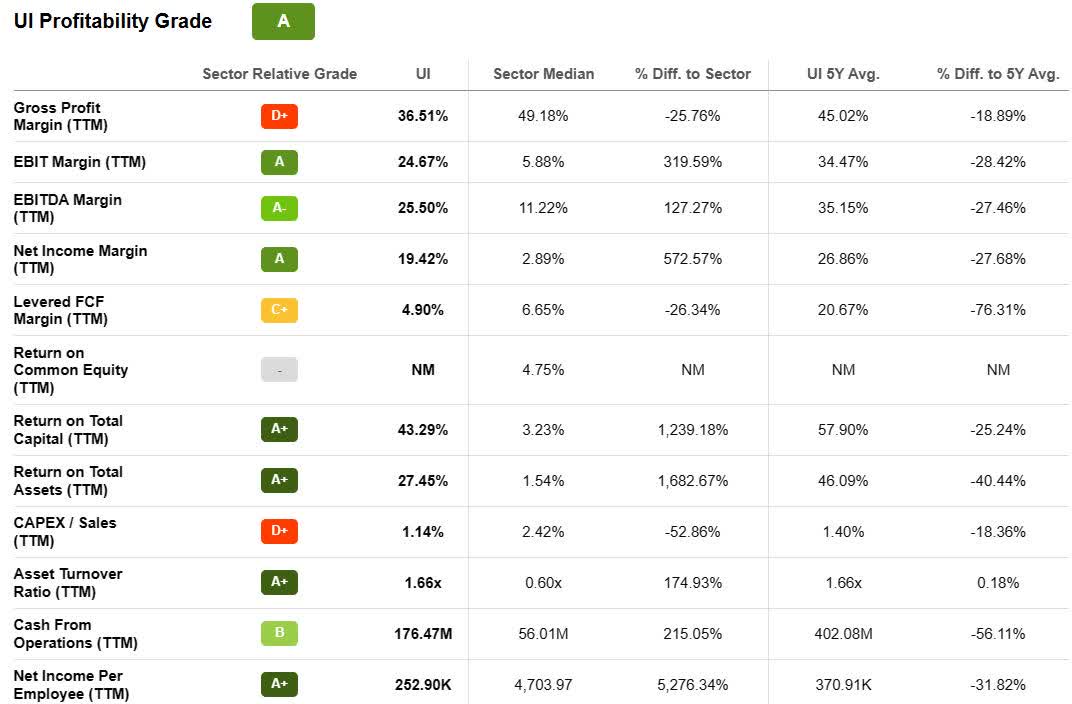
This would suggest a lot of momentum going forward, but it has been showing some signs of slowing down.
Seeking Alpha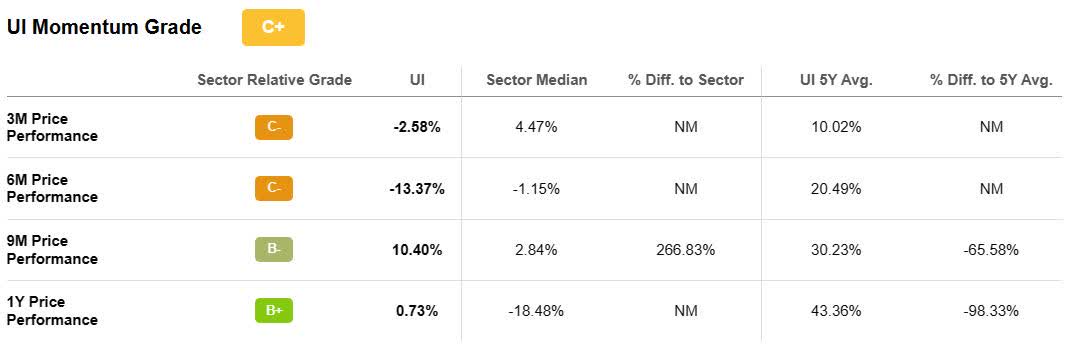
One of the headwinds that remains in play is ongoing supply chain constraints that the company is struggling to mitigate. Management stated that there is no certainty as to how long supply chain constraints are going to be an issue.
Some of the steps being taken to deal with it are to increase inventory build, pay higher component and shipping costs to secure supply, and modifying some of its product designs in order to “leverage alternate suppliers.”
It was noted by management that taking these steps include the risk of increasing the number of finished goods and raw materials inventory, resulting in potential inventory that is obsolete, an excessive number of raw materials, and the potential losses associated with that.
It of course also increases expenses, which could put downward pressure on the bottom line of the company. Supply constraints are likely the reason behind the revenue miss, but if it’s to boost revenue, it will have to increase expenditures and its inventory levels, which again, could have an impact on the profitability of the company going forward.
Another cost input to watch is the increase in interest expenses, which are likely to continue to climb. In the reporting period it was $11.3 million, compared to $2.7 million year-over-year. With interest rates expected to climb and hold at higher levels, and the company needing to spend more to boost inventory to meet demand, there is some risk to profitability in the quarters ahead.
Valuation metrics
On the valuation side, I thought the company would be doing better, but it was surprising how it underperformed the sector median.
For example, with its P/E GAAP (TTM), it was 45.70, compared to the sector median of 22.10 (TTM), higher by 106.76 percent. It did improve on a P/E GAAP (FWD) basis, with that being 35.83, but it was still 49.07 percent higher than the sector median of 24.04.
EV/Sales (TTM) was 9.27, compared to the sector median of 2.68, up by 246.31 percent. EV/Sales (FWD) was 8.33, compared to the sector median of 2.70, higher by 208.59 percent.
Price/Sales (TTM) was 8.86, compared to the sector median of 2.59, higher by 242.14 percent. Price/Sales (FWD) was 7.93, compared to the sector median of 2.59, higher by 205.97 percent.
Based upon the metrics above and the risk factors related to higher input costs and supply constraints, for now I see the company as close to being valued where is should be, or possibly a little higher.
Seeking Alpha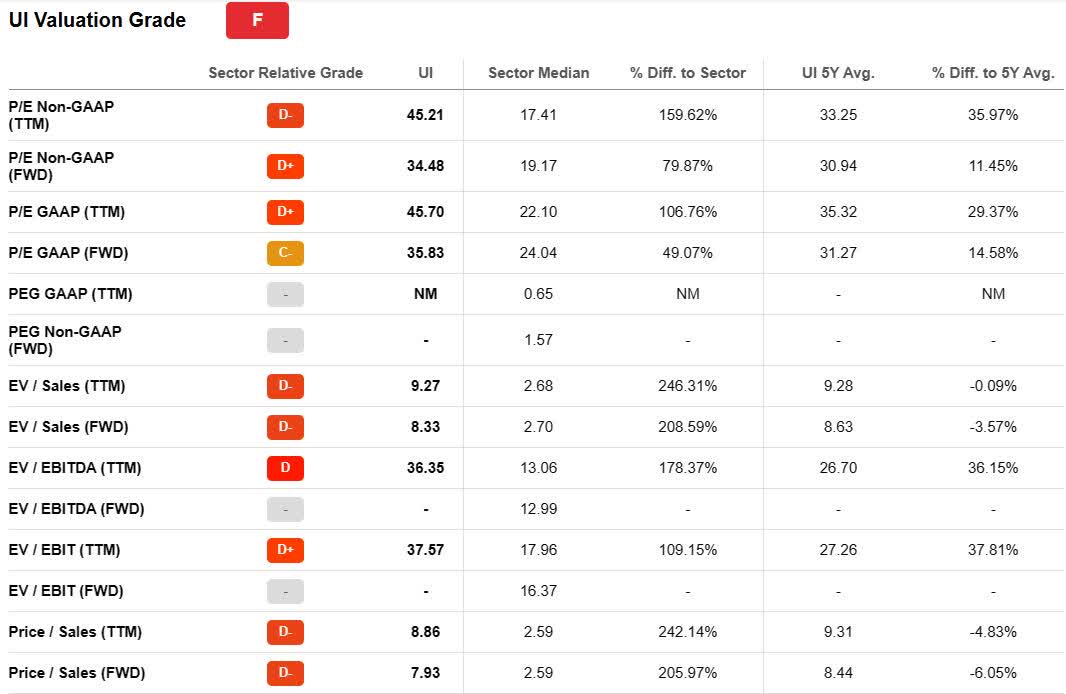
Conclusion
I think 2023 is going to be an important year for UI in relationship to momentum and profitability because of rising interest rates, higher input costs, and uncertainty as how its elevated inventory levels have an impact on the company if demand wanes and some of its products become obsolete.
Even so, we may be approaching a period of recovery in the tech sector, and if that’s how it plays out, based upon the market believing the Fed is close to ending its interest rate hikes, and possibly could moderately lower them sometime in 2023, it would be a tremendous tailwind for UI, and it would likely benefit from that, even if its near-term performance doesn’t meet expectations; that’s the best-case scenario.
Another factor to consider is the stock has been on a prolonged upward run since January 2016, when it was trading at approximately $25.50 per share, soaring by over 10x during that time. Much of the growth appears to be already priced in, and there needs to be some significant, positive catalysts in place in order to drive the company to much higher levels in a sustainable and consistent manner.
Outside of the potential benefit at the macro-economic level from a perceived more positive interest rate environment, I’m not seeing the levers in place at this time that would result in any upside surprises.
Over the long-term UI has potential, but with its share price at what I consider to be an elevated level, even after pulling back significantly from its 52-week high of $350.63 per share in the latter part of October 2022.
Unless the company manages to mitigate its supply chain constraints and higher input costs, I see it falling further. If it is able to do so and surprise to the upside in revenue and the bottom line, it would probably be the catalyst the company needs to rebound in the latter part of 2023 and further out.