The Stock Market Bounce Needs A Weaker Dollar
Ildo Frazao/iStock via Getty Images
The Liquidity Shock Phase Selloff is easing
History shows that over long term stock market trends higher, thus, long-only passive investment strategy, which includes dollar-cost averaging, makes sense. Yet, here and there, there are corrections, or up to 20% drawdowns, and every 7-8 years on average there are recessions – which produce the recessionary bear markets with 20-50% drawdowns. Tactical investors try to sell before these large corrections, and especially before the recessionary bear markets.
As I previously explained, these large selloffs usually come in Phases, and the full bear market usually comes in three phases:
- Phase 1 – The Liquidity Shock stage – the selloff in anticipation of the expected monetary policy tightening where the speculative stocks/assets drop the most, and the PE ratios contract.
- Phase 2 – The Imminent Recession selloff – happens if the policy tightening (Phase 1) causes a recession, generally if the Fed inverts the 10Y-3mo yield curve spread.
- Phase 3 – The Credit Crunch selloff – if the recessions (Phase 2) is particularly deep and causes the systematic credit event, which in turn creates forced selling – for example the Lehman Brothers bankruptcy.
We are currently in one of these rare bear markets, with S&P 500 (SPY) down 24% from peak to trough, currently down by 20% YTD. Specifically, we are in the Phase 1 selloff stage – the liquidity shock in response to the expected aggressive monetary policy tightening.
What happens next? The liquidity shock of the Phase 1 will inevitably end when the Fed policy becomes clear. In fact, we were at the peak Fed hawkishness on June 17th, where the market expected the Fed to hike 3.67% in 2022. This is essentially when the S&P 500 reached the bottom. Currently, the market expects the Fed to hike to 3.33% in 2022, but then to start cutting by Aug 2023 down to 2.23% by July 2024.
Global Academic View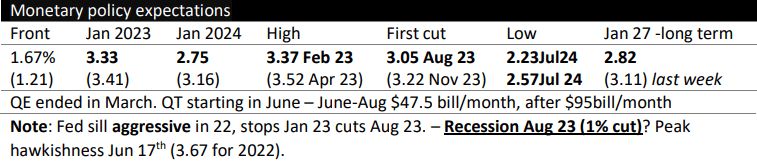
Thus, it appears that the liquidity shock is easing with the pricing of less aggressive Fed, and the pricing of ending of monetary policy tightening – the Phase 1 selloff is ending.
The Dollar holds the key to what comes next
One of the key characteristics of the liquidity shock is a stronger US Dollar (UUP), particularly versus the Euro (FXE), which is down 8% YTD.
First, generally, the expectations of an increasingly aggressive Fed is the US Dollar positive. Second, the US Dollar is a safe haven during the stock market selloffs. Third, the global shortage of dollars occurs during the low liquidity in global financial markets when global investors seek US Dollar to meet margin calls and other funding needs.
One of the key charts is the relative performance of the Euro versus the emerging markets ETF (EEM). The chart below shows essentially the identical chart – depreciating Euro and falling EEM.
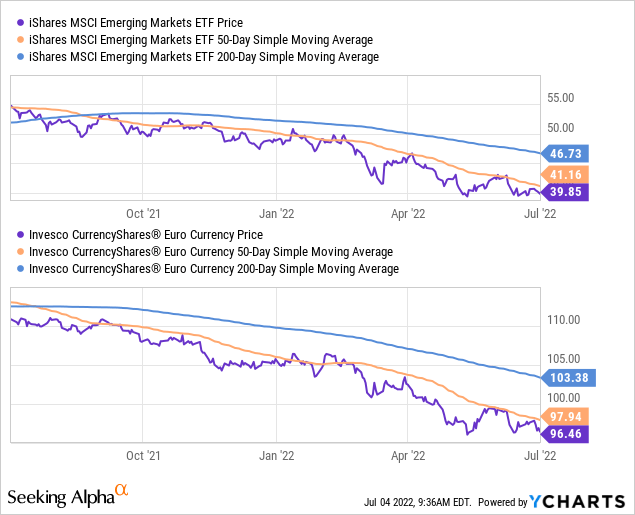
Technically, both the Euro and the EEM are at the triple bottom support, facing the downtrading 50dma resistance. The simultaneous breakout above 50dma for FXE and EEM could signal the end of Phase 1 liquidity selloff and the beginning of the sustainable rally in risk assets, including S&P 500. Of course, the breakout must be supported with the sign of the Fed’s (modest) dovish turn.
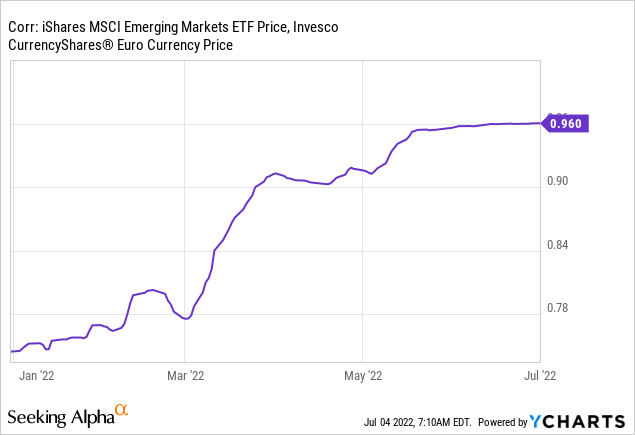
The chart above is supported with the actual correlation between the Euro and EEM, which has been at 0.96 during June 2022 – perfectly correlated falling EEM and depreciating Euro. Thus, to see a sustainable rally in stocks, in this case EEM, we need to see the stronger Euro, (weakening USD) – this will mark the end of Phase 1 selloff.
The bigger question? What comes after the Phase 1?
The perfectly positive correlation between the Euro and EEM could also break if the USD weakens, but stocks continue to fall. In this case, the Phase 1 selloff would transition directly to Phase 2 selloff – or an imminent recession.
For this scenario to happen, the Fed would have to invert the 10Y-3mo spread, but mostly reflected by falling 10Y yields (TLT). Falling 10Y Treasury Bond yields would signal that the market is anticipating a recession, while the Fed would continue to hike, even after the modest dovish turn. Specifically, the Fed could hike only to 2.75%, but if the 10Y yields fall below 2.75% the spread would be inverted.
Currently, the 10Y yields are just under 2.90%, while the Federal Funds rate will be at 2.25-2.50 after the June Fed meeting. Not too far from meeting at 2.75%.
I see the possibility that the Fed stops at 2.50% if the 10Y yields keep falling – which will reduce the recession probability and allow the 10Y yields to rise above 3% – this would be the boost needs to cause the weaker USD and higher stock prices – at least a sustainable bounce between the Phase 1 stage and a possible Phase 2 selloff stage.
Note on EEM
The iShares MSCI Emerging Markets ETF (EEM) has a PE ratio of 14.78. It is down by 27% over the last 12 months. These are the sector weights (Tech and Financials represent 42% of the index), and country weights (China is 31% of the Index):
MSCI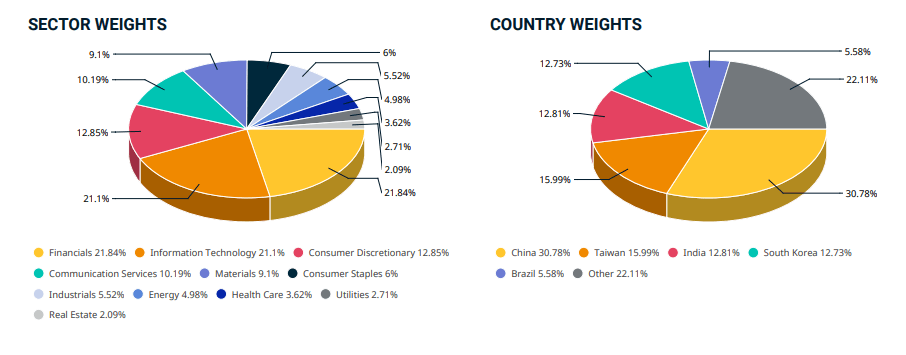
Given that emerging markets are particularly sensitive to the liquidity risk (the Fed and the US Dollar) – the anticipated ending of the Phase 1 liquidity shock selloff will boost EEM.
The break above the 50dma and EEM, with the simultaneous break above the 50dma on the Euro, and some evidence of the less aggressive Fed will be the trigger to buy stocks broadly.