SPY: The Elusive Fed Pivot (NYSEARCA:SPY)
Drew Angerer
The Fed pivot and the bullish scenario
The Wall Street Journal reported on Oct 21st, that the Fed is likely to start debating on when to end the current hiking cycle, with some possibly suggesting a sequence of 75bpt hike in November, 50bpt in December, and then possibly a pause. This would bring the Federal Funds rate to just under 4.5%.
The S&P500 (NYSEARCA:SPY) interpreted this as the Fed pivot, and staged a strong rally since, bouncing off the key long term support level. The bullish scenario is that the Fed would stop increasing interest rates before the anticipated recession arrives, which would possibly make the recession short and shallow. Given the 25%+ selloff in SPY YTD, that “shallow recession” is possibly already priced in – and thus the bottom is in possibly in place – right at the 200-week moving average, which makes sense technically and fundamentally.
Can the Fed really stop at 4.5%?
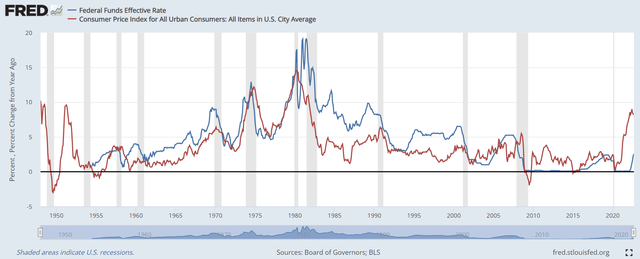
The graph below shows the Federal Funds rate (the blue line) and the CPI inflation (red line). What do you see? The blue line is generally above the red line, especially at the peak of the Fed’s hiking campaign, and especially after the inflationary period of 1970s, through the 1980s.
Now, the CPI is at 8.2%, while the Federal Funds rate is between 3-3.25%, expected to rise to 3.75-4% in November. This might be shocking – but the Fed simply cannot stop until it exceeds the CPI inflation. Thus, unless the CPI inflation magically drops to 4% early next year, the Fed’s pivot is just a hope.
We don’t even have the evidence that the CPI has peaked yet. Yes, most likely the CPI will moderate next year, but the Fed will still have to exceed that number and hold it there for some time. We don’t know where that number is, and neither does the Fed. But the short-term rates (SHY) are likely to continue to rise.
Note, this is not the core CPI, it’s not the PCE, it is the headline CPI number, which is usually the highest inflation reading. So, the bar for the Fed to catch up with the inflation is high.
What about the long-term rates and the yield curve spread?
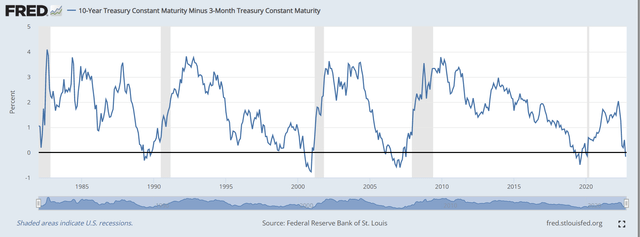
The Fed also has to deeply invert the yield curve spread to contain the inflationary pressures – specifically the spread between the 10Y Treasury Bond yield and the 3-month Treasury Bill yield (10y-3mo). The yield on 3-Month Bill, which reflects the Federal Funds rate might have to exceed the yield on 10-Year Treasury Bond by as much as 50bpt at the end of the Fed’s hiking cycle, as shown in the graph below.
Currently, the 10Y yield is right around 4%, so the Federal Funds rate at 4.5% makes sense.
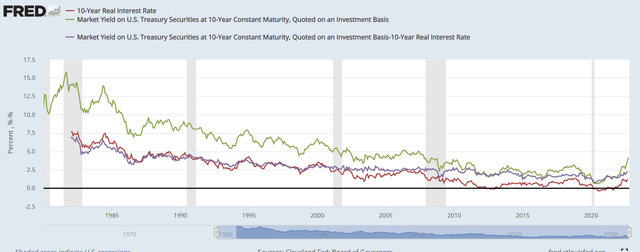
However, the 10Y yields are still artificially suppressed, and the QT program in place is design to remove the accommodation in long term interest rates (TLT). Specifically, the nominal yield on 10Y Treasury Bond (green line) can be decomposed into the real yield (red line) and the inflation expectations (blue line). As the graph below shows, prior to the 2000 recession, the real yield and the inflation expectations were about equal. The real yields started to fall below inflation expectations after the 2008 recession, due to the several rounds of QE.
The current QT program is designed to increase the real yields, back to the inflation expectations level.
Current equation:
Nominal yield 3.96% = Real yield 1.45% + Inflation expectations 2.51%
The real yields still have to increase to about 2.5%, which would push the nominal rate to about 5%, and the Federal funds rate at about 5.5%. Assuming that CPI falls to 5% by next year, the Fed could pause at 5.5%, sometimes in 2023.
If the CPI remains persistently above 6-7%, the inflation expectations would have to rise, which would increase the real and the nominal rates, and extend the Fed’s hiking cycle above 5.5%.
What about the recession probability?
The Fed’s preferred recession probability indicator, the 10Y-3mo is currently inverted, thus the recession is certain. This indicator has never failed to predict a recession. Currently, the 10y-3mo spread is at -0.09%. The deeper it gets and the longer it stays inverted, the deeper the upcoming recession will be.
But the Wall Street’s preferred recession probability indicator the 10y-2y spread has been flashing the warning signal for a long time. Here is my own computation of the recession probability using the Fed’s probit model, and the 10y-2y spread as the input:
Recession probability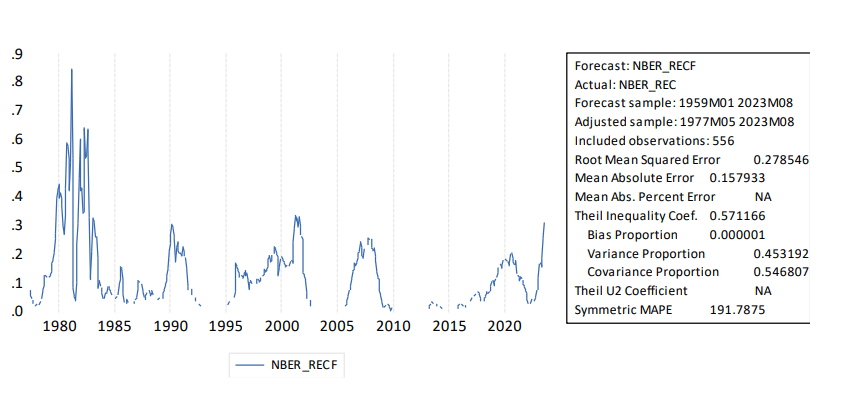
As you can see from the chart above, the recession probability now is higher than before the 2008 recession. The recession is coming. How deep? It depends on the Fed, which in turn depends on the CPI.
The Fed surely does not want to cause the deep recession, but given the CPI level, it might have to. For this reason, the Fed pivot is elusive.
Implications
The bullish scenario for SPY is premature, the Fed is not able to pivot yet, and in the process of fighting inflation, the Fed will likely have to cause a deep recession. Thus, the current bear market in S&P500 (SPY) is likely continue to unfold – the bottom is not in yet. Thus, my recommendation is still to Sell.
However, the Fed has made the errors before, and the Fed could make an error again – in this case to pivot prematurely. This would likely prolong the current bear market rally – but make the bear market longer and deeper.
SPY Sector analysis
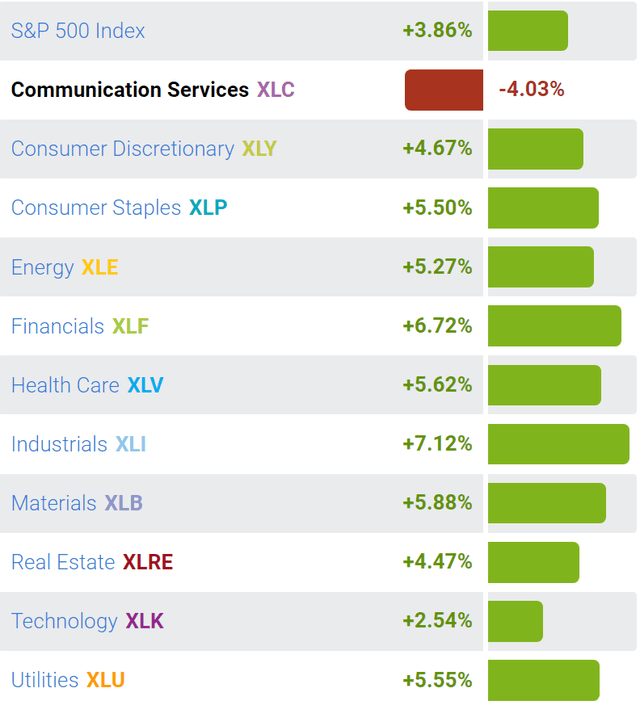
The week after the “Fed pivot hope”, the SPY spiked by almost 4%, and all sectors were up almost equally, suggesting that the spike was highly correlated and likely induced by the short covering in S&P500 (SPX) futures. The only sector down was the Communications (XLC), which was affected by the large earnings-related drops in Meta (META) and Alphabet (GOOG).
Highly correlated spikes do not form bottoms, and the earnings-related drops are likely to continue as the corporations acknowledge the upcoming recession.


