Schwab Dividend Equity ETF (SCHY): A Longer Track Record Brings Me Back For A Second Look
Yudram_TA
(This article was co-produced with Hoya Capital Real Estate.)
A little over a year ago, I reviewed Vanguard International High Dividend Yield ETF (VYMI). At the time, my opinion was that, while there was a lot I liked about this ETF, I thought investors could do better.
In the comments section, a reader asked “What do you think about SCHY?” Another reader responded to the effect that they liked this ETF very much but, since it was a relative newcomer to the marketplace, they felt like they wanted to allow a little more time to see how it performed. Since I had not yet reviewed SCHY, based on that reader interaction I decided it was high time I did so.
The ETF being referred to in the above comments is Schwab International Dividend Equity ETF (NYSEARCA:SCHY). As that reader alluded to, with an inception date of 4/29/2021, SCHY had only been in existence for about 10 months at the time of that review. At the same time, SCHY’s sibling, Schwab U.S. Dividend Equity ETF (SCHD), had been around for over 10 years! Further, I discovered that SCHY’s selection methodology basically mirrors that of SCHD. As a result, I opined that SCHD’s consistently excellent performance might be taken as a harbinger of how SCHY may perform.
Returning For A Second Look At SCHY
Ironically, both of those reviews were written literally weeks before Vladimir Putin decided to invade Ukraine and what I have referred to as “the world of 4,818” basically got turned upside down. Given that, and the fact that another full year has gone by, we have a chance to look backwards at how SCHY has performed, as well as how it may fare moving forwards. In the article, I will once again use both VYMI as well as Vanguard FTSE All-World ex-US ETF (VEU) to evaluate other possible alternatives an investor could consider.
First, let us very briefly summarize the index tracked and selection criteria for both SCHY and VYMI. In each case, you can find a deeper dive in my previous linked review, if you are interested.
Between SCHY and VYMI, SCHY would seem to have the more stringent criteria. First, included stocks must have sustained at least 10 consecutive years of dividend payments and meet other size and liquidity criteria. Next, eligible stocks are ranked based on four fundamental characteristics:
- Cash flow to total debt
- Return on equity
- Indicated dividend yield
- 5-year dividend growth rate
Finally, a volatility screen is applied, winnowing this list down to the 100 securities with the lowest volatility.
In contrast, VYMI starts with large- and mid-cap stocks in the FTSE All-World ex U.S. Index, excluding REITs, and ranks them by their expected dividend yield over the next 12 months. The index selects those representing the higher-yielding half of eligible dividend-paying stocks. This approach could be considered to offer greater diversification in the sense that many more stocks are allowed into the index than is the case with SCHY. However, from that point, the fund more or less relies on market cap weighting to control risk. In theory, this should limit the impact of any distressed firms, as well as emphasizing larger, more-stable firms that should have the capacity to continue making dividend payments.
How does all of this play out in practice? Let’s take a look a very nice combo graphic from their respective pages here on Seeking Alpha.
First, SCHY:
SCHY: Portfolio Characteristics (Seeking Alpha)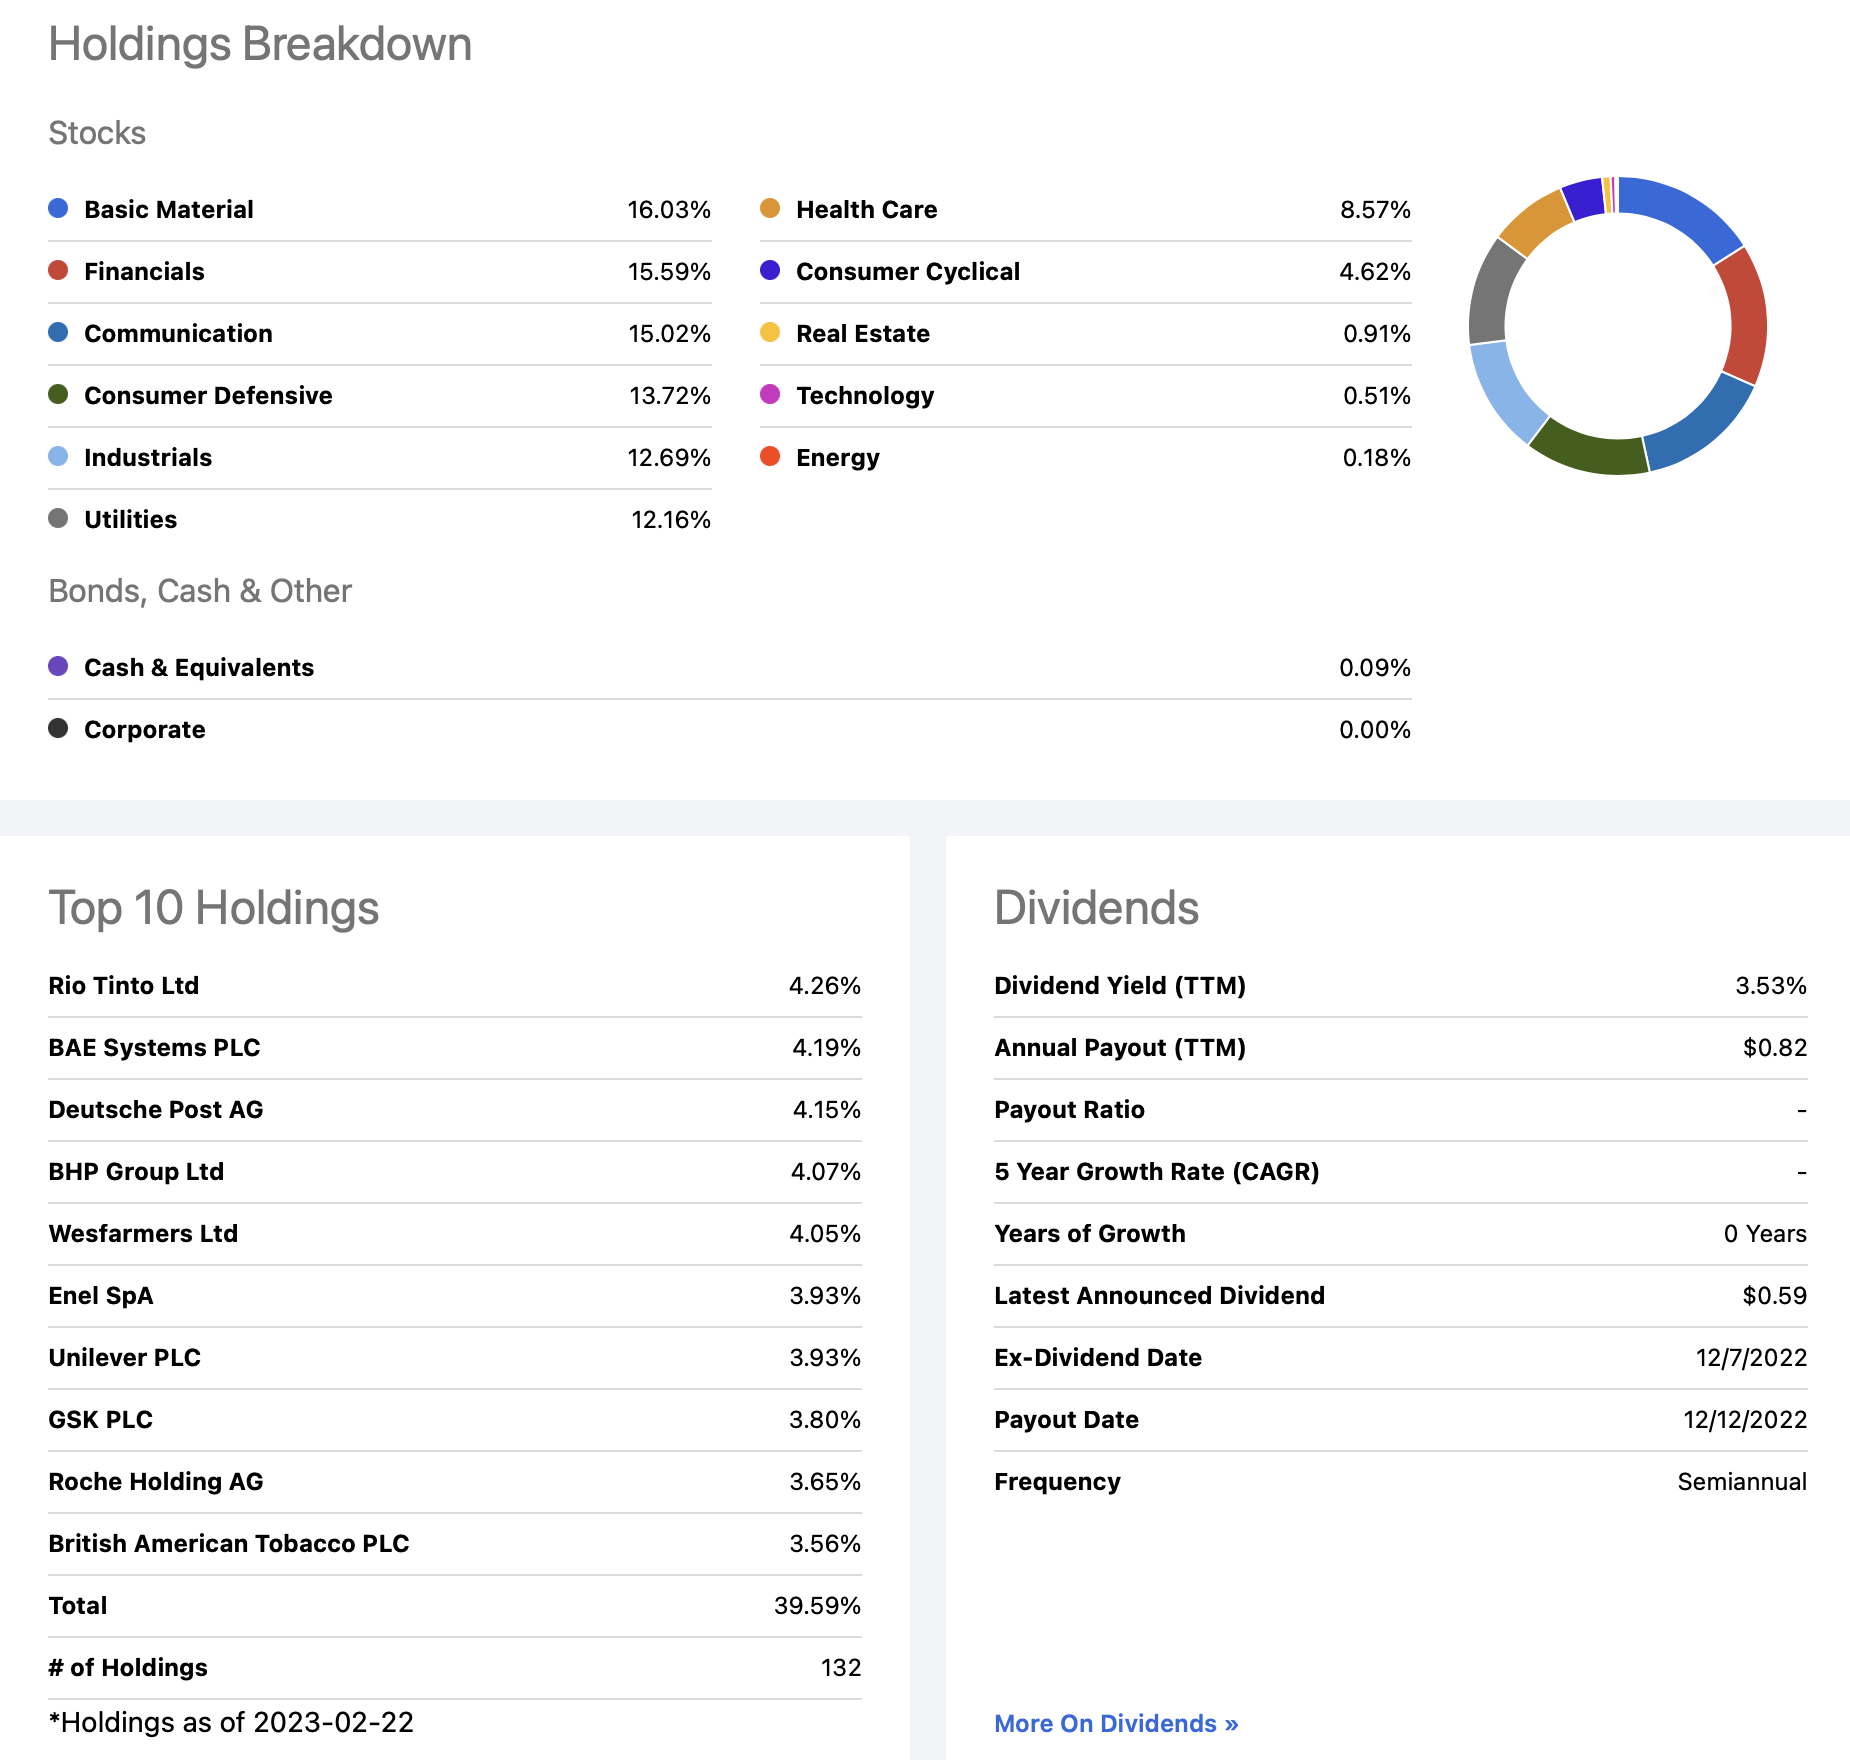
Next, VYMI:
VYMI: Portfolio Characteristics (Seeking Alpha)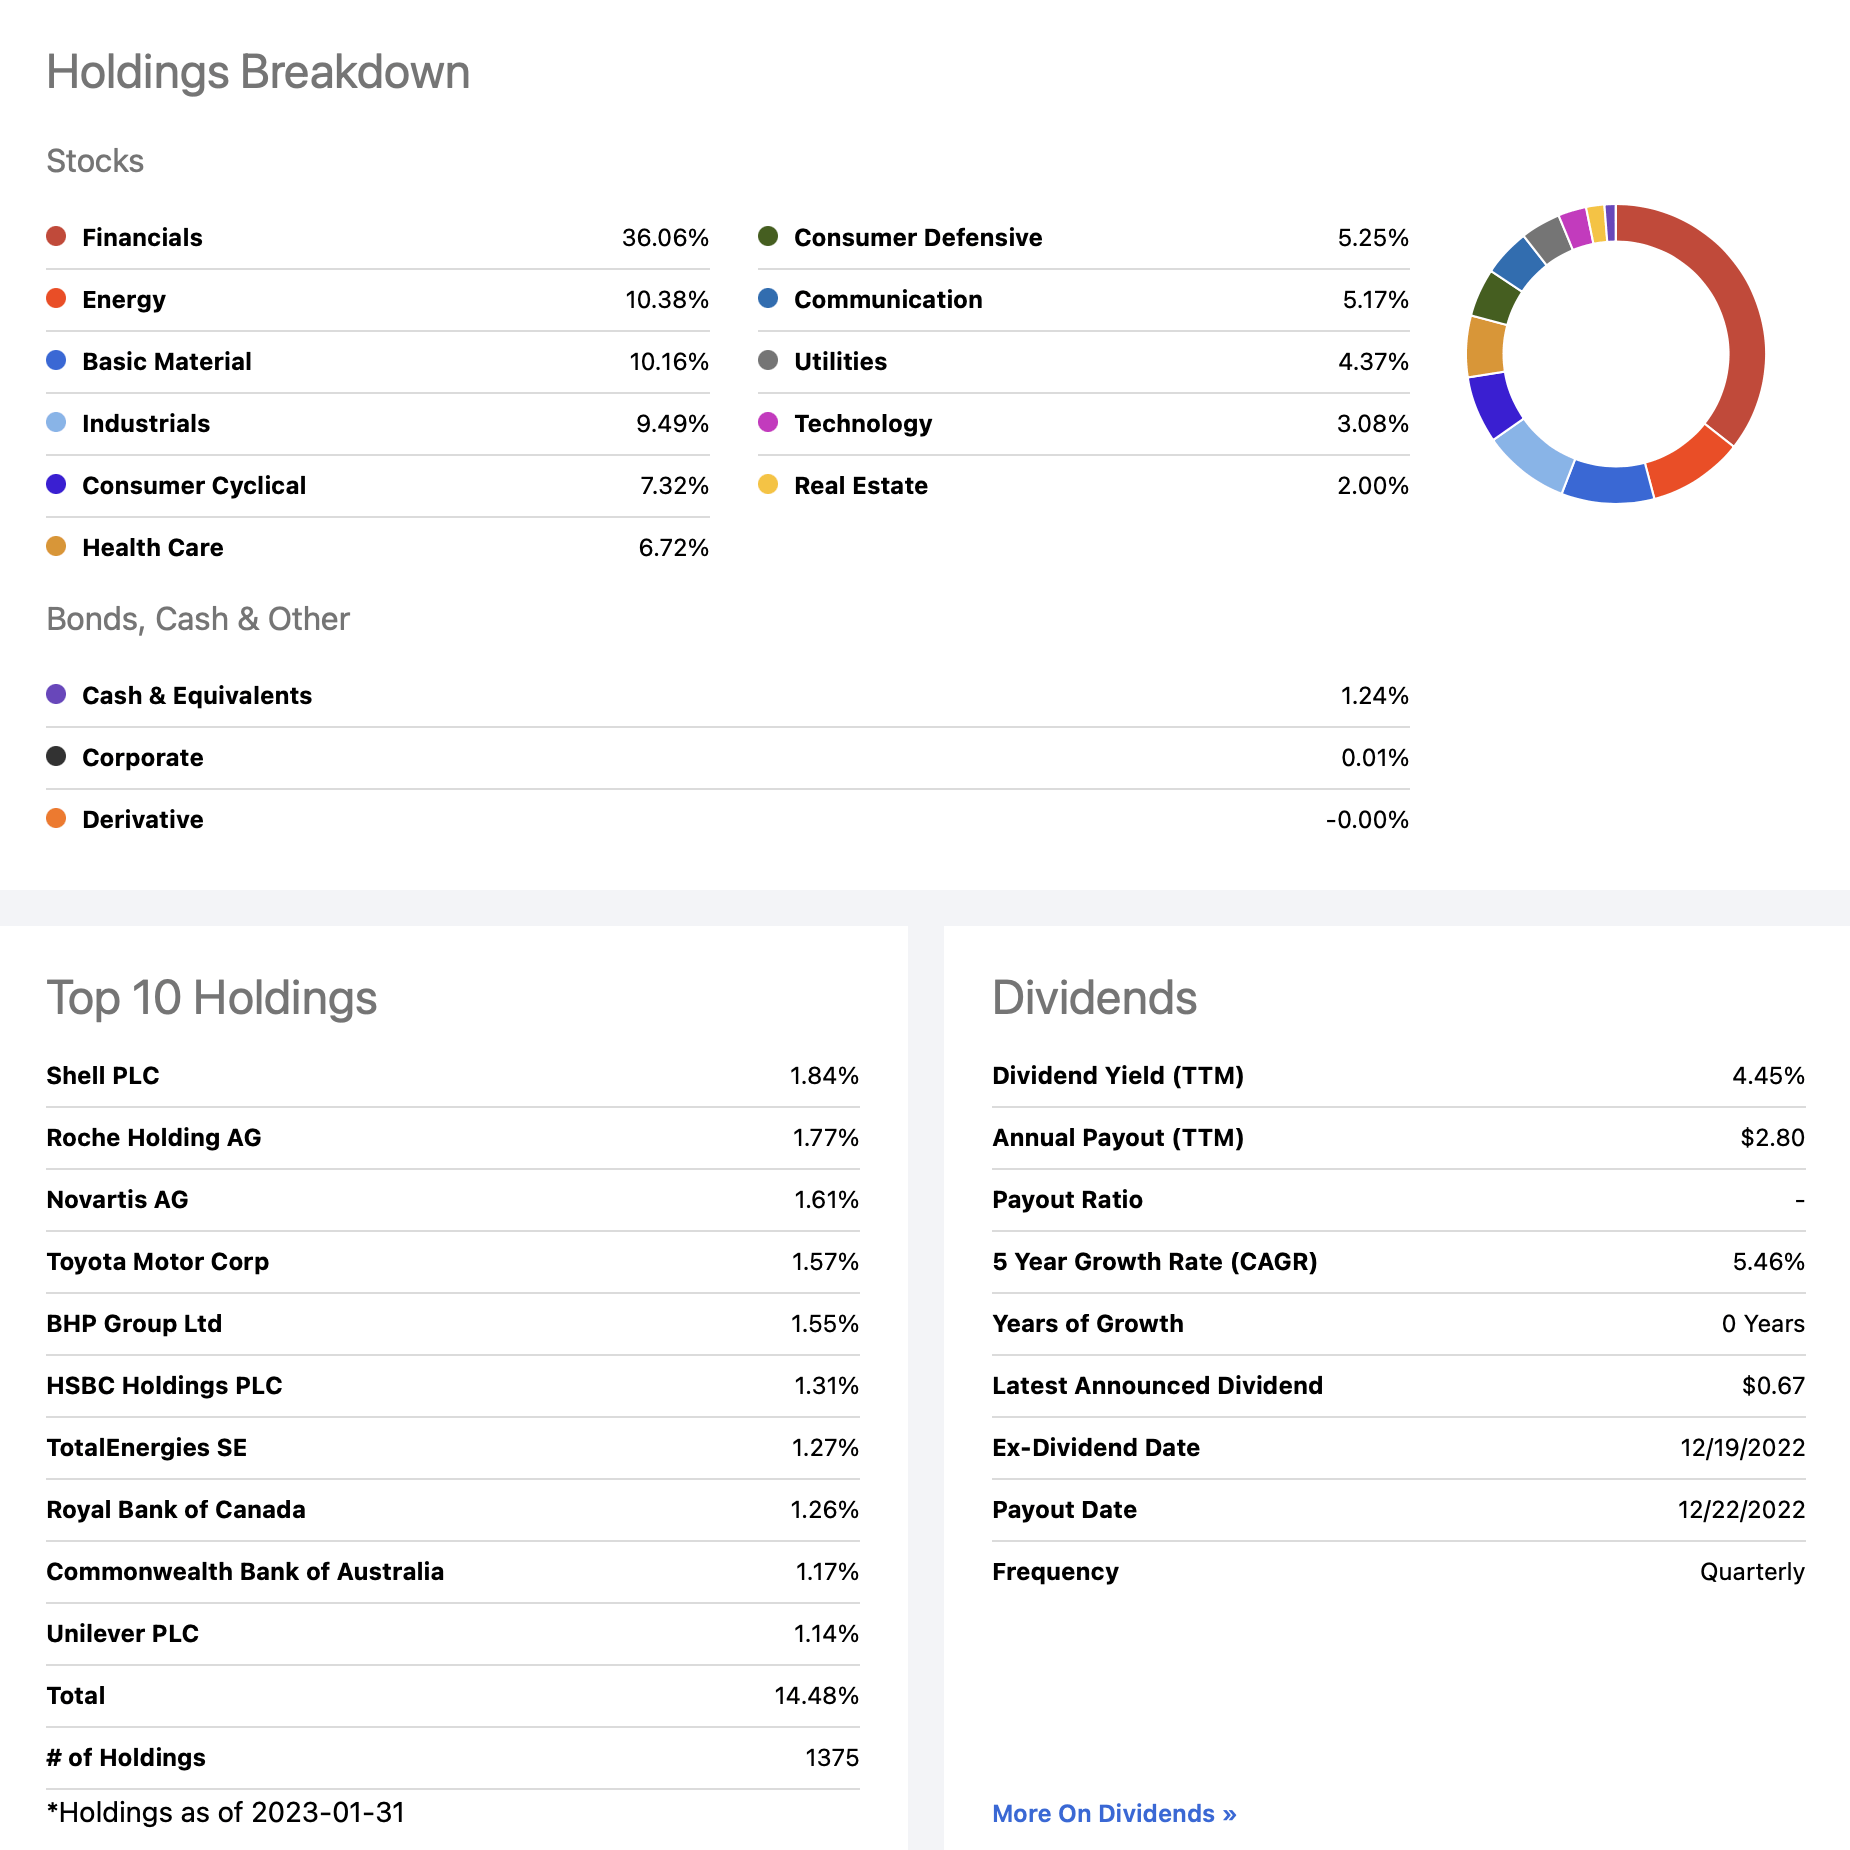
Let’s talk about some of the differences.
On one hand, please note that SCHY is far more concentrated. It’s strict selection criteria results in a fund with only 132 holdings, as compared to some 1,375 in VYMI. As a result, SCHY’s Top 10 holdings comprise almost 40% of the fund whereas the Top 10 comprise a little under 15% of VYMI.
On the other hand, you may have also noticed that SCHY is better balanced across multiple sectors. In the case of VYMI, a full 36.06% of its holdings are concentrated in the Financials sector, with the second-heaviest-weighted sector coming in at 10.38%. In contrast, SCHY’s six heaviest-weighted sectors all fall in a fairly tight range between roughly 16% and 12%.
All in all, to this point, SCHY’s particular selection criteria make it appear to be a stronger candidate. While it is more concentrated than VYMI, it might appear that its overall portfolio may consist of higher-quality companies. This particular formula has proven extremely successful in the case of SCHD, the U.S. counterpart of SCHY.
What, though, do we see when we examine performance? As alluded to in the introduction of this article, we now have an additional year in terms of track record for SCHY that we can review.
Examining SCHY’s Performance – Where The Rubber Meets The Road
In terms of analyzing how well SCHY has fared, I took advantage of a helpful comparison tool available here on Seeking Alpha. Here are the comparative results for SCHY, VYMI, and VEU over the past year.
SCHY/VYMI/VEU: Performance Comparison (Seeking Alpha)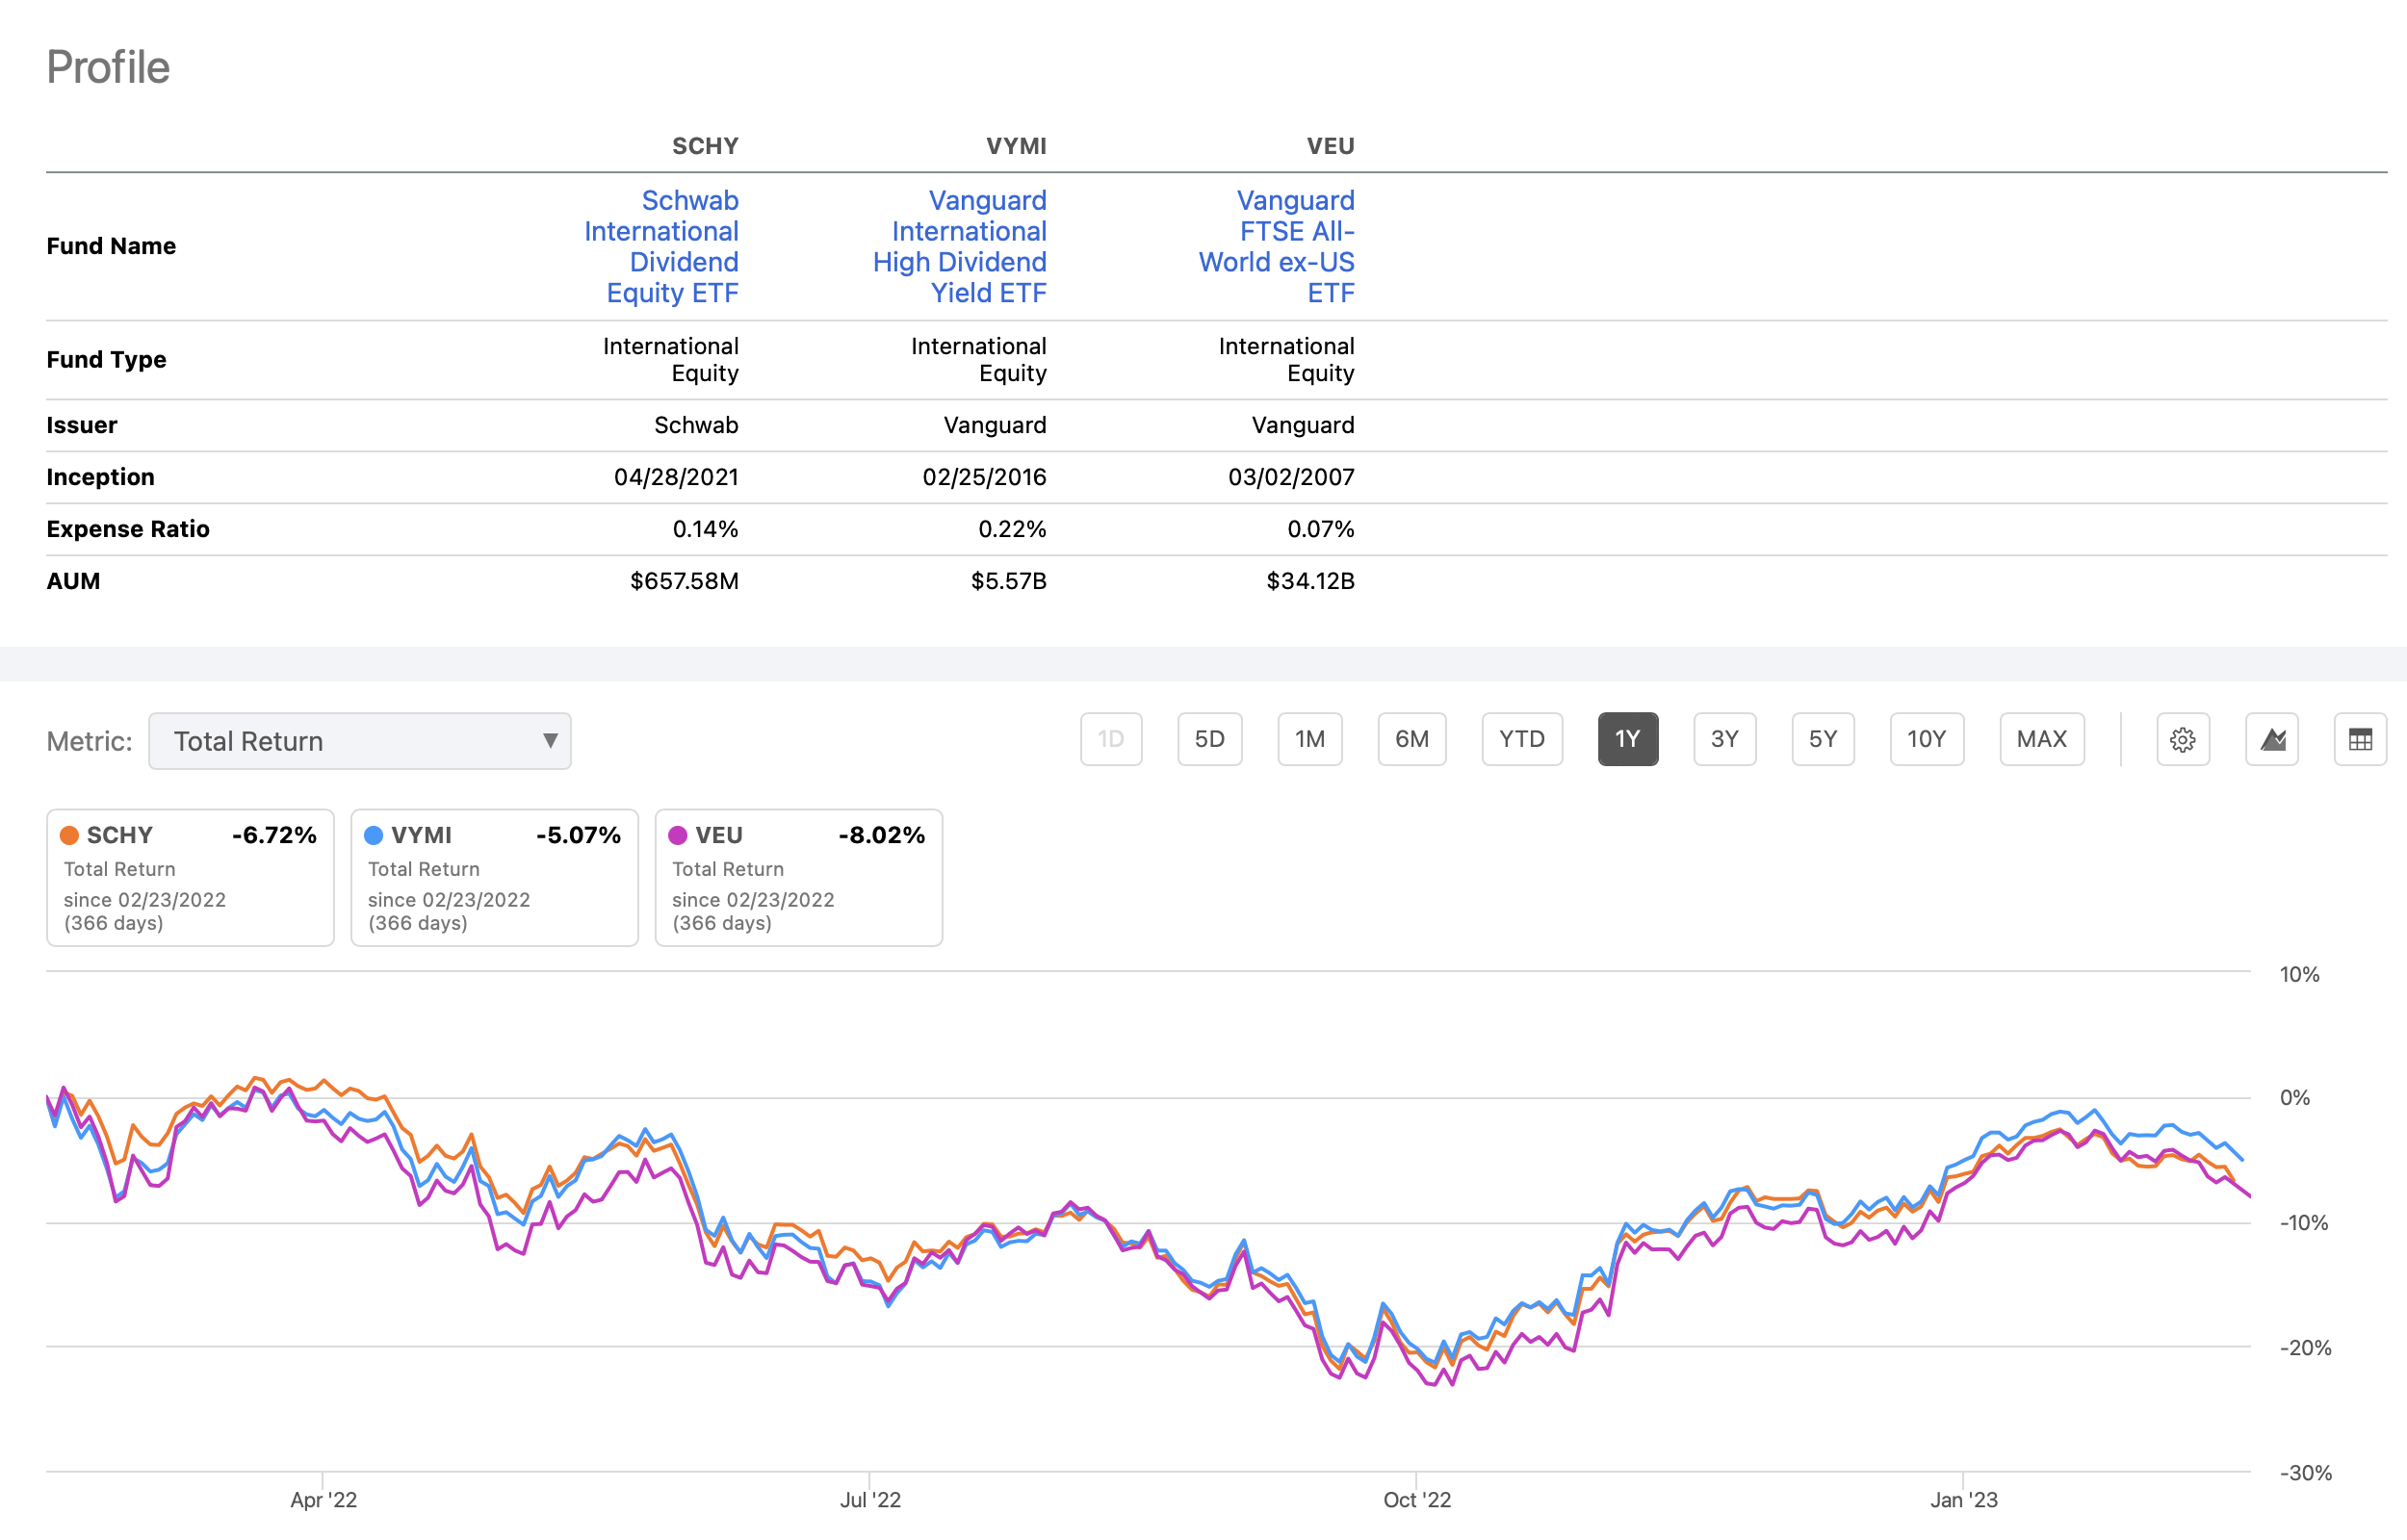
Interestingly, SCHY appears to have held up fairly well during this very difficult time period. While it slightly trails VYMI in terms of overall return, it came out ahead of VEU, a quality total-foreign market ETF.
For a second check, and over a slightly longer timeframe, I was able to turn to a backtest on Portfolio Visualizer.
This backtest covers the period May, 2021 to the present, limited by SCHY’s inception date. All dividends were accounted for and reinvested.
Here are the results.
SCHY/VYMI/VEU: Two-Year Backtest (PortfolioVisualizer.com)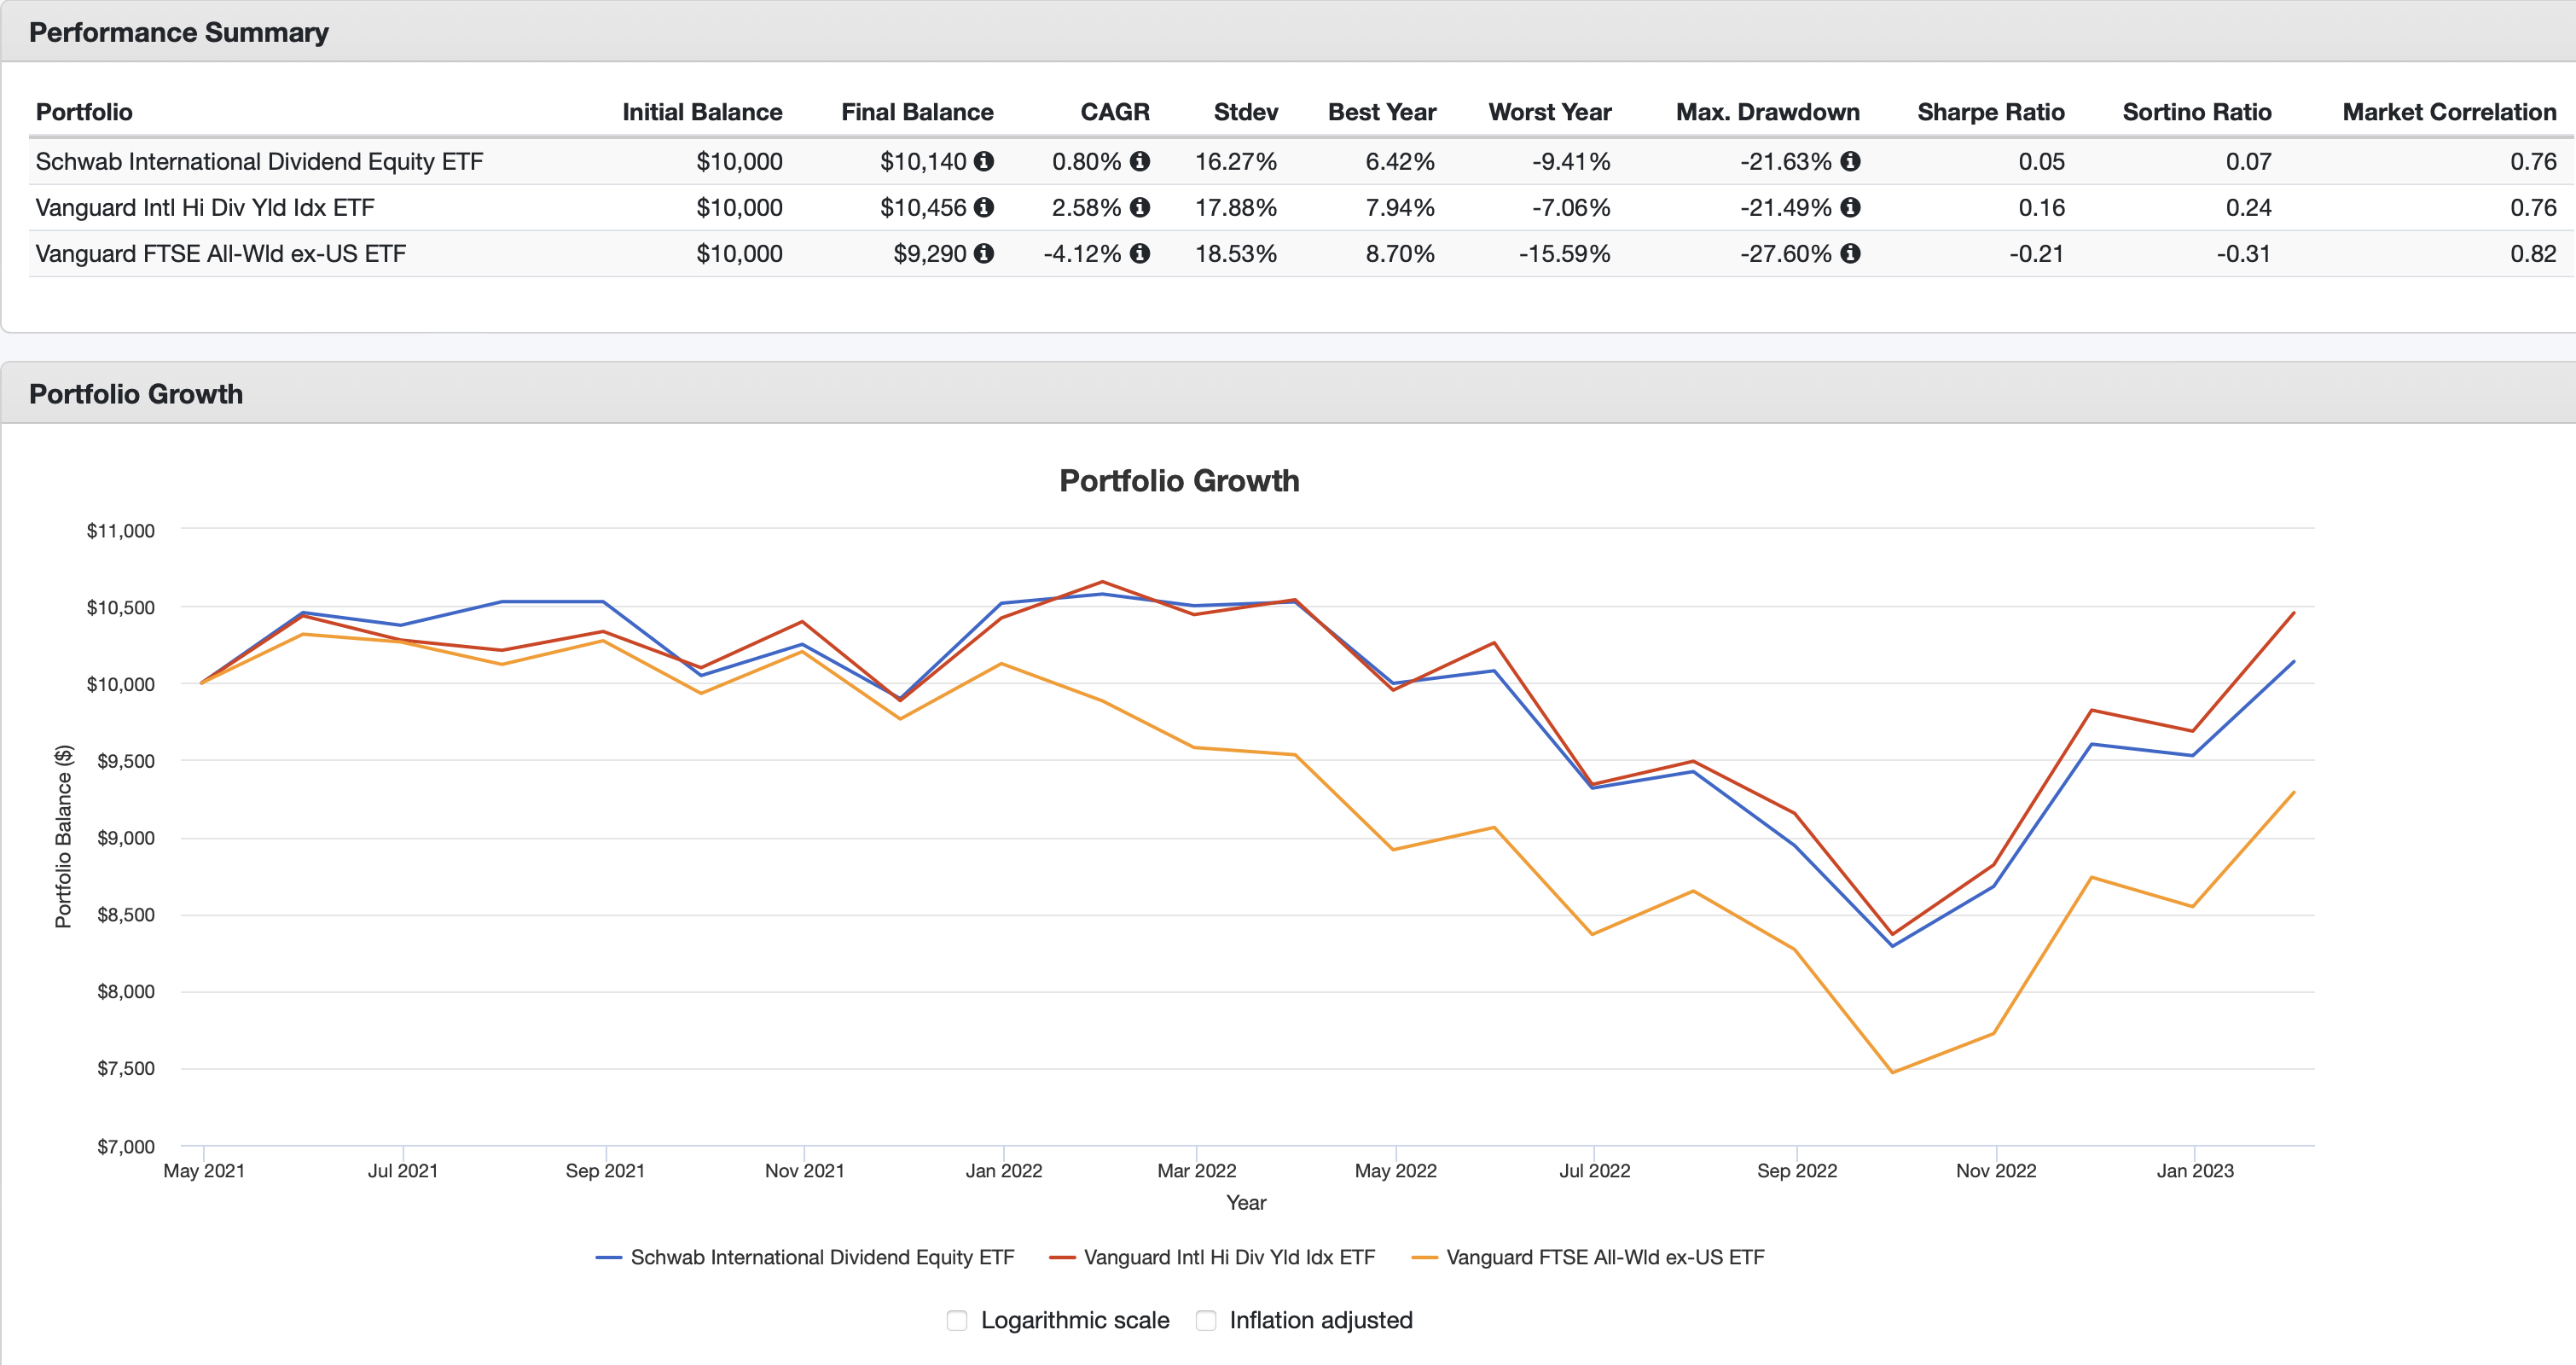
Interestingly, over this slightly longer timeframe, the end results are about the same. In both cases, VYMI came out the overall winner. On top of that, as can be seen from the respective Portfolio Characteristics graphics featured earlier in the article, VYMI has the edge in current income, with a dividend yield of 4.45% as opposed to 3.53% for SCHY. My backtest confirmed that this has also been the case over the past two years.
Summary And Conclusion
So where does all of this leave us?
Here’s my conclusion. Whereas SCHD has established an envious record of superior risk/reward performance over the past few years, it appears to remain in doubt as to whether the same selection criteria and filters is working as well internationally.
Going a little further, here is one thing that concerns me. From Charles Schwab’s web page for SCHY, take a look at the geographic breakdown of the fund.
Geographic Breakdown: SCHY (Charles Schwab)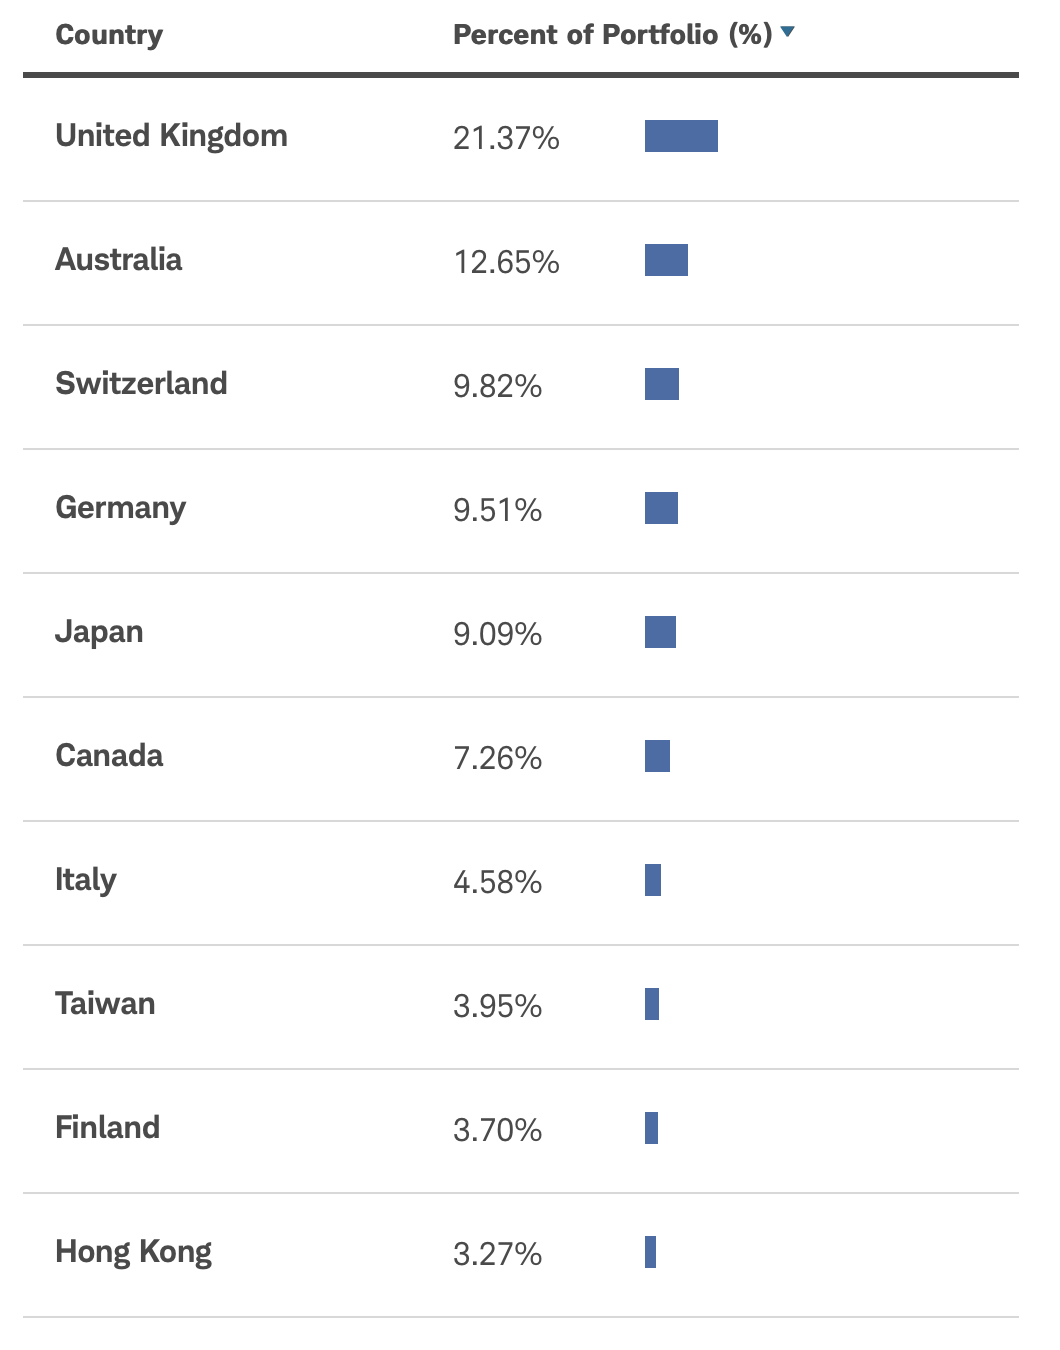
I’ll just say that this is at quite a variance from the geographic breakdown of either VYMI or VEU. United Kingdom is significantly overweighted in SCHY, and other countries such as Japan are significantly underweighted.
Perhaps I will be proven wrong but, for now, if forced to make a choice, I would go with VYMI and its greater diversification, both in terms of its overall number of holdings and its more balanced geographic profile.
That’s my conclusion. I’d love to hear yours, based on everything I have presented. Please, drop a note in the comments below and let me know what you think.