Sandstorm Sand: Expanding Too Rapidly, Perhaps (NYSE:SAND)
Dcelotti
Introduction
Vancouver-based Sandstorm Gold Ltd. (NYSE:SAND) released its third quarter 2022 results on November 8, 2022.
Note: This article updates my previous article on Sandstorm Gold, published on October 8, 2022. I have been following SAND quarterly results since 2015.
As of September, Sandstorm’s portfolio totals 250 streams and royalties, of which 39 of the underlying assets are cash-flowing, with no asset contributing more than 15% to the Company’s consensus net asset value.
1 – 3Q22 Production and Revenues Snapshot
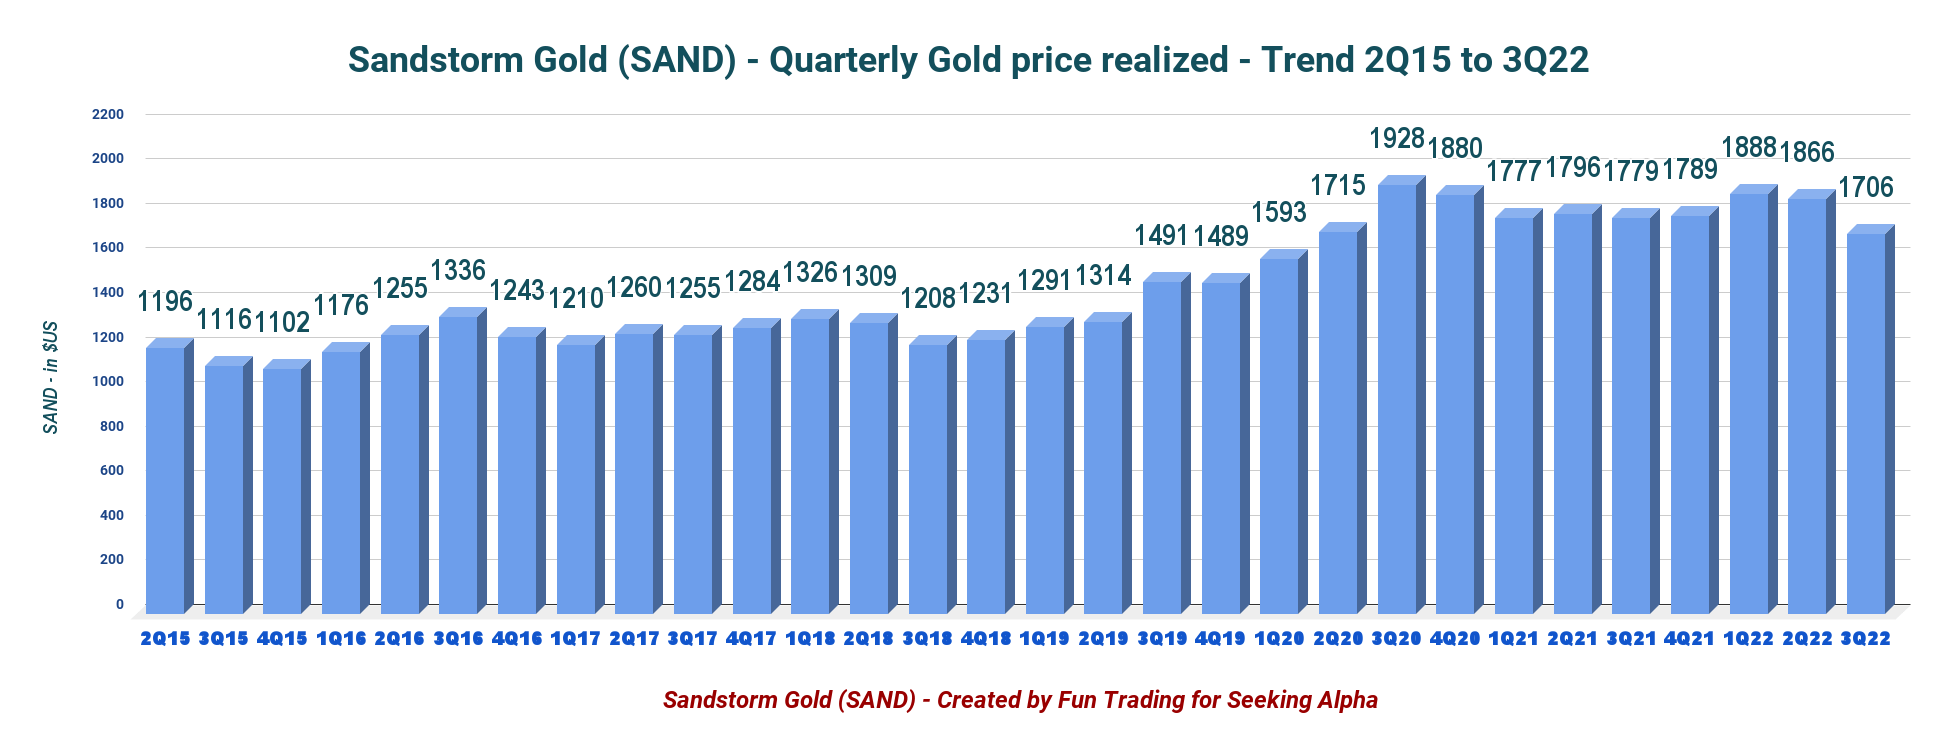
It was another solid quarter, with a record gold equivalent production of 22,606 Au Eq. Oz (15,514 Au Eq. Oz last year) and record revenues of $38.95 million, with an average price per GEO down significantly from $1,866 per ounce in 2Q22 to $1,706 per ounce.
The average cash costs for the three months ended September 30, 2022, were $323 per Attributable Gold Equivalent ounce.
Net income was $31.68 million in 3Q22 compared to $6.62 million in the comparable quarter a year ago.
The company added four new mines this quarter, as shown below:
SAND Production comparison per mine 2Q22 versus 3Q22 (Fun Trading)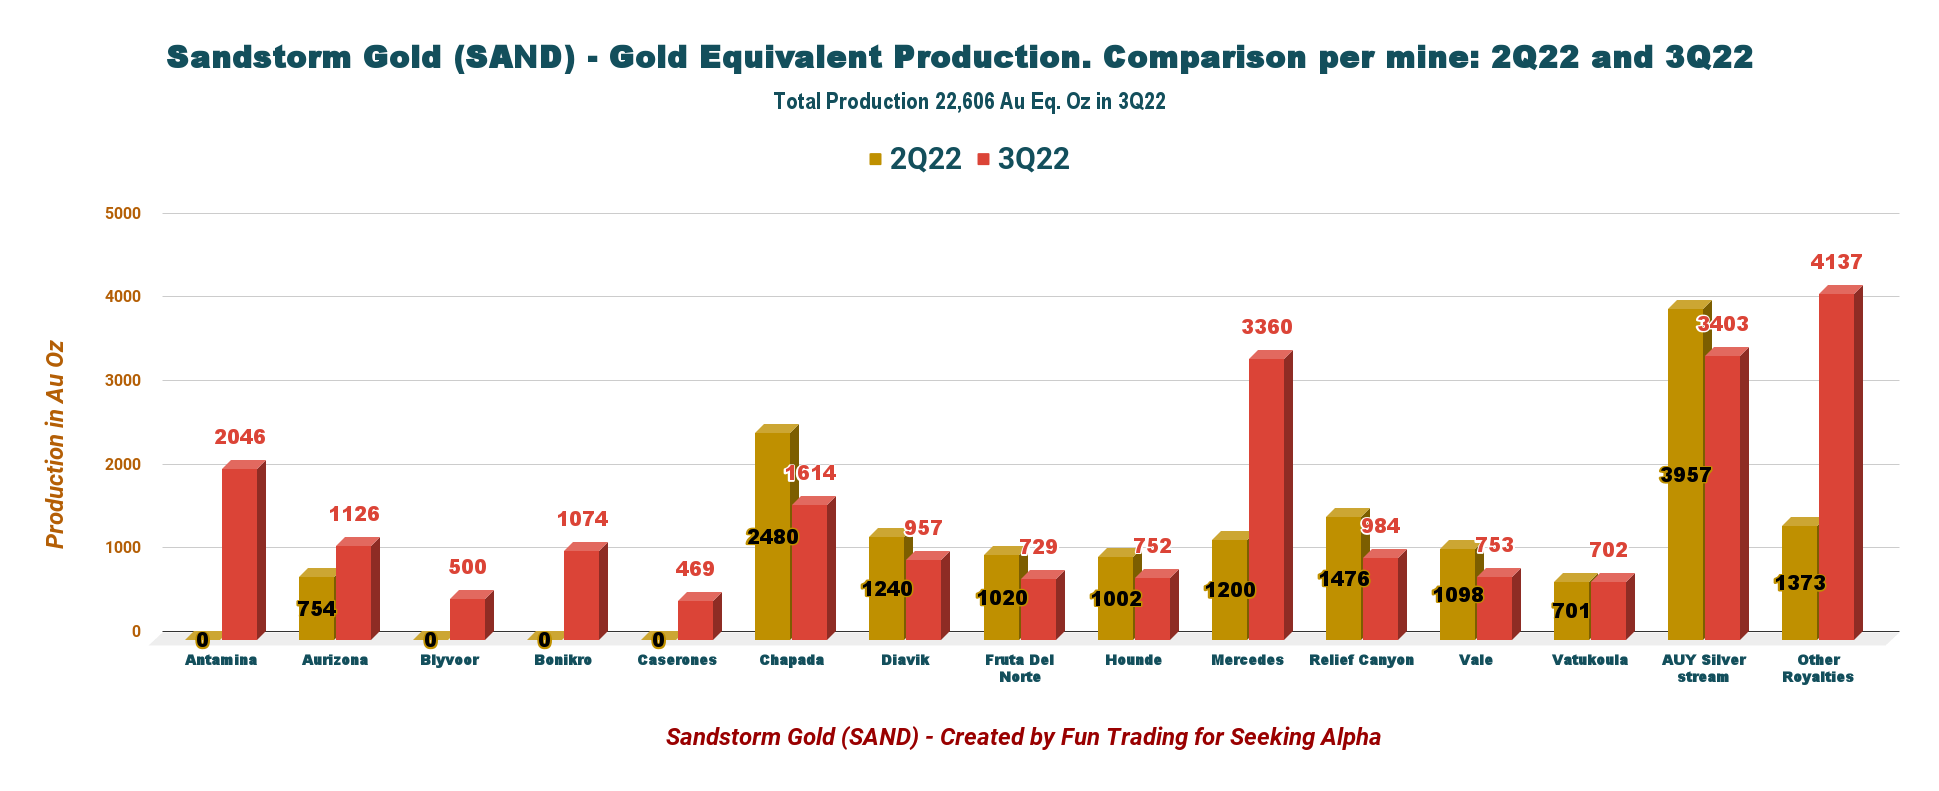
Sandstorm Gold has begun a fundamental business transformation this quarter with the acquisitions of Nomad Royalty in August and nine royalties from BaseCore Metals LP in July.
SAND Acquisitions $1.1 billion (SAND Presentation)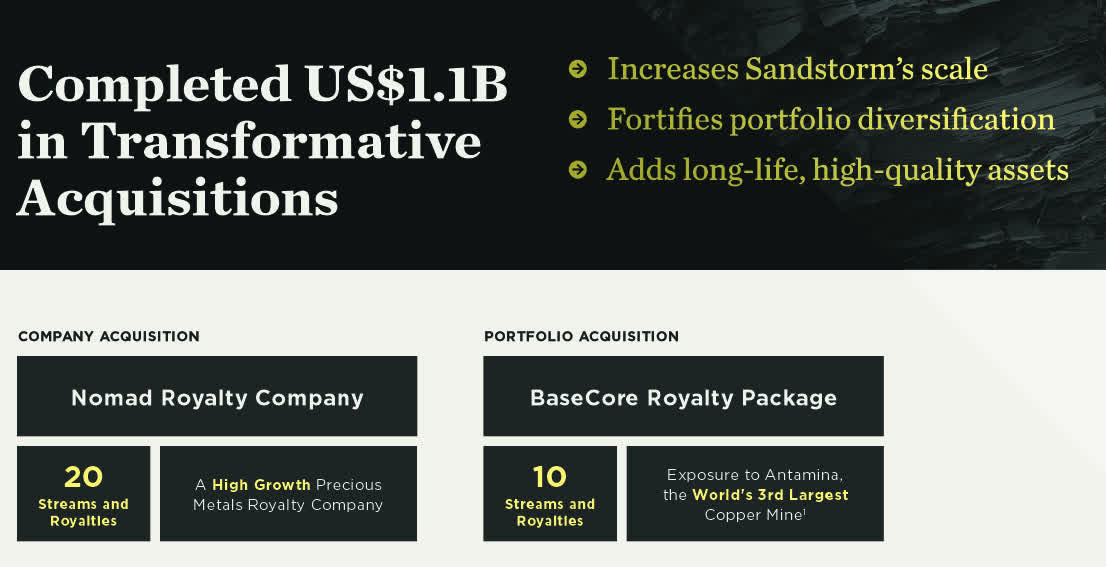
This transformational process has significantly changed the company’s fundamental landscape. Many shareholders are not impressed with such a rapid expansion, and I must admit I am one of them.
For those who need more information about these critical acquisitions, I recommend reading my preceding article (link above), in which I gave more details.
However, on the plus side, these acquisitions are expected to increase gold equivalent production significantly by 2026, as shown in the chart below:
SAND Production outlook 2026 (SAND Presentation)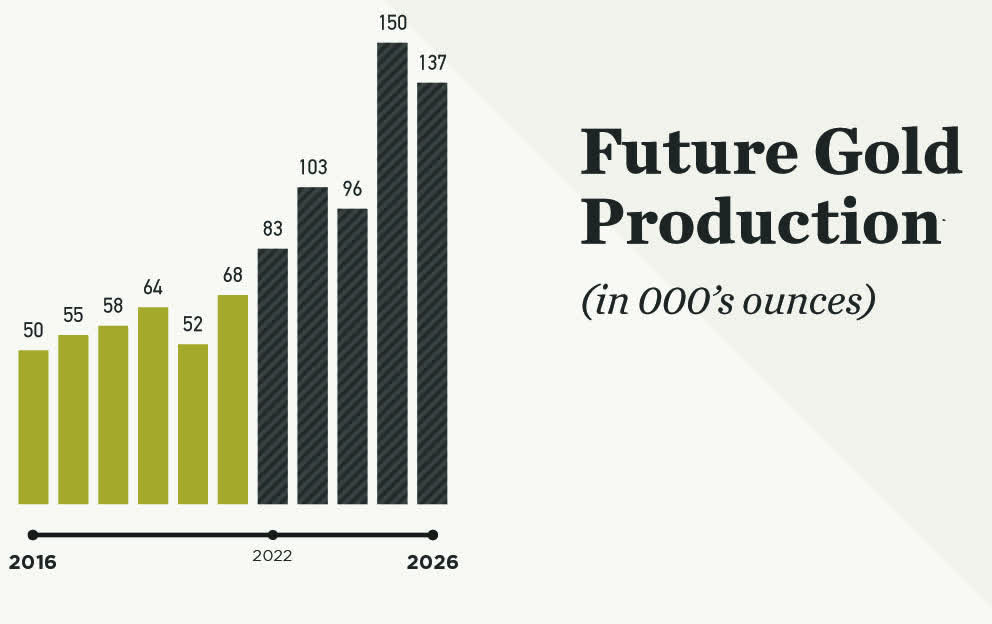
Sandstorm expects its production to grow more than 85% between 2022 and 2025. The transactions add several development-stage assets contributing to this growth, including Greenstone and Platreef.
Sandstorm plans on selling a portion of the Antamina NPI to Horizon and retaining a silver stream, adding diversification and size to Horizon’s growing copper portfolio while increasing Sandstorm’s precious metal exposure.
2 – Investment Thesis
As I said in my preceding article, these new transactions and the merger with Nomad have created a significant financial event for Sandstorm Gold and its shareholders. We begin to see how deeply transformational they have affected the company’s fundamentals.
However, It is still premature to give a valid opinion about the potential expansion and its long-lasting effects on SAND shareholders. It is essential to distinguish what the company aims to achieve by expanding and if it is in the shareholders’ interest.
As I said, bigger is not necessarily better, and the market reaction was quite hostile when the deals were announced. Unfortunately, this transformation has coincided with the continued weakness of the gold price due to the FED’s action on interest rates. It was not helpful and reduced the dramatic positive effect on production and revenues.
Thus, I believe SAND continues to be an excellent trading tool, but I am not confident enough to invest a significant stake long-term in the company. This unenthusiastic expansion initiated by SAND’s management is quite unsettling and has been caustic for the stock.
It is noticeable in the most recent presentation, where management alludes to “catching up to the majors” on page 9 of the presentation.
Thus, I recommend starting a medium long-term position while trading a large part of your position. However, I believe we can safely invest in SAND below $5.
My two favorites in this segment are Franco-Nevada (FNV) and Wheaton Precious Metals (WPM).
One excellent strategy that I often recommend in this sector in my marketplace, “The Gold and Oil Corner,” is trading a minimum of 60% LIFO of your whole SAND position, which allows you to keep a core long-term for a much higher stock price.
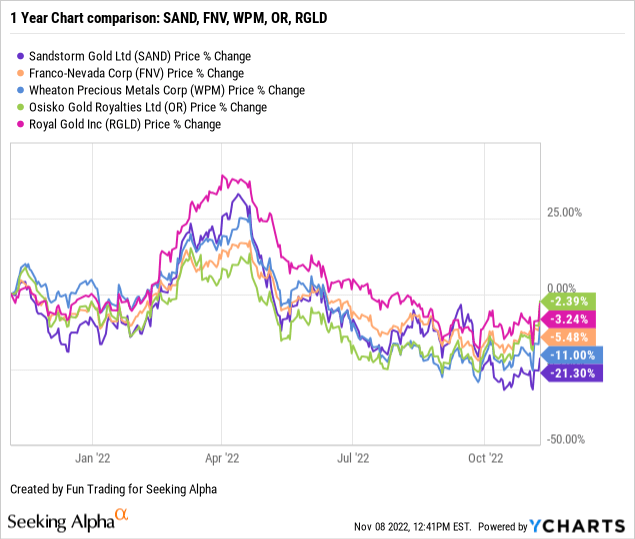
3 – Stock Performance
Sandstorm Gold is lagging behind its peers and is down 21% on a one-year basis.
Sandstorm Gold – Financial Results Snapshot 3Q22 – The Raw Numbers
| Sandstorm Gold | 3Q21 | 4Q21 | 1Q22 | 2Q22 | 3Q22 |
| Revenues in $million | 27.60 | 29.82 | 35.37 | 35.97 | 38.95 |
| Net Income to shareholders in $million | 6.62 | 7.40 | 9.14 | 39.70 | 31.68 |
| EBITDA in $ million | 20.17 | 20.67 | 25.72 | 56.19 | 53.02 |
| EPS Diluted | 0.03 | 0.04 | 0.05 | 0.20 | 0.13 |
| Cash From Operating Activities in $ million | 17.91 | 19.51 | 22.36 | 33.20 | 25.09 |
| CAPEX in $million | 8.96 | 22.69 | 3.11 | 40.02 | 489.01 |
| FCF in $million | 8.95 | -3.19 | 19.25 | -6.82 | -463.92 |
| Total cash in $ million (incl. short-term note) | 37.65 | 21.17 | 31.61 | 23.83 | 12.56 |
| Total Debt in $ million | 0.0 | 0.0 | 0.0 | 0.0 | 524.0 |
| Shares outstanding diluted in millions | 198.31 | 194.96 | 194.84 | 195.40 | 244.75/298+* |
| Dividend per share in $ | 0 | 0 | 0.015 | 0.015 | 0.015 |
| Production | 3Q21 | 4Q21 | 1Q22 | 2Q22 | 3Q22 |
| In K Au Eq. | 15.5 | 16.6 | 18.7 | 19.3 | 22.61 |
| Gold price | 1,779 | 1,789 | 1,887 | 1,866 | 1,706 |
Source: Company report analysis by Fun Trading (data are available since 2015 only for subscribers)
* As of November 7, 2022, the Company had 298,179,761 common shares outstanding.
Part I – Balance Sheet Details
1 – Quarterly Revenues and Trends: Total revenues of $38.95 million in 3Q22
SAND Quarterly Revenues history (Fun Trading)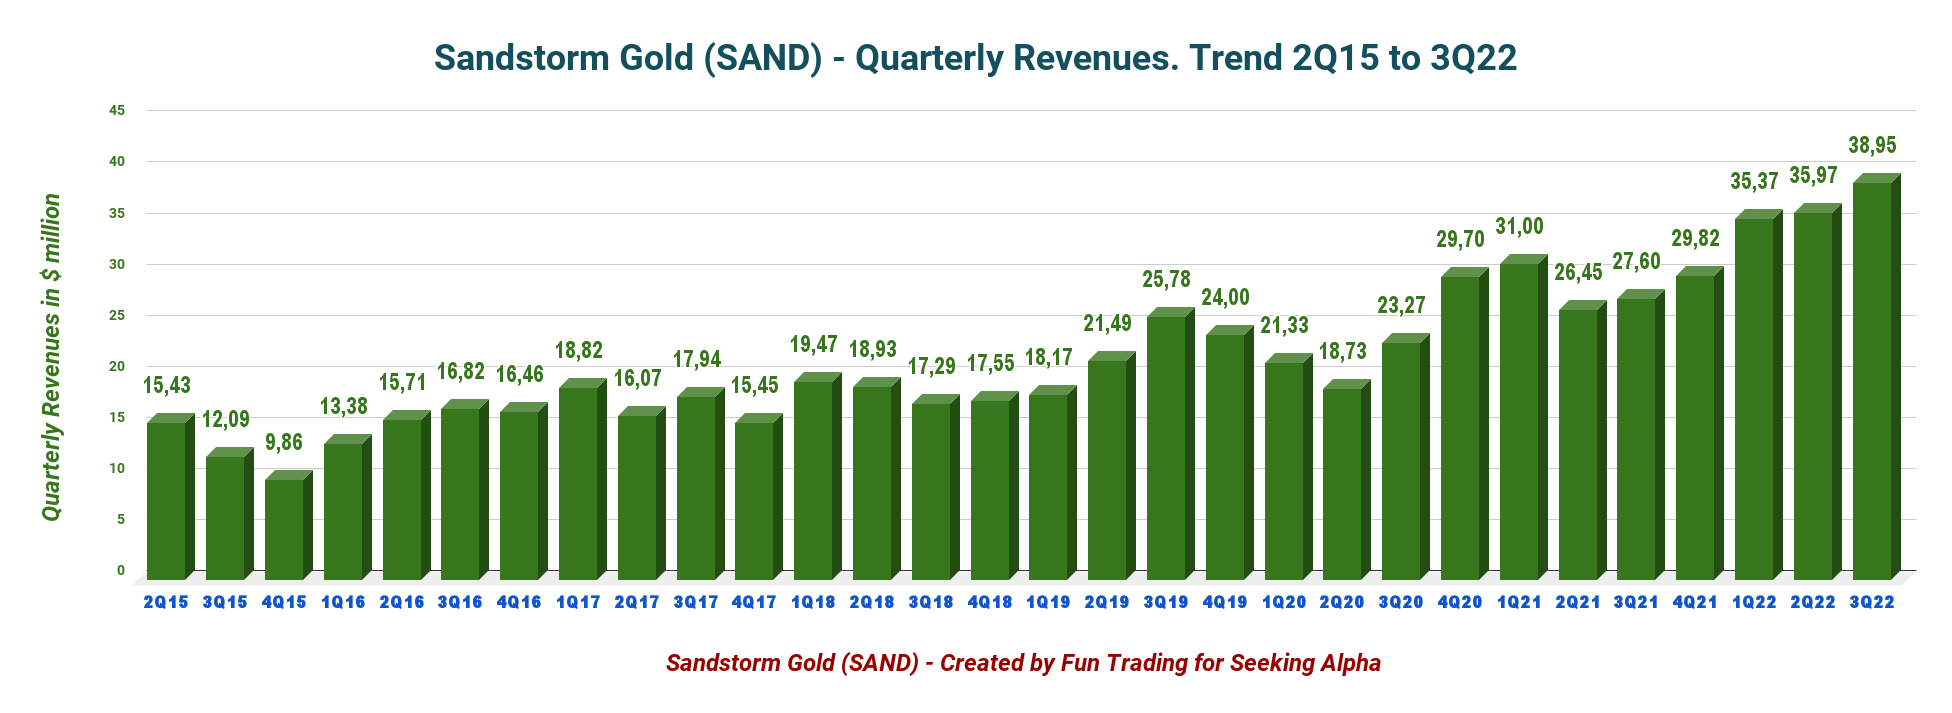
Sandstorm Gold posted record revenues of $38.95 million for the three months ended September 30, 2022, compared with $26.45 million for the comparable period in 2021.
The net income was $31.68 million in 3Q22, or $0.13 per diluted share, compared to $6.62 million or $0.03 per diluted share in the same quarter a year ago.
The cash costs per ounce are up to $323 per ounce, resulting in cash operating margins of $1,383 per ounce for the third quarter. It was down from $1,593 per ounce the preceding quarter.
SAND Quarterly Cash costs history (Fun Trading)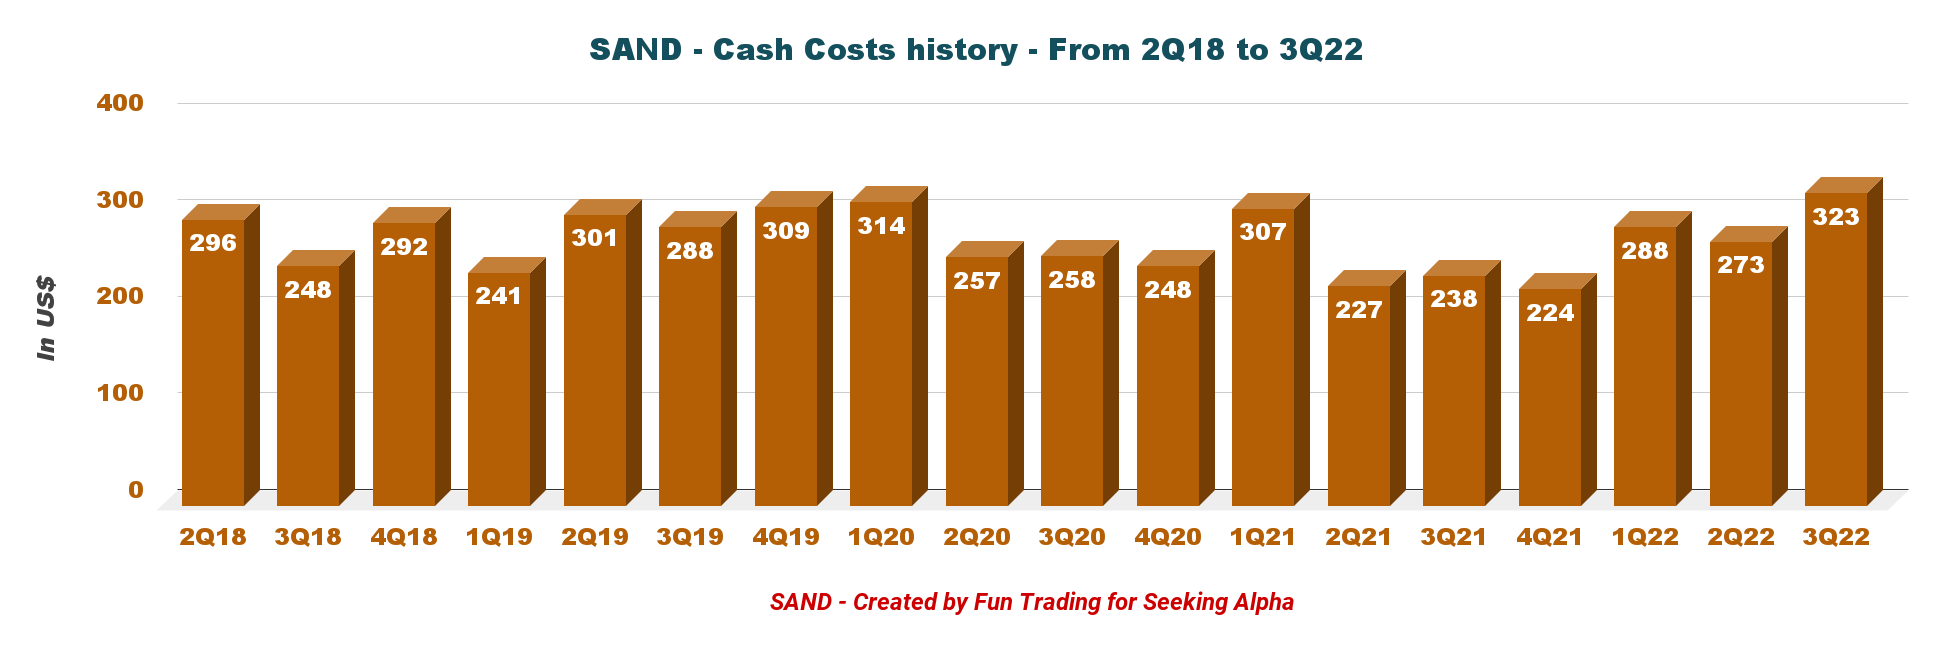
2 – Free Cash Flow was a Loss Estimated at a Loss of $ 6.82 Million in 2Q22
SAND Quarterly Free cash flow history (Fun Trading)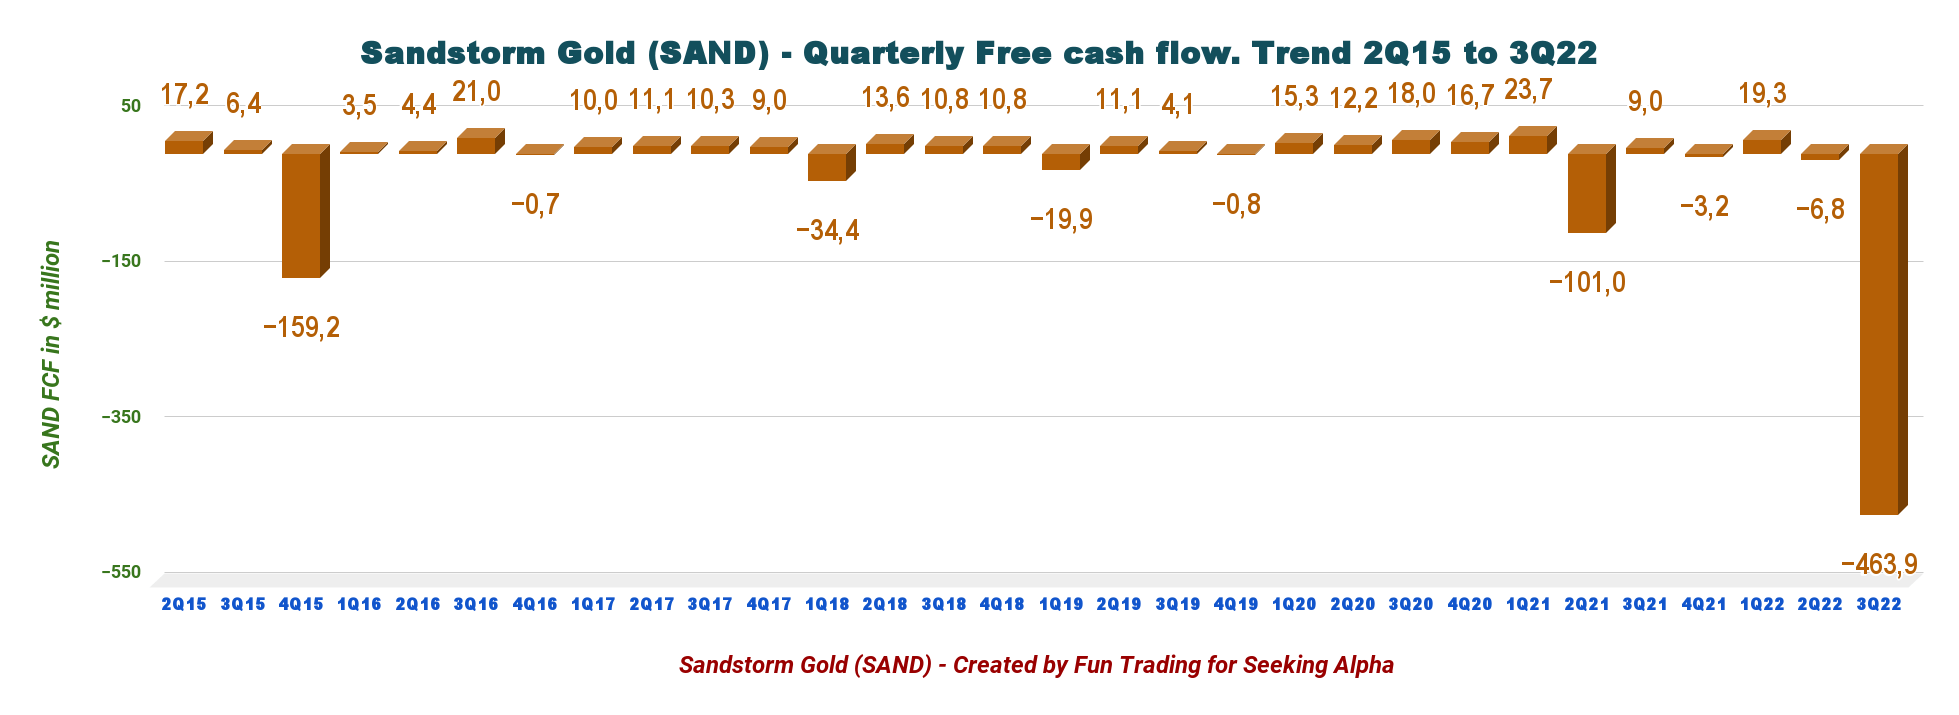
Note: Generic free cash flow is cash from operating activities minus CapEx.
The free cash flow was a loss estimated at $463.92 million in the third quarter of 2022, and the trailing 12-month free cash flow was a loss of $454.68 million.
The significant loss in free cash flow is due to acquisitions that I discussed earlier.
The quarterly dividend is now $0.015 per share, or a dividend yield of 1.1%
3 – Total shares outstanding diluted are increasing again.
This topic is essential for Sandstorm Gold because of the number of previous warrants and options the company has used to expand its assets base. Also, during the past year, SAND bought back over $21 million since 2018 at a great expense for what purpose? It seems to me there is a lack of long-term goals.
SAND Quarterly Share diluted outstanding history (Fun Trading)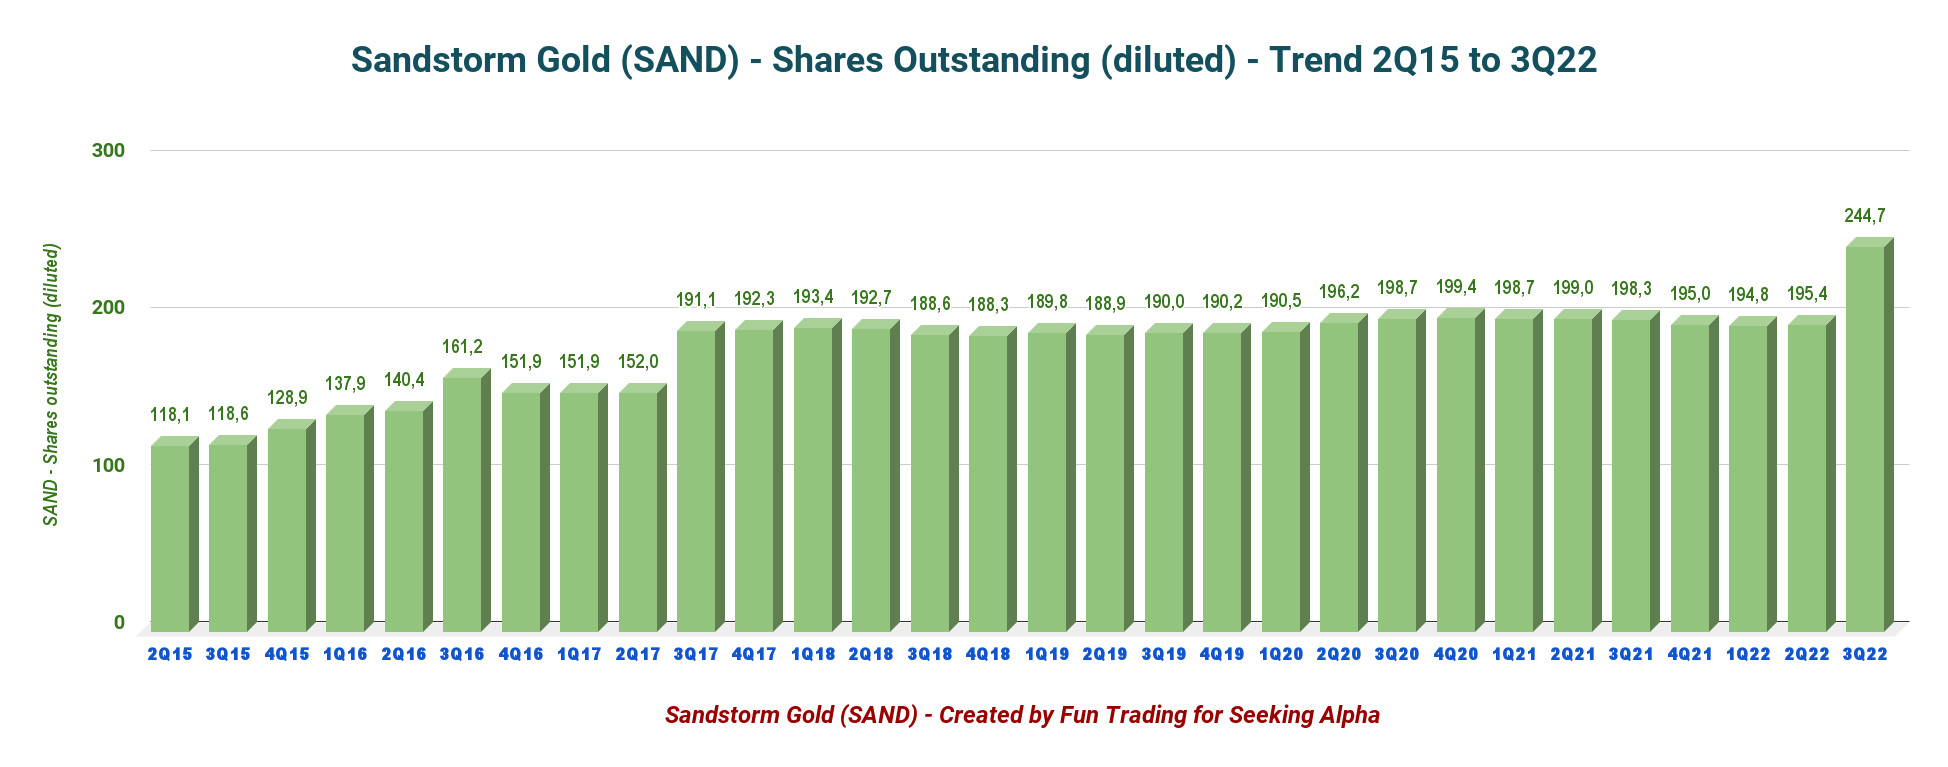
The total outstanding shares diluted is now 244.75 million at the end of 3Q22.
However, as I explained earlier, the transaction with Nomad and BaseCore increased the outstanding shares diluted significantly.
As of November 7, the company said:
As of November 7, 2022, the Company had 298,179,761 common shares outstanding
Significant events affecting shares outstanding:
The total shares added are 74.4 million (Nomad) and 13.5 million (BaseCore), or 87.9 million.
Pursuant to the terms of the Nomad Acquisition, Sandstorm issued 74.4 million common shares of the Company to former Nomad shareholders equal to an exchange ratio of 1.21 Sandstorm common shares for each Nomad common share held.
On July 11, 2022, the Company acquired nine royalties and one stream from BaseCore Metals LP (“BaseCore”) for $425 million in cash and approximately 13.5 million common shares of Sandstorm.
On October 4, 2022, the Company completed a public offering of 18,055,000 common shares for $5.10 per share for gross proceeds of $92.1 million.
4 – Cash position was $12.56 million with Debt of $524 million at the end of September 30, 2022.
SAND Quarterly Cash versus Debt history (Fun Trading)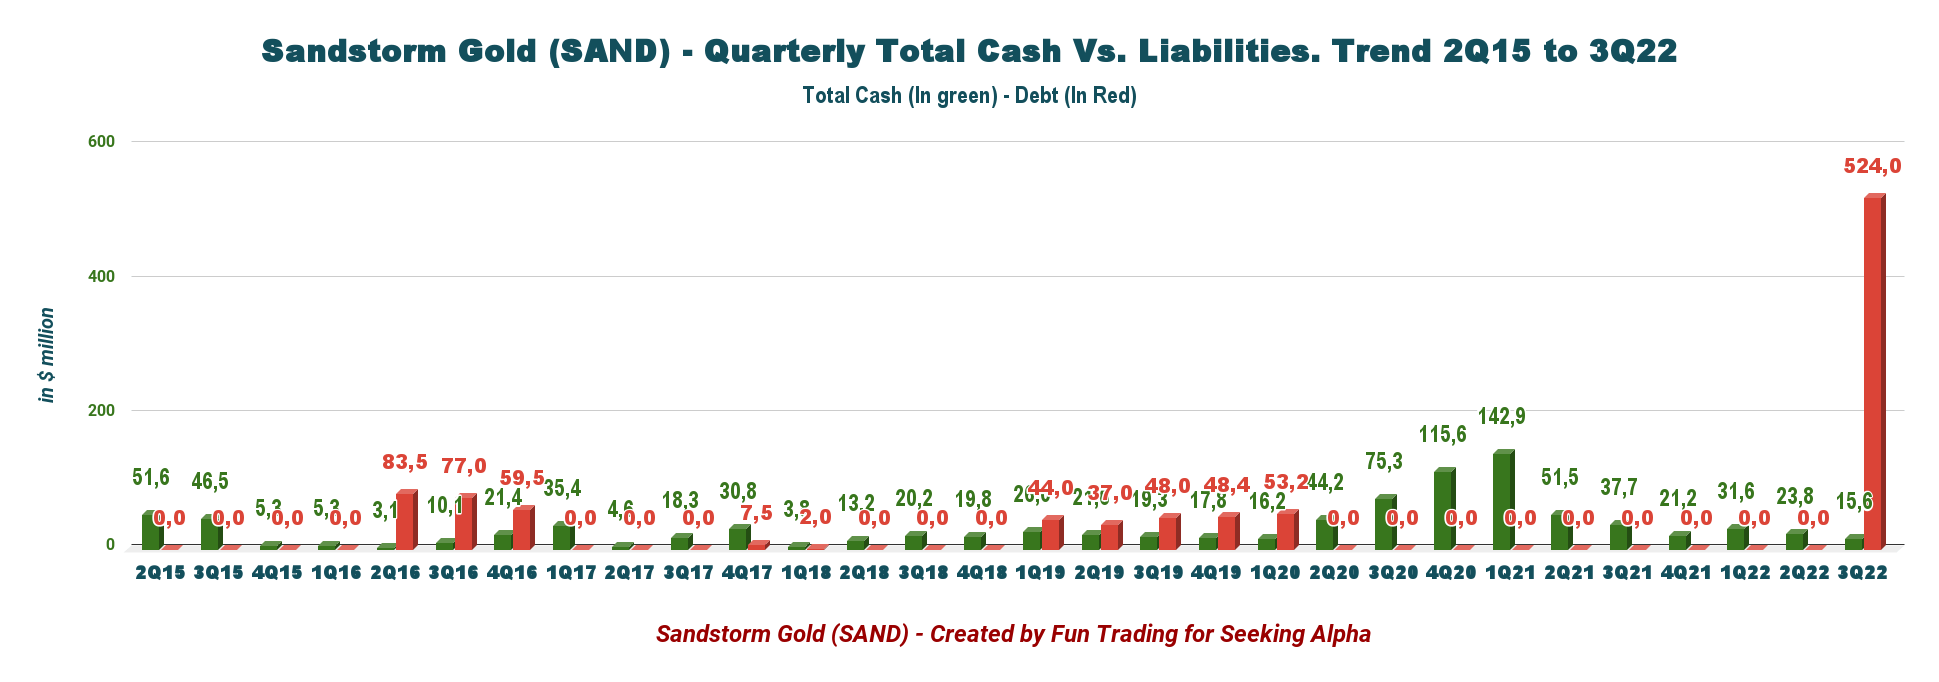
It is the segment that recent acquisitions have significantly modified.
The total cash includes the cash & cash equivalent and short-term investments of $12.56 million, while debt is now $524.0 million.
Note: As of the end of September, $505 million remains outstanding under the Company’s Revolving Facility.
Most recent financial activities:
In August 2022, Sandstorm amended its revolving credit agreement allowing the Company to borrow up to $625 million. The facility maintains its sustainability-linked performance targets.
In September 2022, the Company declared its fourth dividend of CAD0.02 per share, which was paid on October 28, 2022.
On October 4, 2022, the Company completed an equity financing for aggregate gross proceeds of $92.1 million. Upon closing of the funding, the majority of the net proceeds were used to reduce amounts drawn under the Company’s revolving credit facility.
Part 2 – Gold Production details
SAND Quarterly Gold Equivalent Production history (Fun Trading)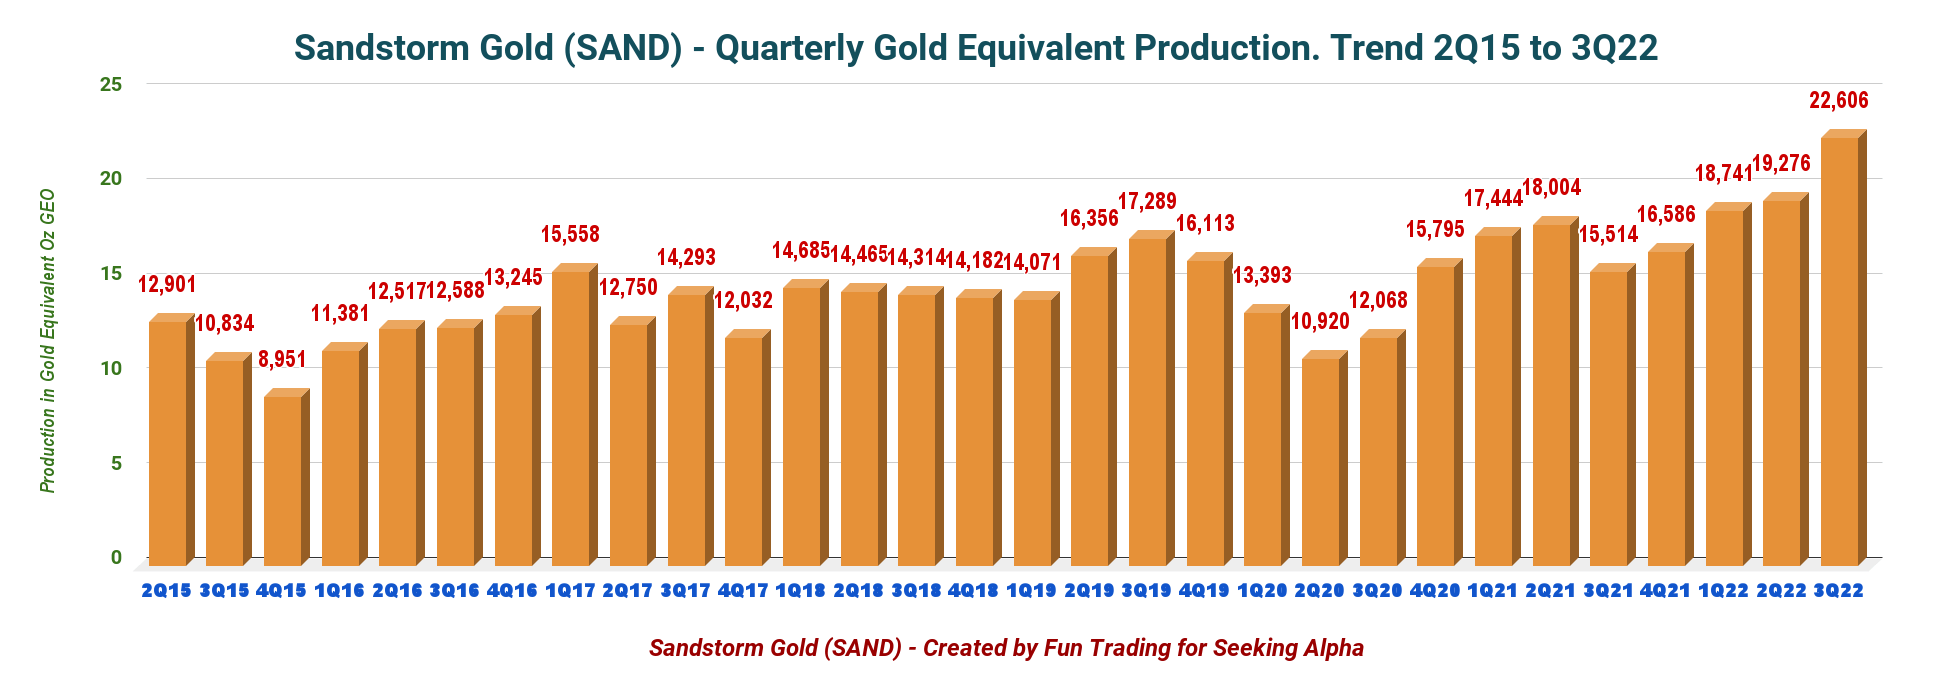
SAND Quarterly Production per mine in 3Q22 (Fun Trading) SAND Quarterly Gold price history (Fun Trading)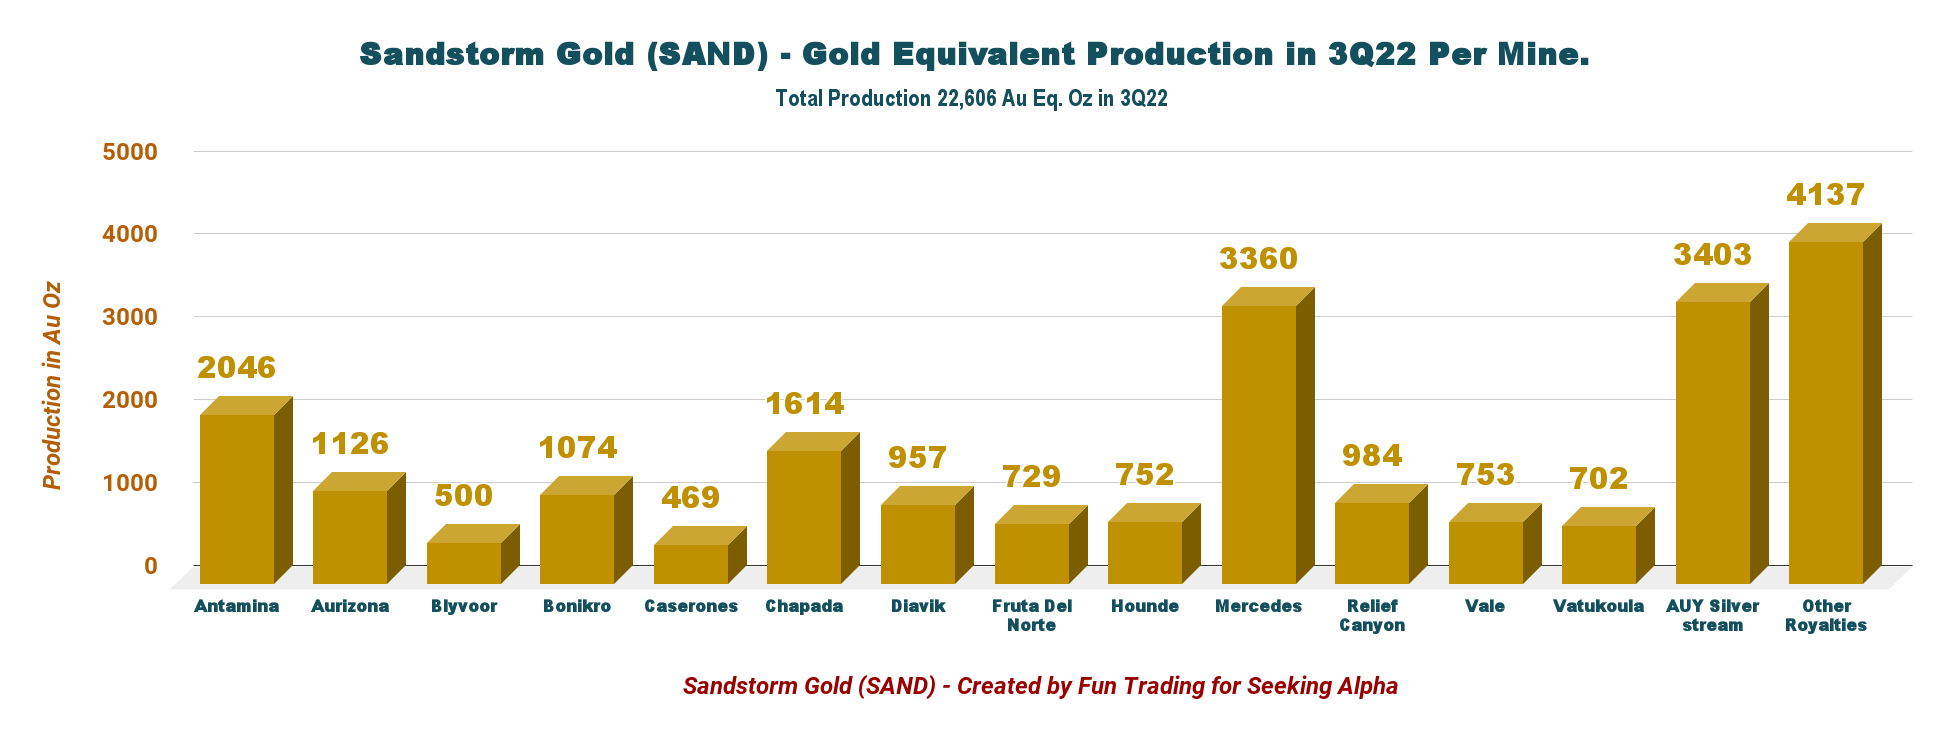
Technical Analysis and commentary
SAND TA Chart Short-term (Fun Trading StockCharts)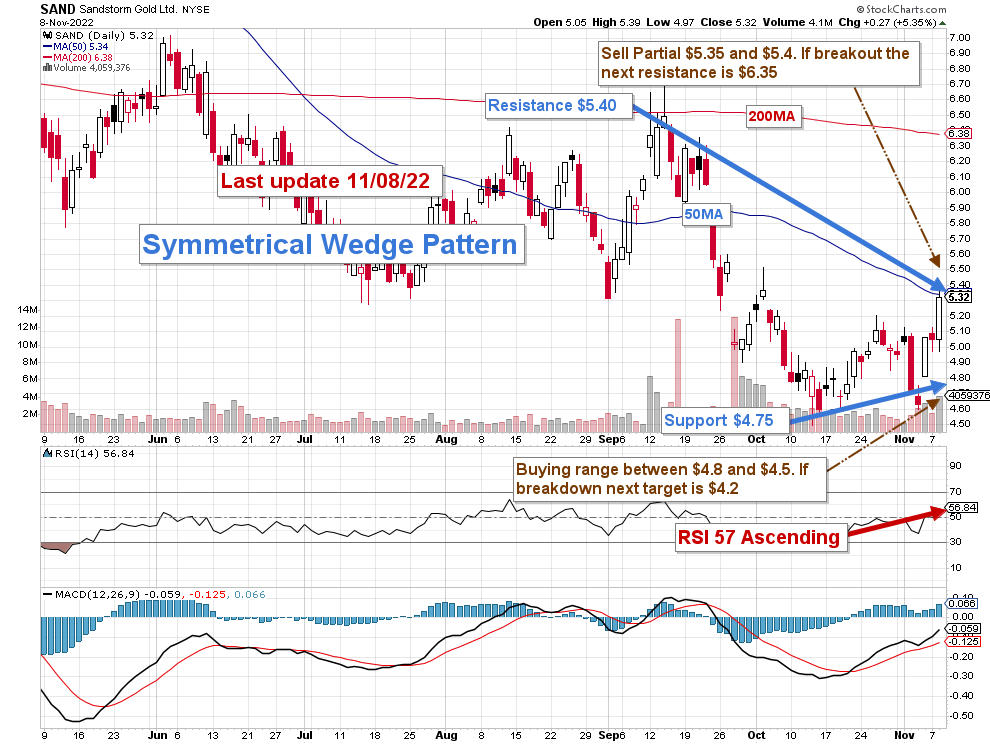
The trading strategy for SAND is to sell at a resistance range of $5.35 to $5.55, about 40% of your position, and eventually sell another part on any pattern breakout at $6.35 (200MA).
Conversely, it is reasonable to buy and accumulate between $4.95 and $4.50, with potential lower support at $4.20.
One crucial caveat is gold and silver prices are at $1,709 and $21,17, but it is fragile support due to the Fed’s hawkish position. Any downside could hurt SAND significantly.
SAND Gold silver comparison 1 Year chart (Fun Trading StockCharts)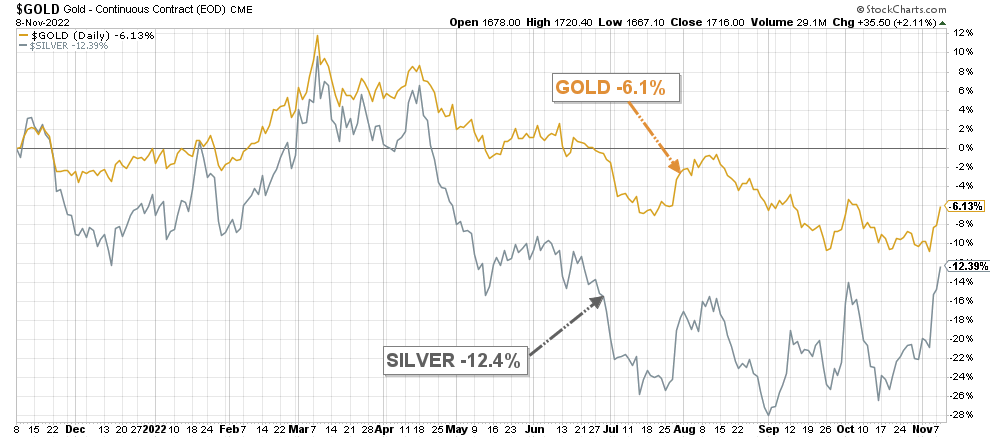
Watch gold like a hawk.
Note: The LIFO method is prohibited under International Financial Reporting Standards (IFRS), though it is permitted in the United States by Generally Accepted Accounting Principles (GAAP). Therefore, only US traders can apply this method. Those who cannot trade LIFO can use an alternative by setting two different accounts for the same stock, one for the long term and one for short-term trading.
Warning: The TA chart must be updated frequently to be relevant. It is what I am doing in my stock tracker. The chart above has a possible validity of about a week. Remember, the TA chart is a tool only to help you adopt the right strategy. It is not a way to foresee the future. No one and nothing can.
Author’s note: If you find value in this article and would like to encourage such continued efforts, please click the “Like” button below as a vote of support. Thanks.