Recessionomics | Seeking Alpha
franckreporter
It may seem odd to be talking about recessions when the latest jobs report, out just this morning, shows the unemployment rate back to the levels of 3.5 percent – a level which, along with those of July 2022 and February 2020, represents the lowest percentage of jobless in our country since 1969. Ultra-low unemployment, along with still-strong consumer spending patterns, normally does not signify an impending tip into negative growth.
But the robust job numbers do mean that the Fed will keep raising interest rates to bring down inflation, and Fed chair Jay Powell himself has said this will not happen without some pain. Sooner or later, the labor market and consumer demand will soften. So now seems as good a time as any to dive into the data and think about what a recession could mean for portfolio performance. You are likely to hear a great deal from the usual talking heads in financial media about recessions and markets, and much of that is likely to be…misleading, to be polite. We will shortly be publishing a more in-depth research paper on the topic; you can read today’s commentary as sort of a teaser for that upcoming piece.
Recessions By The Numbers
Let’s start with the big picture. In the postwar era we have experienced twelve recessions in the US. They divide rather neatly into three distinct economic eras: four in the postwar Bretton Woods era over the period 1948 to 1960; four during the long 1970s era of stagflation, and four spread very widely over the modern globalization era, from a brief downturn in 1990 to the even briefer (but much deeper) pandemic recession of 2020. The chart below gives a snapshot of this entire period.
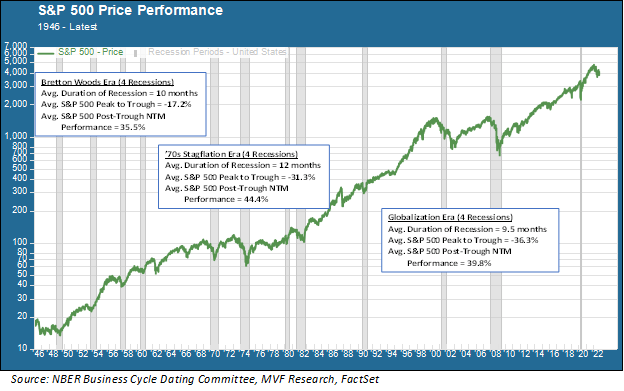
In the above chart we provide three metrics: the average duration of the four recessions in each economic era, the peak-to-trough price performance of the S&P 500 (with the peak representing the highest price within 12 months prior to the start of the recession and the trough being the low point reached during the recessionary period), and the S&P 500 price performance for the next twelve months (NTM) following the recession trough). Let’s look briefly at each of these in turn.
Production Cycles in the Bretton Woods Era
The long macro growth period immediately following the Second World War was a unique era of economic history, characterized by managed trade, fixed exchange rates (gold convertible into US dollars at $35 per ounce) and strict restrictions on the movement of capital across borders. It lasted roughly from the end of the war in 1945 until 1971, when then-President Nixon took the dollar off the gold standard.
The domestic US economy was very different in those days to what it is today. Although the US was the world’s largest exporter of both goods and capital, most major US companies were almost exclusively focused on the growing home market, where the baby boom was in full swing and the middle class was growing in both numbers and household wealth. Business strategy was focused on fixed capital investment and long-term production cycles.
Each of the four recessions in this period was a more or less classic textbook case of investment and production capacity falling off after running hot. The cycles came more quickly than those of later times: four recessions in the twelve year period from 1948 to 1960, or roughly one every three years on average. These recessions were also fairly similar in terms of duration and also in terms of stock market performance. The deepest peak-trough drawdown was 20.7 percent, and the shallowest was 12.8 percent. The market recovery in the twelve month period following the trough was also fairly uniform.
Policy Failures in the Stagflation Era
Next up are the four recessions over the period from 1970 to 1982, otherwise known as the “long 1970s.” The only one of these four that could plausibly be termed a “cyclical” recession similar to those of the Bretton Woods era was the recession of 1970, which came after an eight-year period of go-go economic growth powered by a major tax cut in 1964 and increased government spending to support aggressive social programs at home and the Vietnam War abroad.
Growth resumed after the 1970 recession, but so did inflation. The US dollar nosedived in the wake of going off the gold standard, and then OPEC quadrupled the price of oil in 1973. The recession of ’73 was the deepest to date in the postwar period. The Fed under chair Arthur Burns vacillated between raising rates to fight inflation and lowering them to fight recession. That indecisiveness led to stagflation – slow growth, high unemployment and high inflation.
The two recessions at the end of this period – often lumped into one event called a “double-dip” recession – proceeded directly from the austere Fed policy under Paul Volcker in which the Fed funds rate went as high as 20 percent and the scarcity of credit choked off economic growth. It also set the stage for a long period of growth that would follow in the ensuing decades.
From a portfolio performance standpoint there are a few things of note in this period, the first being that it was in general a terrible era for portfolio performance. The S&P 500 was unable to permanently sustain its high water market of 1968 until the great bull market of the 1980s began in 1982. The recessionary drawdowns in this period were also much steeper than those of the Bretton Woods era: minus 31.3 percent on average with the grinding recession of 1973-75 witnessing a 48.2 percent drop. These recessions were also more directly impacted by monetary policy – first the dithering of the Burns Fed and then the tough love of the Volcker Fed – than in the previous era.
The Globalization Era: Bubbles, Bubbles Everywhere
This brings us to the modern era of globalization, which we may or may not still consider ourselves to be in (we will have an additional research paper dedicated to this topic sometime in the weeks ahead). The first recession of this era, in 1990, was plausibly the most conventional – putting on the brakes after a long economic expansion. The stock market performance during the 1990 recession was also a bit more like the old recessions of the 1950s, with a peak-trough decline of just 18.2 percent.
The other three recessions were anything but conventional. The first, in 2001, happened in the middle of another event which arguably had a much bigger impact on price performance than the recession itself: the bursting of the tech bubble that started in 2000. One of the distinctive economic characteristics of the globalization era was the laser-like focus on short-term profits and asset price performance, as opposed to the long-term fixed capital investment cycles of the 1950s and 1960s. This asset price focus took on a life of its own in the latter part of the 1990s and then burst apart like a supernova. While the recession of 2001 was relatively mild, the asset bubble dynamics exacerbated the stock market decline, which plunged a whopping 49 percent from the 2000 peak to October 2002 (well past the end of the recession in December 2001).
Then came the big one – the financial crisis of 2008. The near-implosion of the financial system itself was the main catalyst for what became the most painful recession on record since the Great Depression. There was a bubble element to this event as well, but in this case the culprit was not unrealistic stock price valuations as with the 2000 tech crash, but a whole bunch of highly leveraged, interlinked mortgage and credit instruments which all unraveled when national housing prices peaked and went into decline.
Most unique of all, though, was the pandemic recession of 2020. In the space of two short months this recession, which came about due to human actions rather than organic cyclical developments, produced the deepest decline in GDP growth and the largest number of job losses since the Depression. But as soon as it happened, it was over.
What Happens In 2023?
What lessons can we learn from this postwar history of recessions? First of all, each one has its own distinct story based on conditions unique to that time. Second, recessions in the modern era are not just the product of natural economic cycles, but also of the latent systemic pressures that exist in a highly interlinked and mutually dependent global capital market. Third, an economy driven by a singular focus on asset price appreciation is capable of producing higher portfolio returns during growth cycles – and higher losses during the downturns.
Assuming that we do experience a recession in 2023, which we believe is likely if the Fed holds true to its inflation-fighting commitment, it has the potential to be more like a classic cyclical downturn than any of the more recent recession have been – more like 1990, for example, than 2001 or 2008. In this scenario the Fed will keep raising rates until it is convinced that high inflation has come down to stay, unemployment will rise, while business investment and household spending will slow. Assuming this scenario with no externalities (e.g. a market failure somewhere or an extreme geopolitical crisis), then it would be plausible to make a case for equity markets testing their lows in the near term and then rising in a post-trough growth cycle.
The key variable there is “no externalities.” In the wake of the recent debacle in the UK gilt market that we covered in last week’s commentary, there are growing concerns about something “breaking” in the market that would require intervention in the manner of the Bank of England’s needing to step in and buy gilts so as to forestall a collapse of major UK pension plans. In our world of very interlinked monetary instruments, the potential for breakage is always there. For portfolio performance to follow a more orderly path from recessionary downturn to post-trough growth, which is our base case scenario, things not breaking is a critical component.
We look forward to sharing with your our more in-depth analysis of “recessionomics,” expanding on the themes of this commentary, in the next several weeks.
Editor’s Note: The summary bullets for this article were chosen by Seeking Alpha editors.