Playa Hotels & Resorts Stock: Long-Term Outlook Encouraging (NASDAQ:PLYA)
mrtekmekci/iStock via Getty Images
Investment Thesis: Strong growth in RevPAR as well as a rising quick ratio indicates that Playa Hotels & Resorts (NASDAQ:PLYA) is seeing an encouraging recovery following the COVID-19 pandemic. I take a long-term bullish view on the stock.
In a previous article, I made the argument that Playa Hotels & Resorts could see upside going forward as a result of a recovery in RevPAR (revenue per available room) and ADR (the average daily rate) across the company’s major geographies. Moreover, with property prices rising in the Dominican Republic, I also made the argument that rising prices would provide a buffer against lower than expected resort bookings.
With that being said, inflationary concerns and bearish market sentiment has coincided with a significant drop in the stock:
investing.com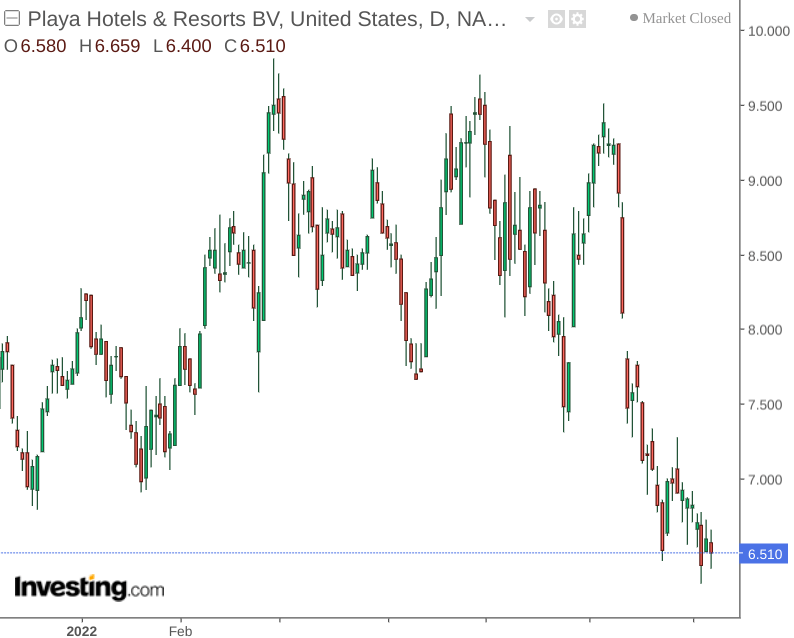
The purpose of this article is to analyse whether the recent sell-off was overdone and if Playa Hotels & Resorts could reasonably see upside from here.
Portfolio Performance
Overall, Playa Hotels & Resorts saw a strong rebound in ADR and RevPAR from 2020 through to last year.
To get a better overview of revenue performance across the different geographies in the company’s portfolio, I decided to collate quarterly data on ADR and RevPAR for all quarters in 2020 and 2021. The ADR and RevPAR figures were then averaged by year in order to determine performance across each geography in the portfolio.
The calculations were performed using SQL, and these can be found along with the original quarterly figures here.
2020
| Portfolio | ADR | RevPAR | RevPAR (% by portfolio) |
| Jamaica | 315.39 | 128.55 | 31.10% |
| Yucatan Peninsula | 292.27 | 120.73 | 29.21% |
| Pacific Coast | 395.25 | 102.31 | 24.75% |
| Dominican Republic | 239.74 | 61.79 | 14.95% |
Source: Calculations made by author.
2021
| Portfolio | ADR | RevPAR | RevPAR (% by portfolio) |
| Yucatan Peninsula | 318.49 | 168.23 | 29.48% |
| Pacific Coast | 344.01 | 163.14 | 28.58% |
| Jamaica | 300.86 | 129.1 | 22.62% |
| Dominican Republic | 268.1 | 110.26 | 19.32% |
Source: Calculations made by author.
When looking at average RevPAR by year – we can see that the Yucatan Peninsula has become the largest revenue generator in the company’s portfolio, and this accounted for just under 30% of overall revenue in 2021.
However, what is also noteworthy is that the Jamaica region saw average RevPAR for 2020 and 2021 at virtually identical levels and Jamaica was the top revenue earner for the company in 2020.
With that being said, the Yucatan Peninsula and Dominican Republic saw growth in both RevPAR and ADR, while the Pacific Coast and Jamaica saw a drop in ADR despite RevPAR growing by 59% for the former and remaining flat for the latter.
2022
| Portfolio | ADR | RevPAR | RevPAR (% by portfolio) |
| Yucatan Peninsula | 429.45 | 308.75 | 27.02% |
| Pacific Coast | 454.61 | 302.89 | 26.50% |
| Jamaica | 415.11 | 280.54 | 24.55% |
| Dominican Republic | 324.26 | 250.68 | 21.93% |
Source: Calculations made by author.
While only the first quarter of data for 2022 is available, we seem to be seeing a continuation of this trend so far, with Yucatan Peninsula and the Pacific Coast remaining the top two by revenue along with higher ADR across these portfolios.
What is particularly noteworthy is that both the Yucatan Peninsula and the Dominican Republic were able to increase average price charged per day to customers while also increasing revenue. This might suggest that customers who book across these portfolios are less price sensitive and even if inflation does somewhat lower the recovery for travel demand this summer – I take the view that revenue across these geographies could increase further in spite of rising prices.
Looking Forward
The rebound in revenue to date has been encouraging.
Going forward – it is unclear to what extent inflation can be expected to dampen demand from here.
In spite of the rebound in revenue growth we saw last year, the stock could see some downside if growth this year comes lower than expected due to inflationary concerns.
In this regard, investors will likely be paying more attention to the company’s cash position in order to ensure that it can withstand a potential drop in revenue growth.
To gauge this, I decided to calculate the quick ratio for the periods Q1 2021 and Q1 2022. This was calculated as cash less inventories, over total liabilities less deferred tax liabilities.
| Items | March 2021 | March 2022 |
| Cash and cash equivalents | 200427 | 299802 |
| Inventories | 14063 | 18801 |
| Total liabilities | 1430177 | 1415601 |
| Deferred tax liabilities | 64161 | 70470 |
| Quick ratio | 13.64% | 20.89% |
Source: Figures sourced from First Quarter 2021 and First Quarter 2022 Financial Reports. Quick ratio calculated by author.
With the quick ratio having risen from 13% last year to just under 21% in the most recent quarter, Playa Hotels & Resorts has been showing evidence of an improving cash position.
From this standpoint, I take the view that the company is in a good position to withstand a potential slowing of revenue growth.
Conclusion
To conclude, revenue growth across the company’s portfolios has been encouraging, with Playa Hotels & Resorts also showing a strengthening financial position.
While the stock could be at risk of short-term downside if revenue growth comes in below expectations due to inflationary concerns – I take a longer-term bullish view on the stock.