Pilgrim’s Pride: Still Not Cheap Enough To Justify Long Exposure (NASDAQ:PPC)

alex-mit
Intro
We wrote about Pilgrim’s Pride Corporation (NASDAQ:PPC) approximately 12 months ago when we stated that the stock’s keen valuation and growing sales reduced forward-looking risk in this play. Not long though after we penned that piece, growth began to taper off pretty significantly in PPC and the share price has suffered as a result. In fact, both top-line sales & gross profit topped out in Q2 of last year at $4.63 billion & $677 million, respectively. These numbers are well ahead of the $4.165 billion in top-line sales as well as the $173 million gross profit number in Q1 of this year.
When we look at Pilgrim’s technical chart, it is very interesting that the topping out of the share price in June of last year coincided with the top we saw in late 2019. The technicals once again demonstrate that history repeats itself many times in the financial markets as investor psychology in the main tends not to change. Shares still though are in bearish territory as the stock’s 10-week moving average remains well below the corresponding 40-week average.
Therefore, let’s delve into Pilgrim’s Pride from a ‘value’ perspective to see if we can ascertain whether investors will eventually step in here on the long side in this latest down move. We will look at the trends of the company’s sales and book multiples (As sales & assets are what essentially cause earnings to happen) as well as the balance sheet to see if shares are worth buying around their present price point ($22.54).
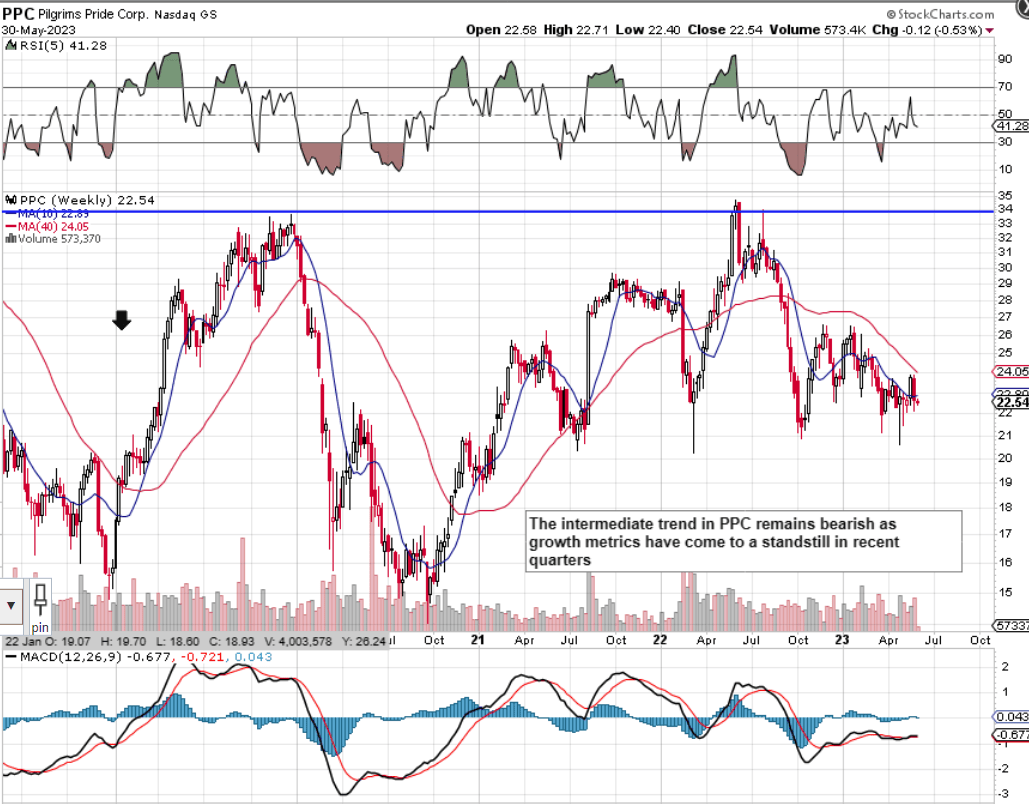
Pilgrim’s Pride Technical Chart (Stockcharts.com)
Price To Sales Ratio
If we divide Pilgrim’s trailing 12-month sales of $17.39 billion into the company’s present market cap of $5.33 billion, we get a trailing price-to-sales ratio of 0.31. This multiple is the real calling card in this stock from a valuation standpoint as it is much cheaper than the sector (1.1) plus also the stock’s 5-year average (0.46). In fact, if we value Pilgrim’s sales by taking into account the company’s debt & cash position, we get an EV/sales multiple of 0.50 which again looks attractive compared to the 5-year average comparable of 0.64.
However, in inflationary environments, many times companies post higher sales (due to rising prices) but due to margin contraction further down the income statement, end up making fewer profits. Therefore, we need more than cheap sales to justify a buying decision in PPC which is why we also turn to the company’s book multiple (assets).
Price To Book Ratio
Pilgrim’s trailing price-to-book ratio comes in at 1.85 which again compares favorably with the company’s 5-year average of 2.36. Assets are essentially the roots that birth the tree so the cheaper we can buy them, the better from a long-term perspective. Furthermore, both the sales and book valuation multiples tend to revert back to their long-term means, which again bodes well for future share-price appreciation.
However, it is imperative to see what Pilgrim’s equity comprises. A balance sheet with no leverage and multiple hard assets, for example, is much more appealing to us than a balance sheet with high leverage and sizable amounts of intangible assets. Suffice it to say, not all equity is measured equally in our eyes, which is why one needs to go to the balance sheet to see how the company’s liquidity and solvency metrics have been faring out.
In fact, due to dwindling cash position, as we see in the following paragraph, PPC unsurprisingly completed a 10-year note offering after Q1 this year (April) to improve the company’s liquidity position as well as pay off outstanding term loans. Why they did this is explained below.
Balance Sheet (Liquidity & Solvency Trends)
Firstly, if we focus on Pilgrim’s current assets and compare current numbers at the end of Q1 this year to the company’s averages over the past five years, we see that Pilgrim’s cash balance of $150 million had never been lower. Furthermore, the company’s receivables of $1.38 billion and inventory of $2.02 billion were at their highest levels in Q1 over the past five years. This meant the trend of Pilgrim’s $3.82 billion of current assets had shifted more to receivables and inventory and away from liquid cash.
Current liabilities of almost $2.5 billion had almost doubled since fiscal 2018 which means Pilgrim’s current ratio came in at 1.53 at the end of Q1. Although this liquidity ratio was in line with historic averages, the lack of cash (Or liquidity) meant that PPC had to raise it somehow (2023 notes offering). These funds will span out the company’s debt whilst also increasing the company’s cash balance in the near term.
Long-term debt hit $3.193 billion at the end of Q1 which meant the debt-to-equity ratio came in at 1.1. Although this ratio may not look elevated on the surface, Pilgrim’s recent growth problems means leverage has now become a bigger problem. In Q1 this year, for example, EBIT of $39 million was not enough to cover net interest expense of $42.7 million. Therefore, with forward-looking EPS revisions continuing their slide, Pilgrim needed more flexibility to ensure it was prepared for elevated volatility going forward.
Conclusion
Therefore to sum up, given the recent contraction in Pilgrim’s Pride’s share price, we still do not believe the risk/reward setup is favorable at the stock’s current price point. Pilgrim’s sales and assets may look undervalued but growing leverage in a negative growth environment continues to bring elevated downside risk to this play. We look forward to continuing coverage.