PHO ETF: U.S.-Centered Water Play Is Valued Horribly (NASDAQ:PHO)

Doucefleur/iStock via Getty Images
The Invesco Water Resources Portfolio ETF (NASDAQ:PHO) is yet another water economy-centered thematic fund I would like to discuss. The purpose of my today’s article is to analyze its factor exposure, carefully reviewing its value, growth, and quality characteristics harnessing the Quant data to arrive at a conclusion about whether it makes sense to buy into the ETF at the current levels.
Before we proceed to the analysis of the key metrics of concern, let me briefly remind the major takeaway from my two previous articles on water industry ETFs published earlier this year, namely on the Invesco Global Water ETF (PIO), as well as Invesco S&P Global Water Index ETF (CGW).
My point is that water is an indubitably precious resource, and the growth in demand over the course of decades bolstered by global population expansion does offer a lucrative opportunity. However, as I concluded in my October note on PIO,
…capitalizing on this trend via equity investments is not necessarily achievable, as distilling a water pure-play portfolio is close to impossible.
What is PHO’s investment strategy?
With $1.5 billion in net assets amassed since its inception in December 2005, PHO tracks the modified liquidity-weighted NASDAQ OMX US Water Index. The index is in many ways similar to the one its peer PIO adheres to, targeting companies involved in the purification and conservation of water both for the residential and industrial end-markets.
Yet there is a principal difference, namely geographical footprint. The latter has meaningful exposure to international stocks, while the former does not, since it is required to be listed on a U.S. exchange to qualify for inclusion in it. Expectedly, according to the PHO holdings dataset, it has just one ADR in the portfolio, Cia de Saneamento Basico do Estado de Sao Paulo (SBS), a Brazilian water and sewage service provider, with a 1.86% weight.
During recent years overshadowed by elevated FX volatility amid the trade war that roiled supply chains, then the coronavirus pandemic that exaggerated the already existing issues, large exposure to the yen, the pound sterling, the euro, etc. has been a major detractor from PIO’s performance. This year, FX headwinds resulting from U.S. interest rate increases also look like a plausible reason why it solidly underperformed PHO.
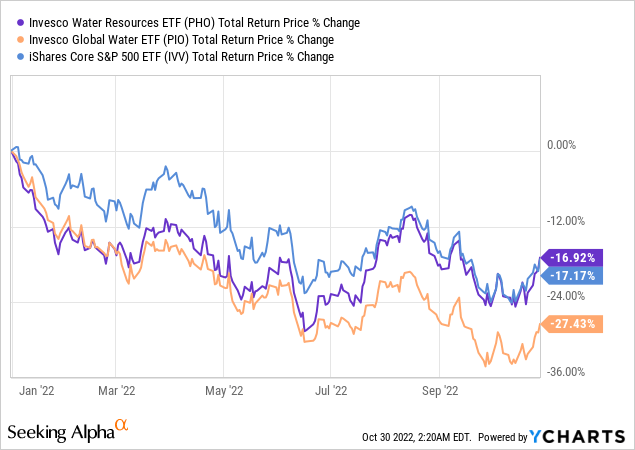
Meanwhile, the flip side here is that the PHO fund would be incapable of reaping the benefits of the inevitable weakening of the USD should the interest rate hikes end at some point next year, principally depending on the CPI dynamics, employment trends, and the recession risk. The Fed pivot, if materialized, could also contribute to the rebound.
One way or another, even considering a recovery in developed world currencies will ultimately be staged in the medium term (especially assuming the energy crisis in Europe is resolved), I am skeptical about whether PIO is the best pick to play that.
The product of PHO’s strategy is a portfolio of 36 stocks, with over 60% allocated to the main ten. Investors who are into large-cap-heavy baskets with all the quality benefits they sport would be likely disappointed here, since the median market cap of the fund’s holdings is only approximately $4.6 billion, with the median enterprise value at ~$5 billion.
Yet a weighted-average figure is materially higher and stands at over $29 billion, as of my calculations, thus it should offer some solace. Regardless, 40% of the net assets allocated to mid- and small-cap stocks is an issue to consider. Below, discussing the profitability and quality factors, I will explain why this is a vulnerability.
In terms of sectors, this is an extremely industrials-heavy play, with a 48% share disproportionately spread between 20 holdings. Utilities come second with 17.7%. Healthcare is the last in the key trio, having 15.4%. Other sectors the fund favors are information technology (11.1%), with Roper Technologies (ROP), an application software company, being its main investment with around 8.1% of the net assets allocated, and materials (7.6%); the latter is only represented by Ecolab (ECL), a company with a portfolio of water, hygiene, and infection prevention solutions.
Looking at value, quality, and growth
In my notes, I always encourage my dear readers who have a special interest in ETFs to look beyond a promising investment theme and instead focus on factors. Valuation, quality, and growth prospects are what matter.
And when it comes to PHO’s factor exposure, there is a lot to criticize. First, it is valued horribly. The Quant data for the 20 key holdings (~88% of the net assets) speak for itself.
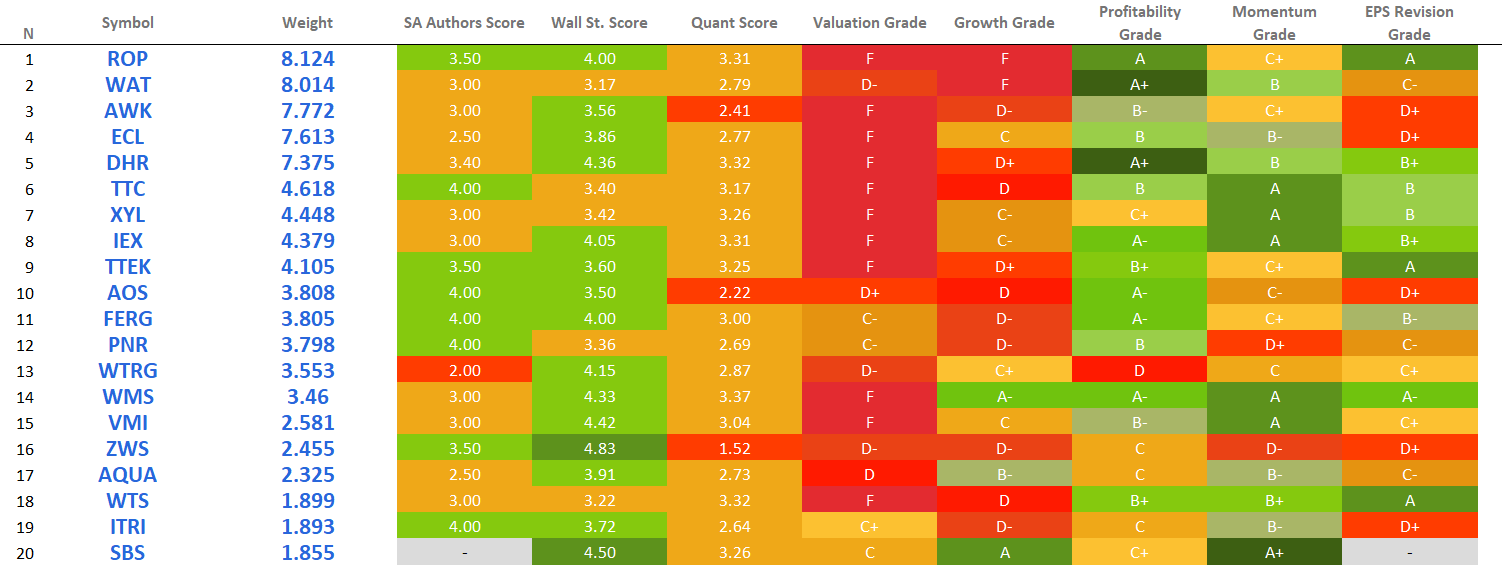
Created by the author using data from Seeking Alpha and the fund
An 85.5% share of stocks trading at a sizeable premium to their respective sectors is the one I would expect from a speculative tech fund. Yet, this is an industrials-heavy ETF tilted towards mid-caps. And I dislike this mix.
For better context, a table with select valuation metrics for the top 20 stocks is presented below.
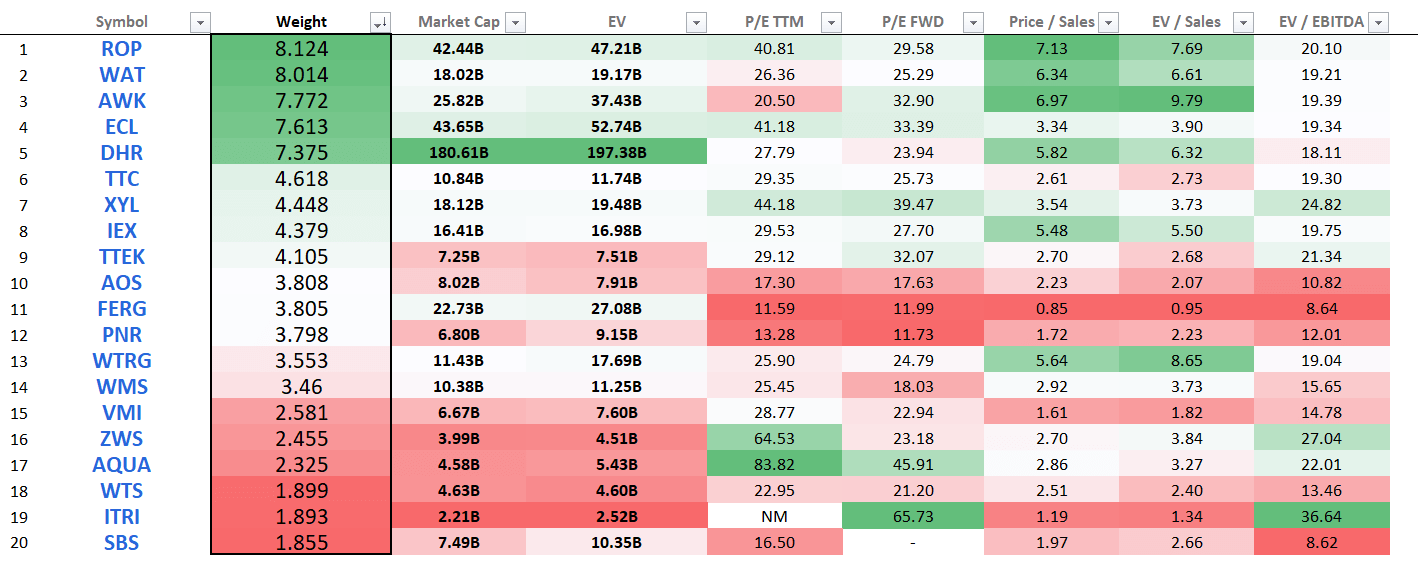
Created by the author using data from Seeking Alpha and the fund
Also, looking at the weighted-average multiples, the WA EV/EBITDA (Last Twelve Months) of 18.67x is clearly on the expensive side (especially considering an industrials sector median is ~11.76x), with a weighted-average Enterprise Value/Sales of 4.9x being similarly overstretched.
As an additional indication of over-appreciation (hence, little to no margin of safety should the hawks-driven sell-off continue) is a large presence of stocks with a D- Yield grade and worse, around 72.5%. Obviously, buying into a 30 bps-yielding PHO for a value or dividend investor is merely nonsensical at these levels.
However, are these multiples justified by the higher quality of PHO’s holdings? Only partly. It does have ~76.5% share of the stocks with at least B- Profitability grade, with only a few names being cash flow-negative, as illustrated by the chart below. However, this is not ideal.

Created by the author using data from Seeking Alpha and the fund
Besides, stocks sporting growth characteristics like Global Water Resources (GWRS) account for less than 13.5% of the net assets, so I would not say that premium valuation is justified.
How did PHO perform in the past?
Since its inception (excluding December 2005 and October 2022), PHO has failed to beat the iShares Core S&P 500 ETF (IVV), delivering just 7.39% CAGR vs. IVV’s 8.63%, with a standard deviation being higher by ~4%. Still, it should be noted that the lower CAGR was likely the consequence of higher expenses; meanwhile, annual performance looks overall robust, especially in recent years.

Created by the author using data from Portfolio Visualizer
This year (October included), PHO has marginally outperformed IVV, by around 25 bps, more likely since the latter has been dragged down by softness in the tech bellwethers this earnings season.
Final thoughts
To conclude, I would not say it makes sense to invest in a mid-caps-heavy fund with an utterly horrible valuation. Quality is certainly not entirely dismal, with a comparatively large share of highly profitable stocks being a solid bright spot. However, a bullish thesis could not be constructed on this premise alone.
Obviously, PHO has a few advantages. For instance, it is inherently less sensitive to the global macro assuming it invests only in U.S. stock exchange-listed companies, thus risk of FX headwinds denting its returns is comparatively small. By the same token, it could underperform other water plays that have smaller exposure to the dollar when the hiking cycle in the U.S. is over.
That said, it is not to be forgotten that FX sentiment will one way or another influence its returns, owing to its holdings having globally diversified business models. For example, as Xylem (XYL), the fund’s holding with a 4.4% weight, mentioned on slide 18 of its Q2 presentation, a 5% decrease in the FY 2022 euro guidance rate of 1.01 would remove $42 million from revenues and $0.13 from EPS.
In sum, all of the above points to the fact PHO is a Hold at best.