Kinder Morgan Stock Still Offers Upside From Here (NYSE:KMI)
JHVEPhoto/iStock Editorial via Getty Images
As one of the largest energy companies in North America, with an extensive network that includes over 83,000 miles of pipelines and 141 terminals, not to mention other assets, Kinder Morgan (NYSE:KMI) is the kind of large and stable firm that most investors who want safety should gravitate toward. Generally speaking, the company has done well from a cash flow perspective in recent years. The most recent data provided by management shows that cash flow has been a bit mixed so far this year. But on the whole, this is a quality company that is trading at fundamentally attractive levels. Due to these factors, I still believe that the company should provide investors with solid upside moving forward. And as a result, I’ve decided to keep the ‘buy’ rating I had on its stock previously.
Recent performance has been mixed
In July of this year, I revisited my investment thesis regarding Kinder Morgan. In that article, I talked about financial results that, at that time, had been rather robust. Cash flows were coming in strong and management talked about significant share buybacks that had been engaged in. Add on top of this the guidance provided by management, as well as how cheap shares were, and I felt as though the company offered additional upside that was attractive enough to lead me to rate it a ‘buy’. Since the publication of that article, the company has not disappointed. While the S&P 500 is down 1.6%, shares of Kinder Morgan have generated upside of 5.4%.
Author – SEC EDGAR Data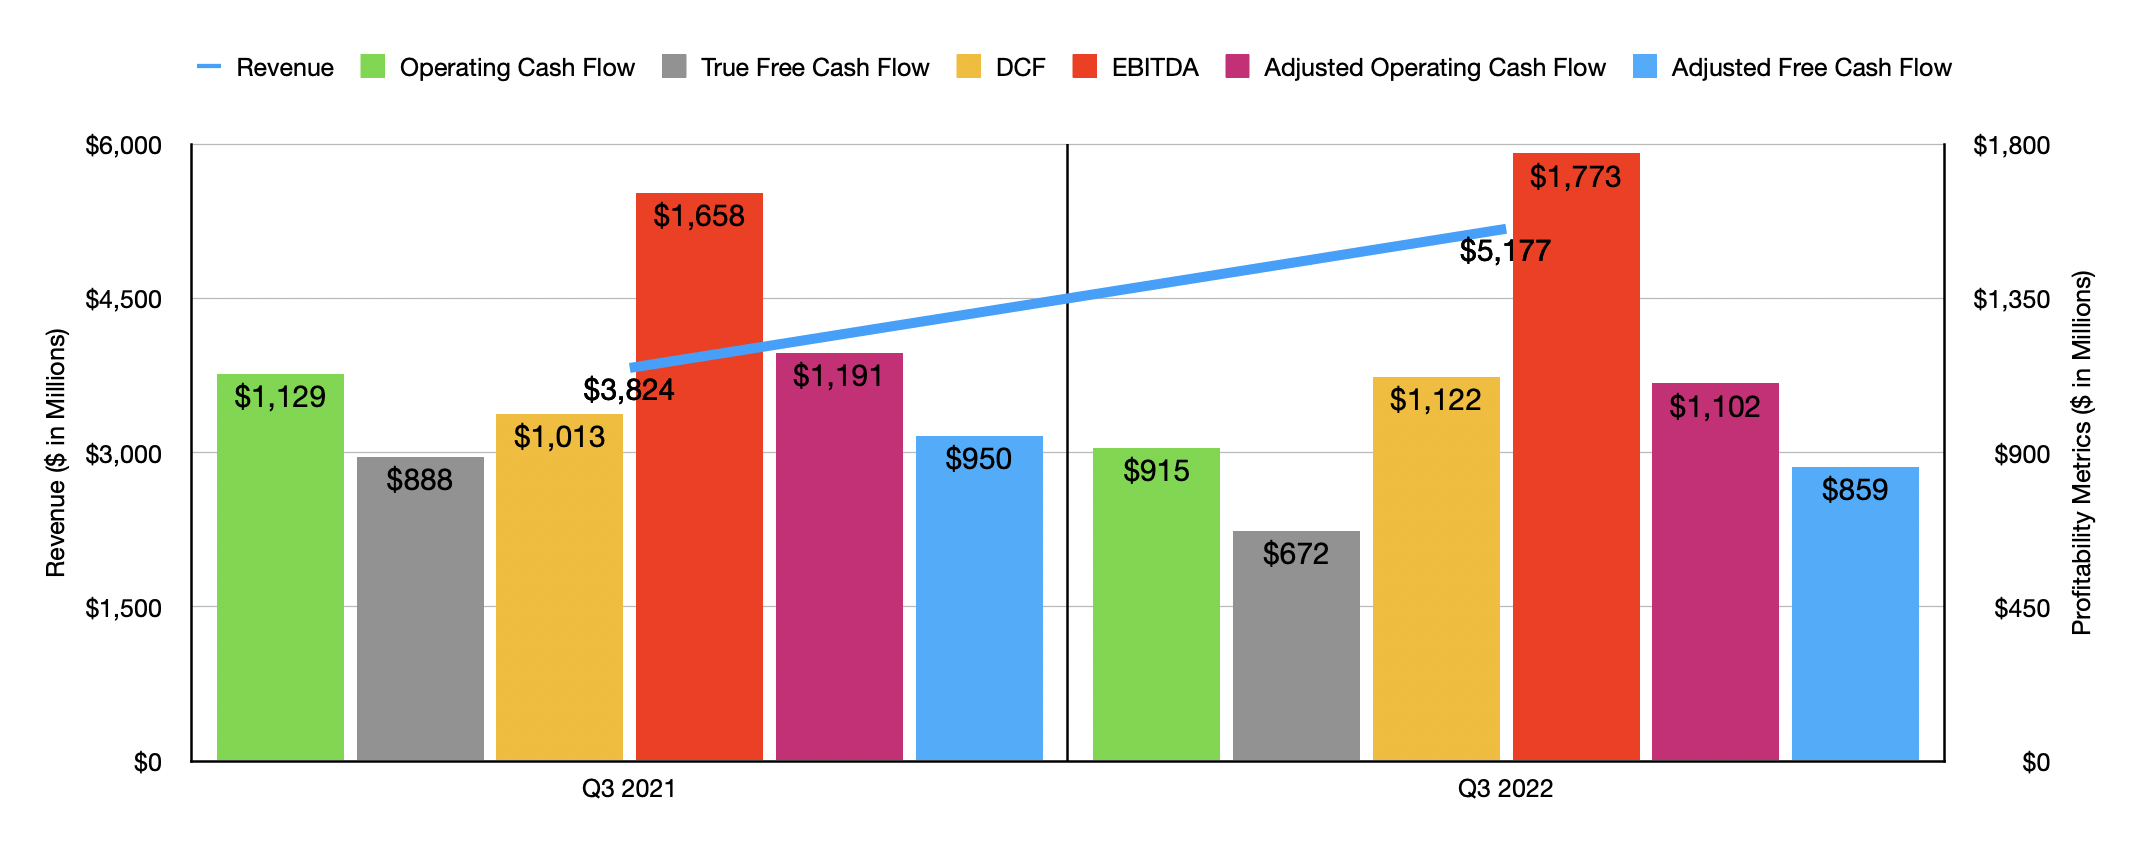
In my last article, we only had data covering through the second quarter of the company’s 2022 fiscal year. Today, we now have data covering through the third quarter. During that extra quarter, revenue came in strong at $5.18 billion. That’s 35.4% higher than the $3.82 billion the company generated only one year earlier. Normally, I would be incredibly happy seeing such a meaningful increase in sales. But in the pipeline/midstream space, revenue is not all that important. Rather, it’s the spread between what the company can charge for its services and its input costs that matters.
Looking at things from an operating cash flow perspective, we did see a bit of weakness. Cash flow during the quarter was only $915 million. That’s down from the $1.13 billion reported in the third quarter of 2021. Another metric that I pay attention to is ‘true free cash flow’. This is essentially operating cash flow minus capital expenditures that are used to keep operations running as they are today. This is an important distinction from actual free cash flow because actual free cash flow also involves subtracting growth-oriented capital expenditures from the equation. In essence, that makes companies that are investing heavily in growth look more expensive than they otherwise might. This metric for the latest quarter was $672 million. That’s down from the $888 million reported one year earlier.
Author – SEC EDGAR Data
If we adjust for changes in working capital, operating cash flow would have fallen more modestly from $1.19 billion to $1.10 billion. Meanwhile, the adjusted ‘true free cash flow’ for the company would have fallen from $950 million to $859 million. There are, of course, other profitability metrics. And on this front, the company did fare better. For instance, DCF, or distributable cash flow, increased from $1.01 billion to $1.12 billion. And over that same window of time, EBITDA for the company expanded from $1.66 billion to $1.77 billion. As you can see in the chart above, the results achieved in the third quarter were in some ways similar to what the company achieved in the first nine months of the 2022 fiscal year as a whole. Revenue rose nicely year over year, but operating cash flow as well as ‘true free cash flow’ both fell year over year. Even on an adjusted basis, these numbers are down. But unlike what we saw during the third quarter, DCF and EBITDA are down as well. Although this is the case, management has been more than happy to not only pay out its regular distribution, but also to continue buying back stock. In the third quarter alone, the company repurchased almost 9.7 million shares for $160.1 million. And subsequent to the end of the quarter but ending on October 20th, the company repurchased another 2 million shares for $34 million.
Kinder Morgan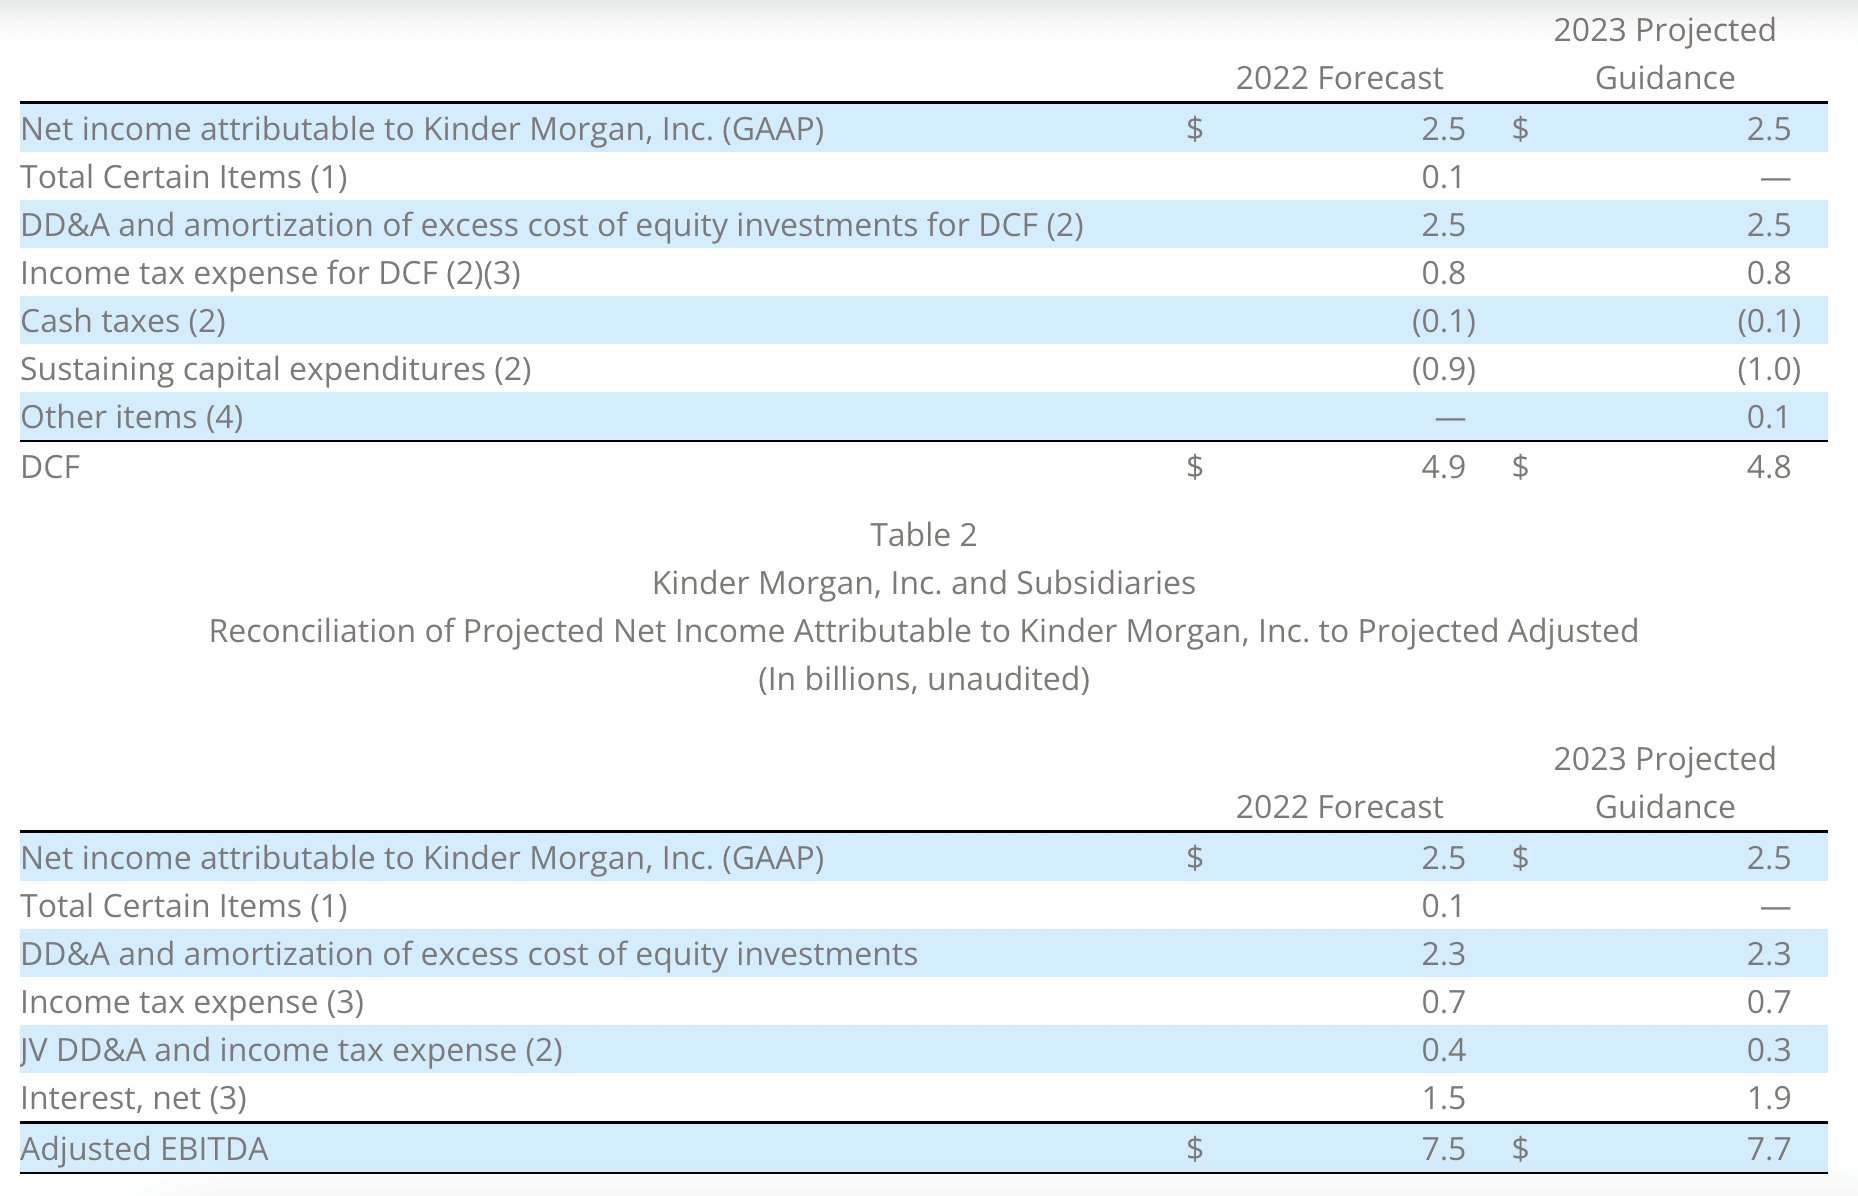
Despite these profit figures, management does have sold expectations when it comes to the rest of the 2022 fiscal year. Currently, they are forecasting DCF of $4.9 billion and EBITDA of $7.5 billion. Unfortunately, management has not provided any guidance when it comes to other profitability metrics. But a good approximation for operating cash flow would be $5.3 billion, while for ‘true free cash flow’ it would be $4.4 billion. When it comes to 2023, management is expecting DCF of around $4.8 billion, while EBITDA should come in at around $7.7 billion. If it seems peculiar to see a divergence between DCF and EBITDA, it’s important to note that the change is largely attributable to expectations regarding interest expense.
Author – SEC EDGAR Data
Taking these figures, I was able to easily value the company. using the data from 2022, the firm is trading at a price to adjusted operating cash flow multiple of 7.9. This compares favorably to the 9.1 reading that we get if we use data from 2021. The price to ‘true free cash flow’ multiple for the business should be a bit higher at 9.5. But that’s also down from 2021 when we get a reading of 11.3. The price to DCF multiple should be 8.9 compared to the 9.5 seen previously. And the EV to EBITDA multiple should be 10.3 compared to the 10.7 reading that we get using data from last year. Also in the chart above, you can see pricing using estimates for 2023. In this case, the company should look cheaper using two of the three methods while being more expensive using the other two.
I would make the case at this moment that shares of Kinder Morgan are definitely attractively priced on an absolute basis. But it also helps to put into context how shares are priced compared to similar businesses. In the table below, you can see its valuation, using data from 2022, stacked up against the valuations of five similar firms. On a price to operating cash flow basis, these companies ranged from a low of 3.8 to a high of 8.8. In this case, three of the five companies were cheaper than Kinder Morgan. Meanwhile, using the EV to EBITDA approach, the range was from 7.6 to 391.2. And in this case, two of the five were cheaper than our target.
| Company | Price / Operating Cash Flow | EV / EBITDA |
| Kinder Morgan | 7.9 | 10.3 |
| The Williams Companies (WMB) | 8.6 | 11.9 |
| Energy Transfer (ET) | 3.8 | 7.6 |
| Cheniere Energy (LNG) | 5.3 | 391.2 |
| MPLX (MPLX) | 6.5 | 9.7 |
| TC Energy Corporation (TRP) | 8.8 | 12.1 |
Takeaway
What the data I have in front of me suggests is that, in addition to being a high-quality enterprise in this space, Kinder Morgan is trading at levels that investors should generally find appealing. Yes, the 2023 fiscal year might not be ideal compared to this year. But on the whole, shares look cheap. It also helps that, on a forward basis, the company is paying out a distribution that equates to a 6.3% yield per annum. During these difficult times, getting some sort of cash flow coming in can help to ease the pain and remove or reduce uncertainty. To be fair though, I would not call Kinder Morgan the best prospect in this space. While certainly worthy of a ‘buy’ rating, it pales in comparison, in my opinion, to Energy Transfer, which I own shares of.