IYJ: Industrials Mixed Signals For Performance And Outlook
Vladimir Zakharov
Thesis
With 2022 about to end, the U.S. market looks to lick its wounds after a rather disappointing year for stocks, hoping for a Santa rally to erase some losses. The industrial sector has been battling numerous challenges ranging from inflation to persisting supply chain disruptions and has recorded some significant losses along with the broader market. In this analysis, I examine the sector’s performance and outlook through BlackRock’s iShares U.S. Industrials ETF (BATS:IYJ), as well as the fund itself.
Industrials So Far in 2022
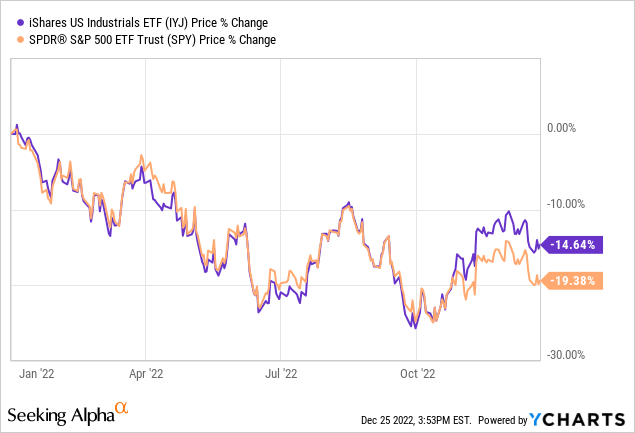
In the midst of many challenges, especially aimed at the industrial sector so far in 2022, the downslide has been a bit more moderate than many might have anticipated in the current market conditions. Following the S&P 500’s (SP500) path downwards, the sector has pulled away somewhat as of recently, recording losses of -14.64% YTD compared to the market’s -19.38% decline.
IYJ Overview
iShares U.S. Industrials ETF offers investors direct exposure towards the industrial sector by tracking the Russell 1000 Industrials index. The fund was incepted in June, 2000 and currently, its Net Assets amount to $1.25B. IYJ maintains 180 holdings and charges a rather high expense ratio of 0.39%. The fund pays a 1.05% dividend yield, lower than the market average.
While the fund’s portfolio mostly consist of stocks in the industrial sector, its top two holdings are actually more financially oriented, Visa (V), with a 7.09% weighting, and Mastercard (MA) with a 6.12% weighting. Other major holdings include Raytheon Technologies (RTX), Caterpillar (CAT), Deere (DE), Lockheed Martin (LMT) and others. Cumulatively, IYJ’s top 10 holding represent around 35% of the total weighting.
Longer-term Performance
Since iShares’ IYJ has been around for well over 20-years, aside from the recent return trajectory, it is important to examine performance attributes over the long term, as a proxy for sector performance over the same period. To this end, I employed the tools offered by Portfolio Visualizer. IYJ’s risk and return metrics are calculated from the second half of 2000 up to the present. The fund’s performance is plotted in comparison to the S&P 500 (SPY). A $10,000 initial investment balance and dividend reinvesting are assumed for both ETFs.
The 20+ year reference period will reveal that the industrials’ ETF has outperformed the broader market on a return basis. More specifically, IYJ has recorded a CAGR of 7.23% compared to SPY’s 6.67%, increasing a $10,000 initial balance to $47,561. During its best year the fund returned 40.06% and lost -39.77% during its worst. Correlation with the market is rather strong, at 0.95.
Sector cyclicality has historically caused the sector, however, to exhibit higher volatility. For the 20+ year period IYJ’s standard deviation comes at 19.14% compared to the S&P 500’s 15.42%. With that in mind, we can see that on a risk-adjusted basis, as measured by the Sharpe ratio, the broader market slightly outperforms. That should not come as much of a surprise however, given the long reference period and the much greater diversification an S&P 500 ETF offers. Overall, IYJ’s performance over the long term has been very respectable.
Portfolio Visualizer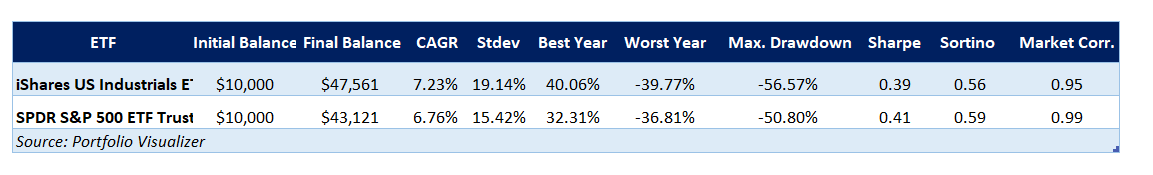
Challenges and Tailwinds
New orders in manufacturing are often viewed as a gauge of industrial activity and are without doubt an important indicator for industrials in general. After a historic drop in the aftermath of Covid-19, new orders in manufacturing have been consistently trending upward, indicating increasing activity, despite many supply chain challenges and inflation
FRED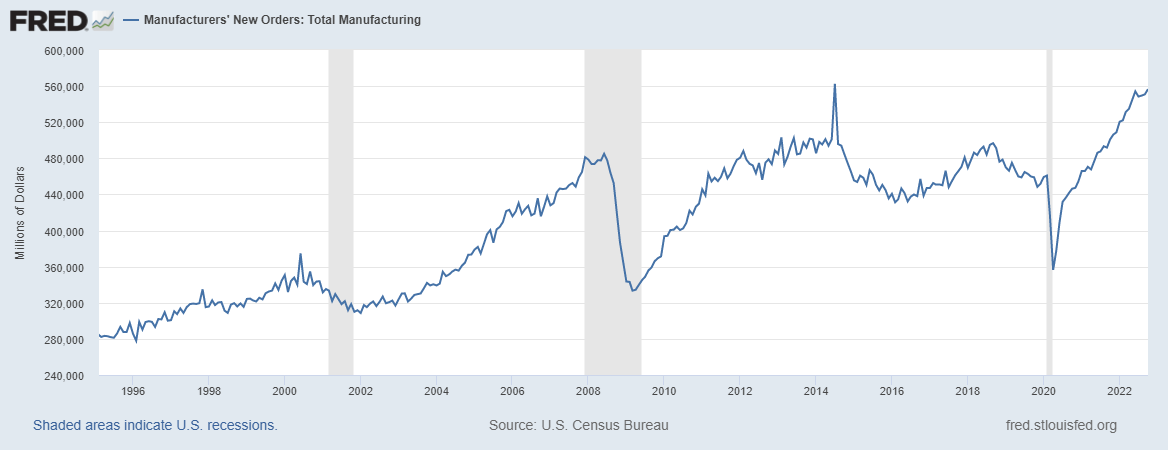
A high inventory-to-sales ratio is often indicative of a peak in a business cycle. As sales slow down and firms have built large inventories over the growth phase, they are often challenged with inventory overcapacity. While not a perfectly accurate predictor of contractions high inventory-to-sales ratios are somewhat alarming.
Currently, the ratio, as seen in the chart below, stands at higher-than-average levels. While the ongoing supply chain challenges might distort the picture a bit, we should point to the possible sales’ slowdown anticipated ahead. It is however, also likely that the ratio remains at high levels for a while, as firms try to keep up with elevated demand.
FRED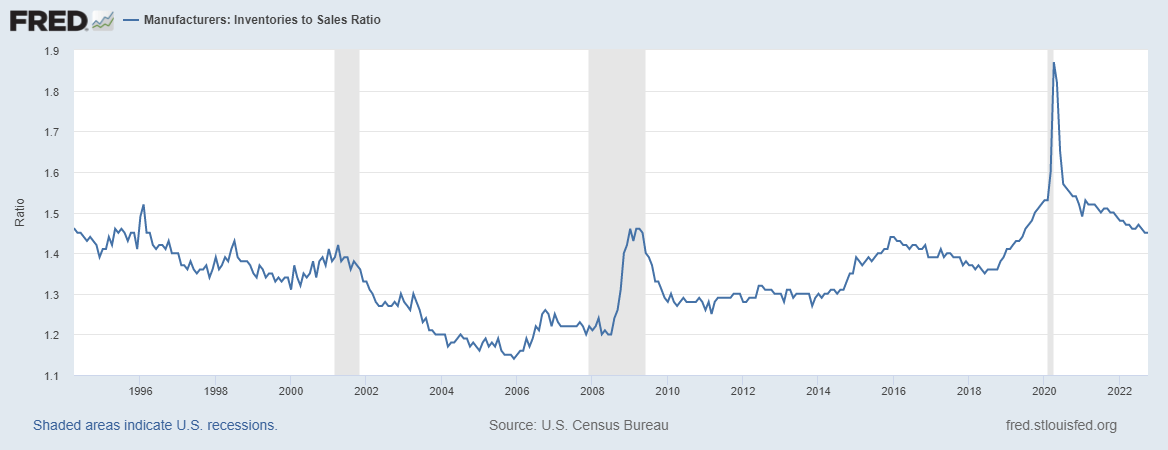
The Purchasing Managers Index (PMI) depicts the prevailing direction of manufacturing and economic activity on a month-over-month basis. In short, it summarizes whether market conditions, as viewed by purchasing managers (senior company executives), are improving, staying the same, or worsening. An index reading below 50 indicates a contraction in manufacturing as viewed by managers, and is considered a bearish sign. As shown below, the PMI has just recently declined below 50 and both times in recent memory a similar reading was given, an economic contraction occurred. As far as the PMI is concerned, another alarming sign is given.
S&P Global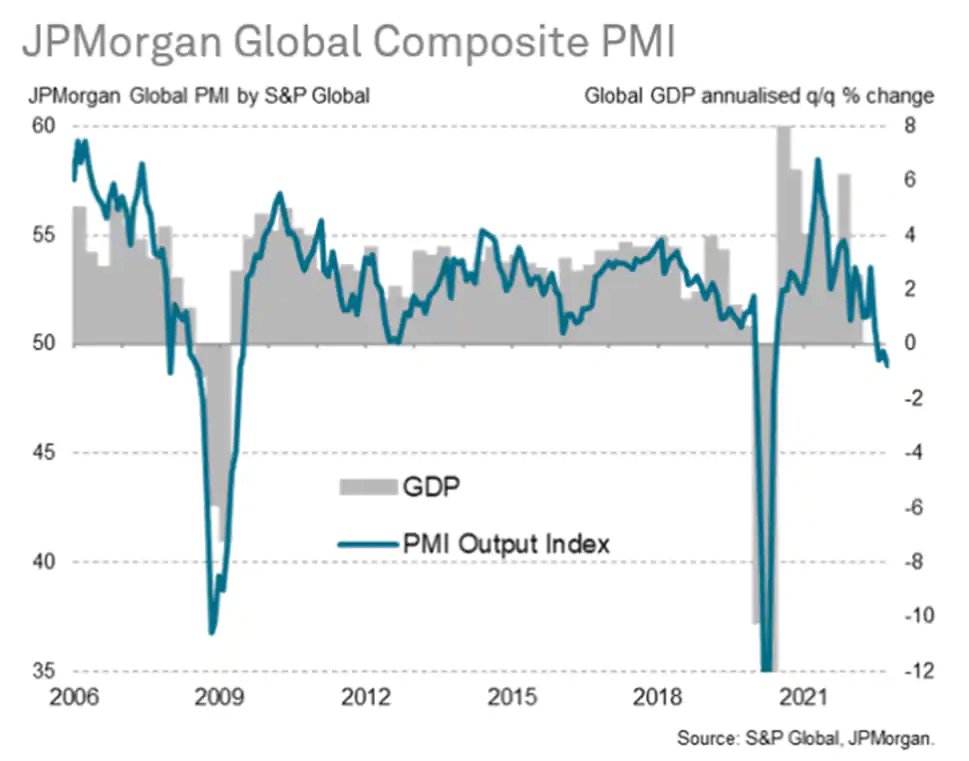
Sector Performance Comparison
In this segment, a more detailed industrials sector performance review is offered, with the help of J.P. Morgan Asset Management’s market outlook analytics. The data provided in the table below were published at the end of Q3 2022.
Currently, industrials hold a 7.9% weighting in the market-cap weighted S&P 500, while exhibiting a significant factor loading towards Value. In the small-cap space (Russell 2000), they cover a much larger portion of the market (14.8%). In my view, both the increased value and small-cap exposure should be considered beneficial in terms of performance over the mid-term, especially as small caps and Value have lagged over the past decade.
Since the 2020 market peak, industrials have gained a small 3.3%, in light of the 2022 drop, lagging most sectors. This, however, can be attributed to a serious set of challenges, including Covid-19 related production and supply chain disruptions, a global energy crisis, war in eastern Europe and inflation. It is hard to see, barring some unforeseen major geopolitical event, how the outlook for the next couple of years does not improve, even marginally.
The outlook is improved by reasonable valuation metrics across the sector. A 15.1x forward P/E is slightly lower long-term market and sector averages, when, even after the 2020 bear market, many sectors trade much higher. The sector’s dividend yield (2.2%) is slightly higher than the S&P 500 20-year average of 2.1%. Companies in the industrial sector are also more keen on share buybacks, increasing shareholders returns. The 20-year buyback yield for the sector stands at 2.2% compared to the markets 1.7%.
J.P. Morgan Asset Management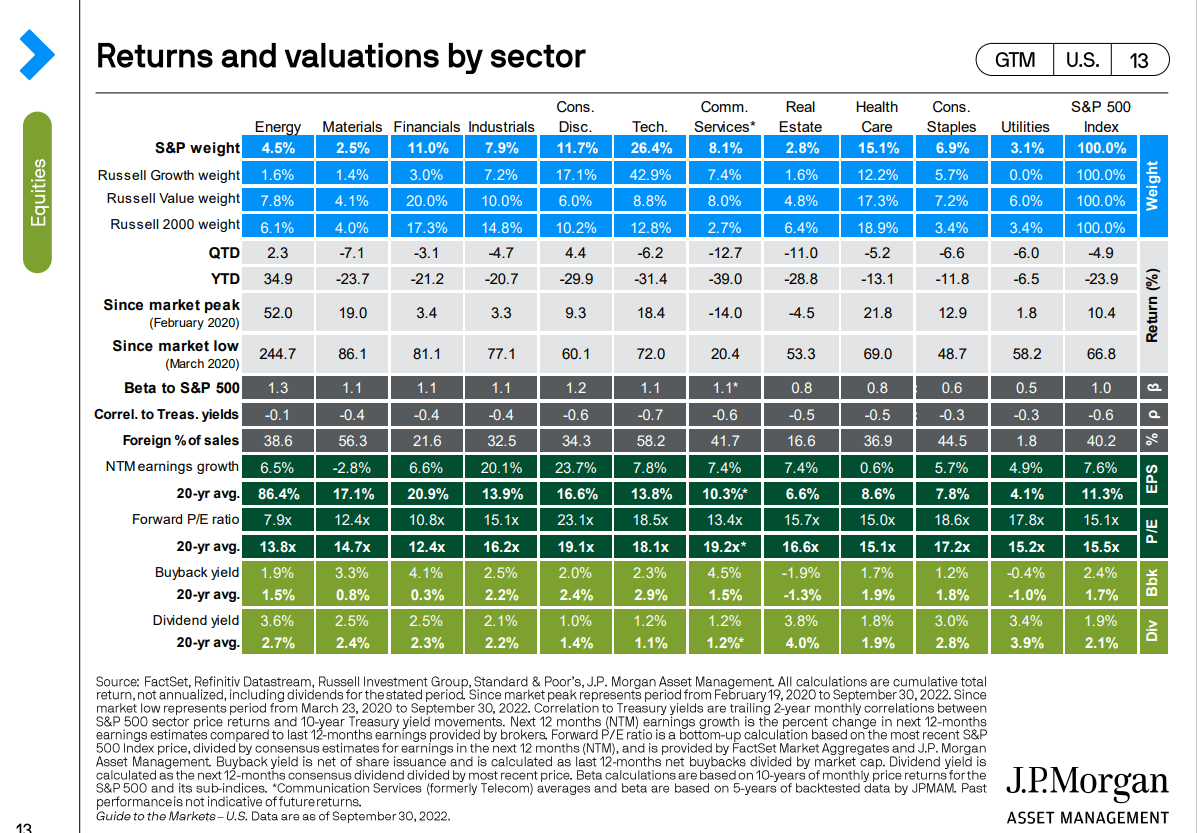
Final Thoughts
Uncertainty looms in the short term and medium term, and as far as the industrials sector is concerned, mixed signals in terms of both fundamentals and performance can be found. In my view, gaining more exposure towards industrials through a fund like IYJ currently provides more upside than downside potential heading into 2023.