iShares 3-7 Year Treasury Bond ETF: Finding Shelter In The Belly (IEI)
steinphoto
The recent Fed rate hike reaffirmed its commitment toward price stability despite concerns about the health of the banking system. With liquidity tools like the Bank Term Funding Program (BTFP) and the discount window already alleviating the stress from deposit outflows, the Fed’s stance seems warranted, and the rate hike runway likely remains intact. The market has taken a different view, however, pricing in sizeable rate cuts toward year-end. Given the strong employment growth numbers and persistent core inflationary pressures in recent months, I wouldn’t pencil in a pause just yet, let alone rate cuts. A further 25bps hike in May and no rate cuts this year would see a base case terminal rate of 5-5.25%, in contrast to the current 3-month and 6-month rates of <5%. Against this backdrop, expect the short end to come under the most pressure in the coming months as markets reprice a more hawkish Fed. With QT also set to pressure the long-end, exposure to the lower-beta belly via the iShares 3-7 Year Treasury Bond ETF (NASDAQ:IEI) screens most attractively for income at the current ~4% yield.
Fund Overview – Hassle-Free Exposure to Intermediate-Term Treasury Bonds
The US-listed iShares 3-7 Year Treasury Bond ETF seeks to track, before fees and expenses, the market value-weighted IDC US Treasury 3-7 Year Index, which measures the performance of fixed-rate securities between the three and seven-year term to maturity. The ETF held ~$12bn of net assets at the time of writing and charged a 0.15% expense ratio, making it a relatively cost-effective option for US investors looking for exposure to intermediate-term Treasury bonds (i.e., the ‘belly’ of the curve). A summary of key facts about the ETF is listed in the graphic below:
iShares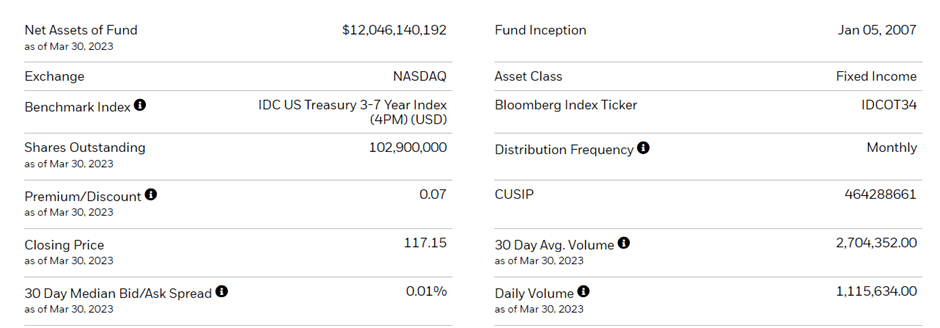
The fund is spread across 62 Treasury holdings, with the largest allocation going to 3-5 Year Treasuries at 52.8%, followed by 5-7 Year Treasuries at 44.9% and 2-3 Year Treasuries at 2.3%. As the issuer is the government, these are considered AAA-rated with no credit risk, leaving investors exposed only to duration risk. The weighted average and effective maturities stand at 4.75 and 4.41 years, respectively.
iShares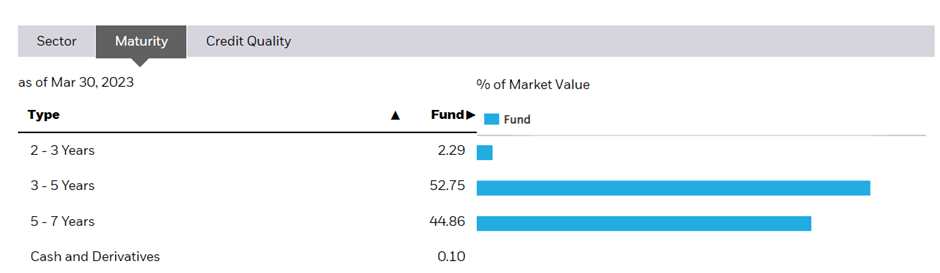
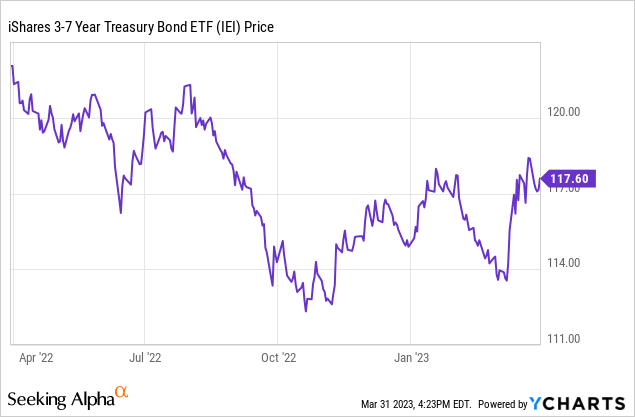
On a YTD basis, the ETF has risen by 1.8% and has annualized at 2.7% in market price and NAV terms since its inception in 2007. Given the higher duration at the 3-7-year maturities, the fund has seen a relatively sharp drawdown at ~10% amid last year’s rate hikes, though returns have generally been stable in ‘normalized’ years. The monthly distribution is an added bonus, with the trailing 30-day yield largely tracking the average yield to maturity at 3.8%.
iShares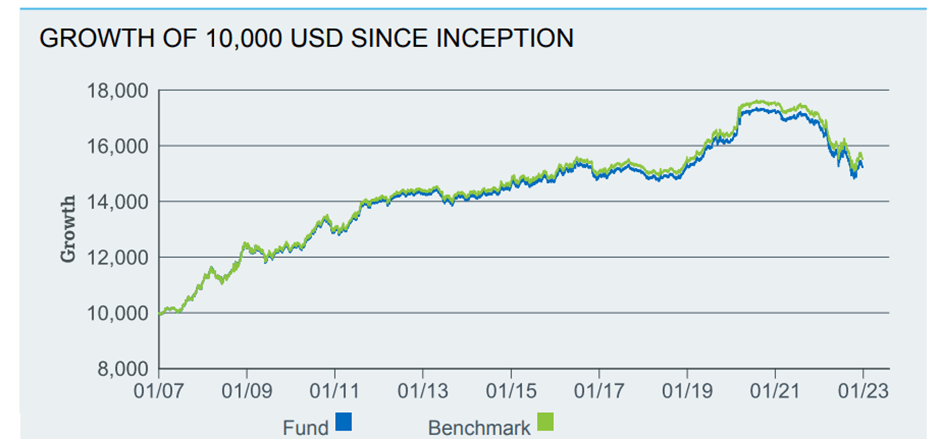
Aggressive UST Repricing Amid Recession Concerns
In contrast with the Fed’s latest 25bps rate hike, the market appears to have gained conviction in a rapid monetary easing scenario, pricing in a series of rate cuts before year-end. The implied peak based on swap market pricing is currently at 4.75-5% in June, after which 50bps of rate cuts are anticipated into the back half of this year. This represents a significant divergence from Fed guidance, which pegs peak rates at 5-5.25%, with Fed Chair Powell citing no rate cuts this year. This widening delta post-repricing may be a case of too far too fast, leaving the front end vulnerable over the coming months.
Bloomberg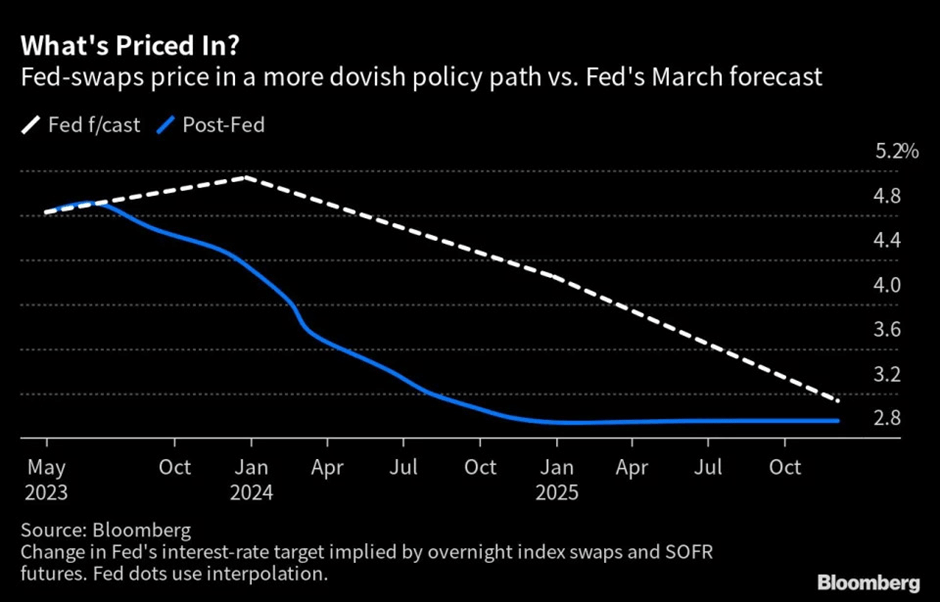
That said, the possibility of an economic downside scenario cannot be ruled out, and depending on the depth of the slowdown or recession, the US Treasury (‘UST’) curve steepening could further extend. But betting on a recession here doesn’t offer very good odds, with the market already pricing in a high probability of a sudden economic shock that will warrant easing. Plus, inflationary pressures have been more ‘sticky’ than expected, which will limit the Fed’s easing runway. In a more likely ‘soft landing’ scenario where the credit tightening impact is contained, and a recession turns out to be shallower than anticipated, expect USTs to be vulnerable to a significant reversal at the short end. Against this backdrop, I would favor exposure to the belly of the curve for income, given it hasn’t been repriced as aggressively post-meeting.
Continued Pressure from QT
In the meantime, the Fed hasn’t outlined any plans to pause its balance sheet reduction via ‘quantitative tightening’ or QT, which could weigh on liquidity conditions for US Treasuries going forward. Thus far, the impact of QT has been largely neutral – since the start of QT, the Fed has shrunk its UST portfolio by >$300bn, and the incremental supply has been adequately absorbed by foreign and private domestic investor demand (individuals and pension funds). Barring further stress in the banking sector, the Fed should have no issue continuing its $95bn/month run rate (mostly Treasuries). Most of the pressure is likely to be at the long end, given the Fed’s UST holdings skew toward the >5-year maturities. IEI, which primarily targets the belly, seems like the safer option here for income investors, given its <5-year weighted average maturity limits the relative impact of QT-related downside pressure.
Federal Reserve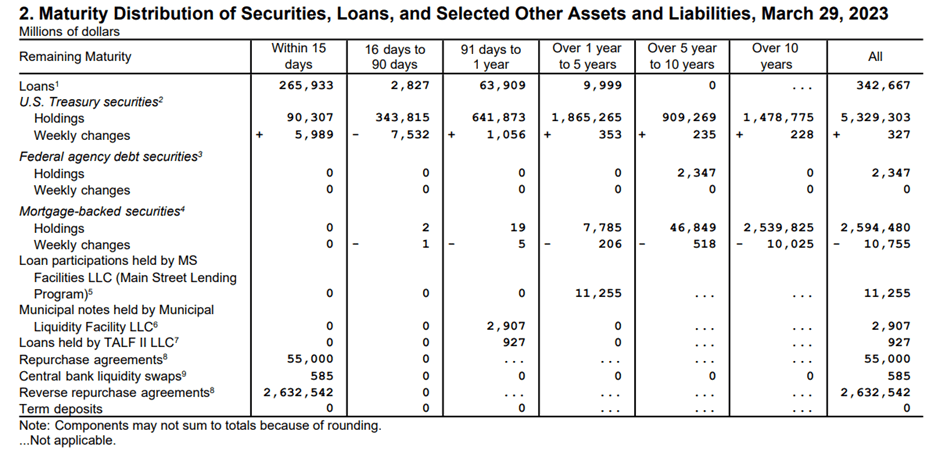
Finding Shelter in the Belly
Despite the Fed emphasizing at its recent policy meeting that it remains committed to price stability and will adhere to a separation principle to address financial stability risks via liquidity tools, the market continues to price in sizeable rate cuts this year. For now, another round of tightening looks to be on the cards in May, which should take rates into the 5.0-5.25% range. And with the ~$95bn QT run rate (mostly Treasuries) yet to run its course, rate cuts seem unlikely until 2024 at the earliest. In the near term, expect USTs to come under pressure as the curve reprices in line with the Fed’s interest rate projections, particularly at the very short end of the curve. For investors looking to avoid potential volatility at the front and long end, gaining exposure to the belly of the curve via the iShares 3-7 Year Treasury Bond ETF presents a lower-beta income option.