Intel’s Rebound: Technical And Fundamental Signs (NASDAQ:INTC)
4kodiak
Thesis
Intel (NASDAQ:INTC) has been plagued by both lackluster results and share prices lately. The business has been suffering from both its own issues and a macroeconomic slowdown. The technological lag of its products, the heavy investment involved in its IFS initiatives, the supply-chain challenges, and the inflationary pressures all plagued results and eroded margins. It is also worth noting that company-specific execution issues hurt profitability as well.
Against this backdrop, the thesis of this article is to show that the stock recently showed strong signs, both technical and fundamental, of having bottomed in Q3. As you can see from the following chart below, its stock prices staged a 20% rally since touching a bottom of $24.5 in mid-October. More importantly, on several trading days (highlighted by the orange arrows), the strong rallies were on large volumes too, a classical technical rebounding sign.
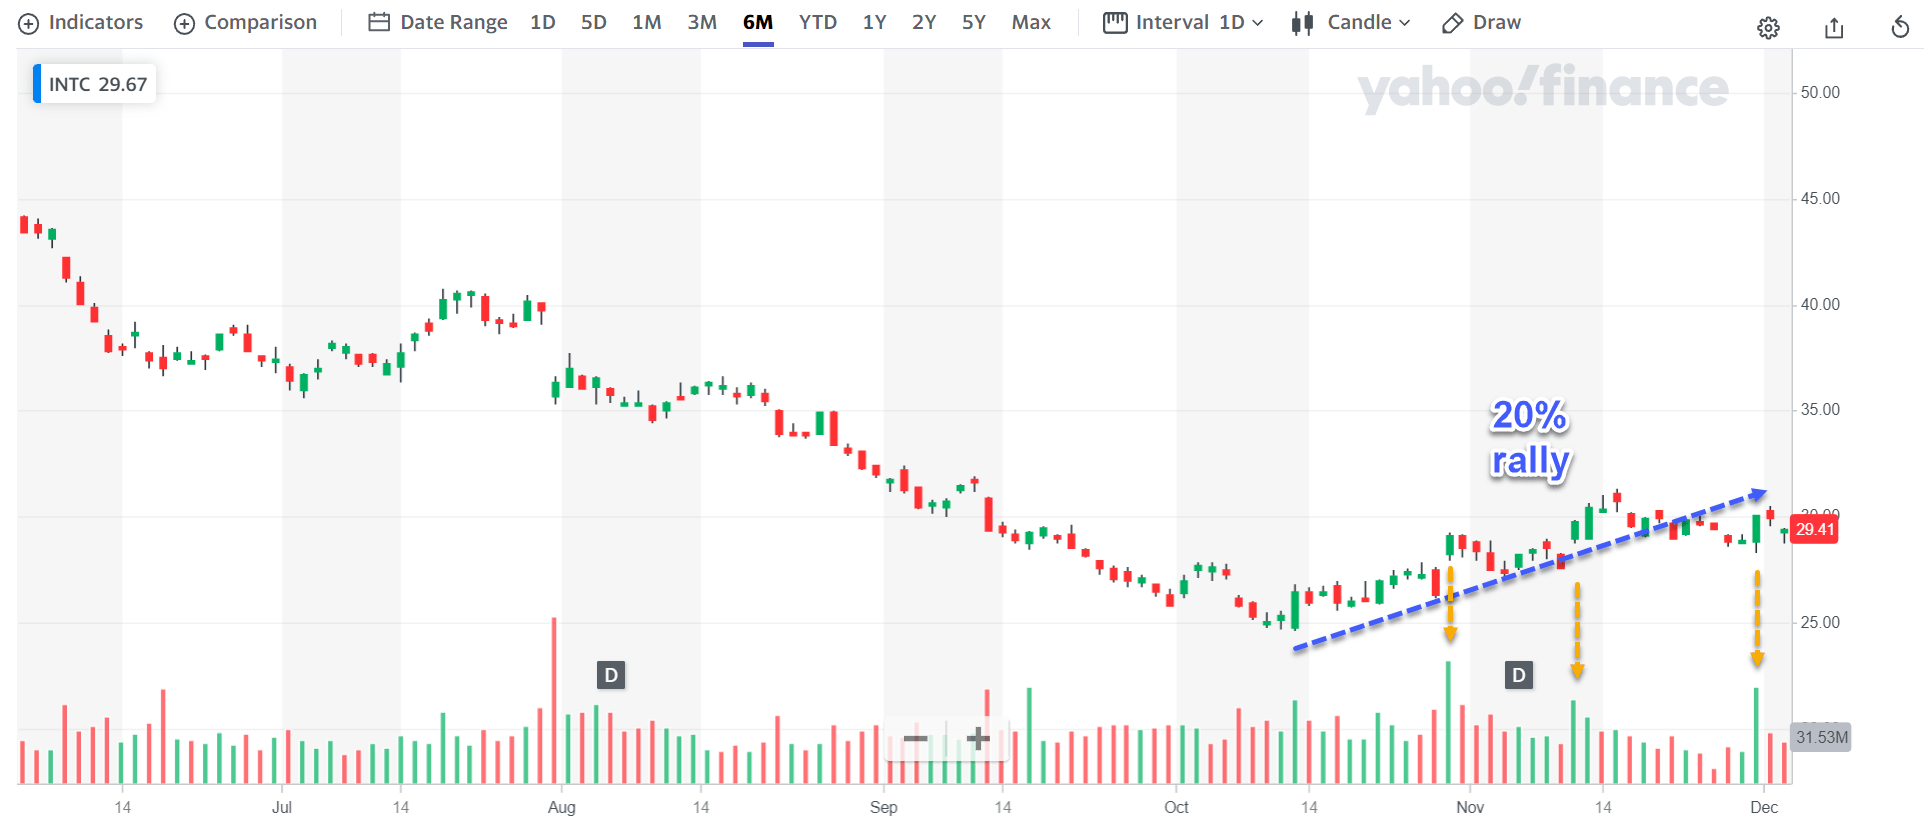
Source: author based on Yahoo Finance data.
For investors with a longer-term time frame, the so-called Point & Figure Chart (“PFC”) is more helpful. If you are interested, this tutorial provides the basics for reading PFC. The essence of the PFC is to filter out much of the daily noises so the long-term trend is displayed more clearly. Now back to INTC, a few highlights from this chart:
- The PFC below displays ~3 years’ worth of INTC’s price and volume information (2019~2022). The red Os show price declines and the black Xs show price advance. Hence, you can clearly view the direction and trading volume over a longer timeframe and obtain an overall sense of the dominating market forces.
- To wit, during August and September, INTC suffered the worst selloff in years. A total of 2.1 billion shares changed hands during these two months (about 50% of outstanding shares) on a price decline from $39.3 to $26.0 (i.e., a decline of more than 1/3), and the volume quieted down substantially afterward (a technical sign of exhaustion).
- Then the trading in October and November is more dominated by volumes on rising stock prices as highlighted by the orange arrows, a classical technical sign for rebounding.
The PFC is a very handy tool for long-term investors – a bridge between technical analysis and fundamental analysis in my mind. And that is what we will explore next – the implications of these trading patterns in terms of its business fundamentals.
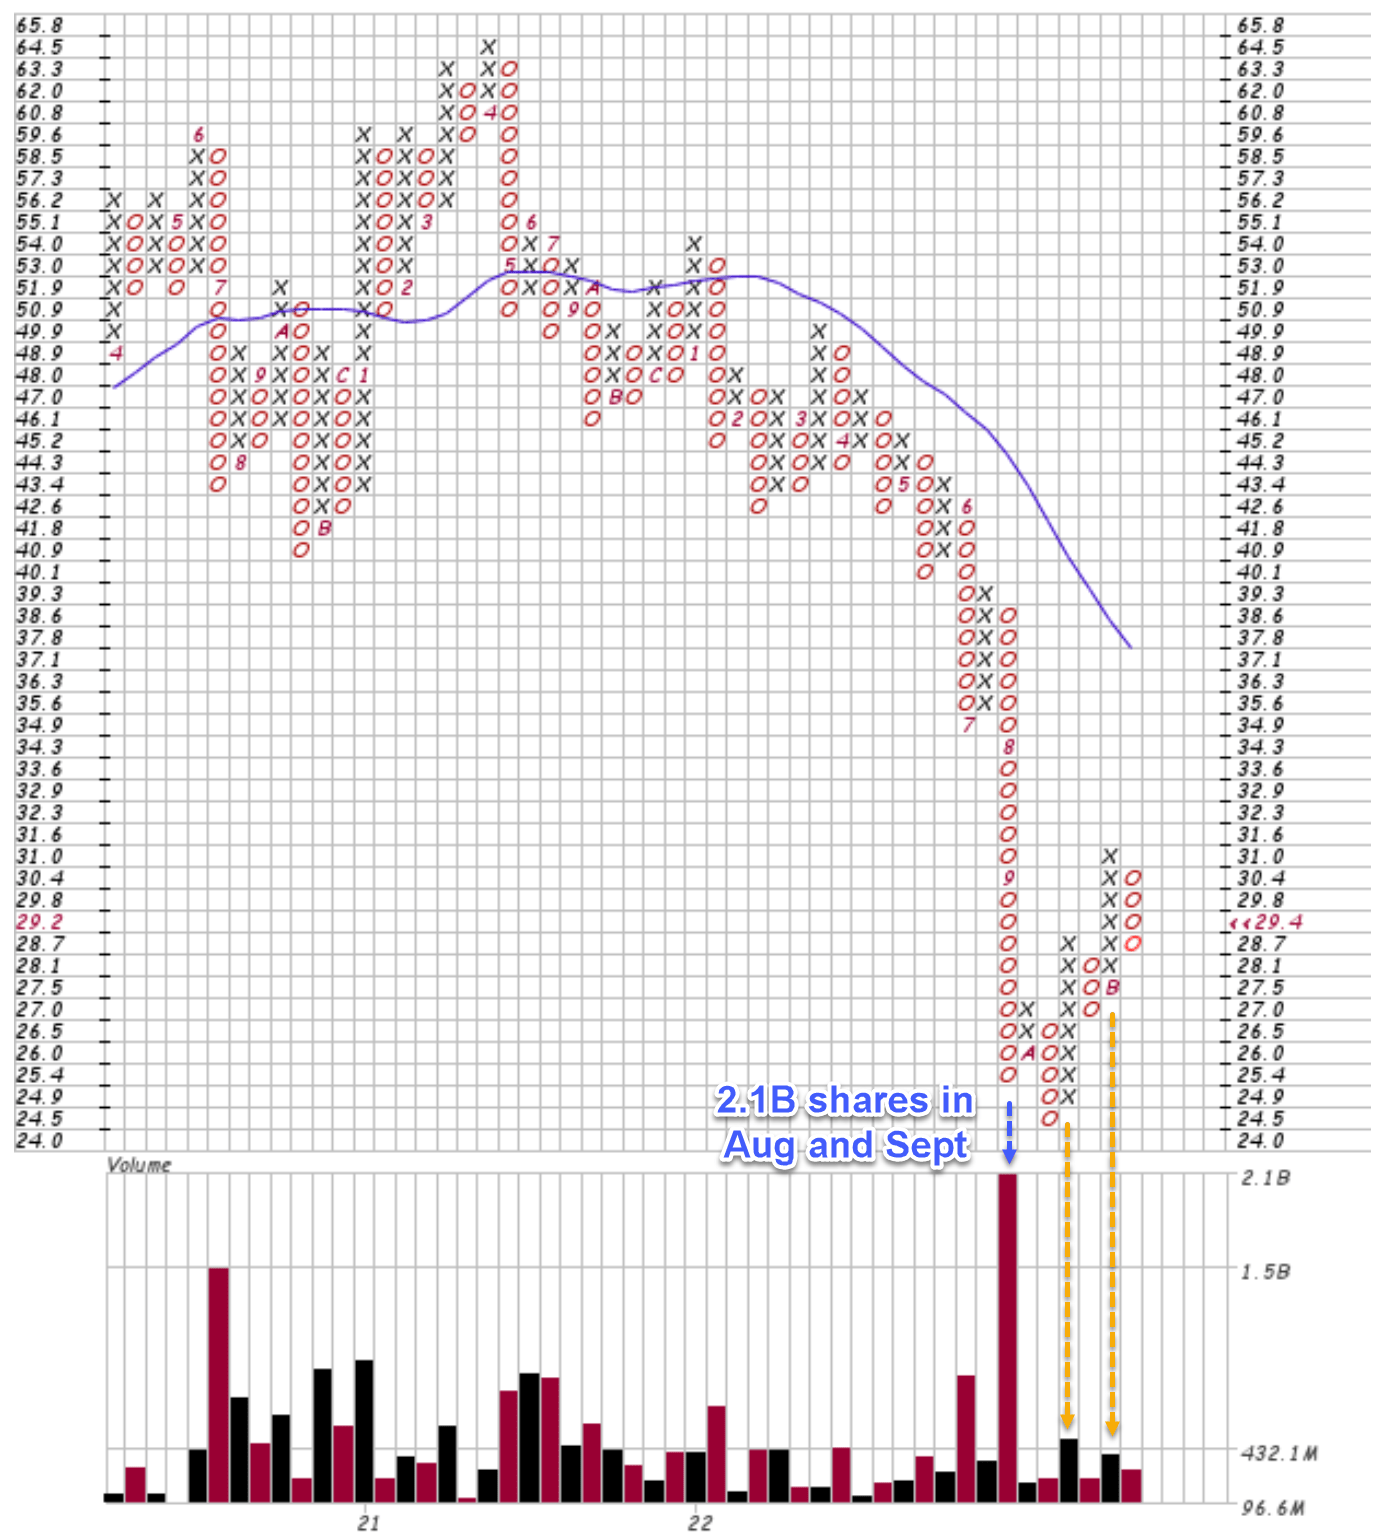
Source: author based on stockcharts.com data.
Valuation Implications
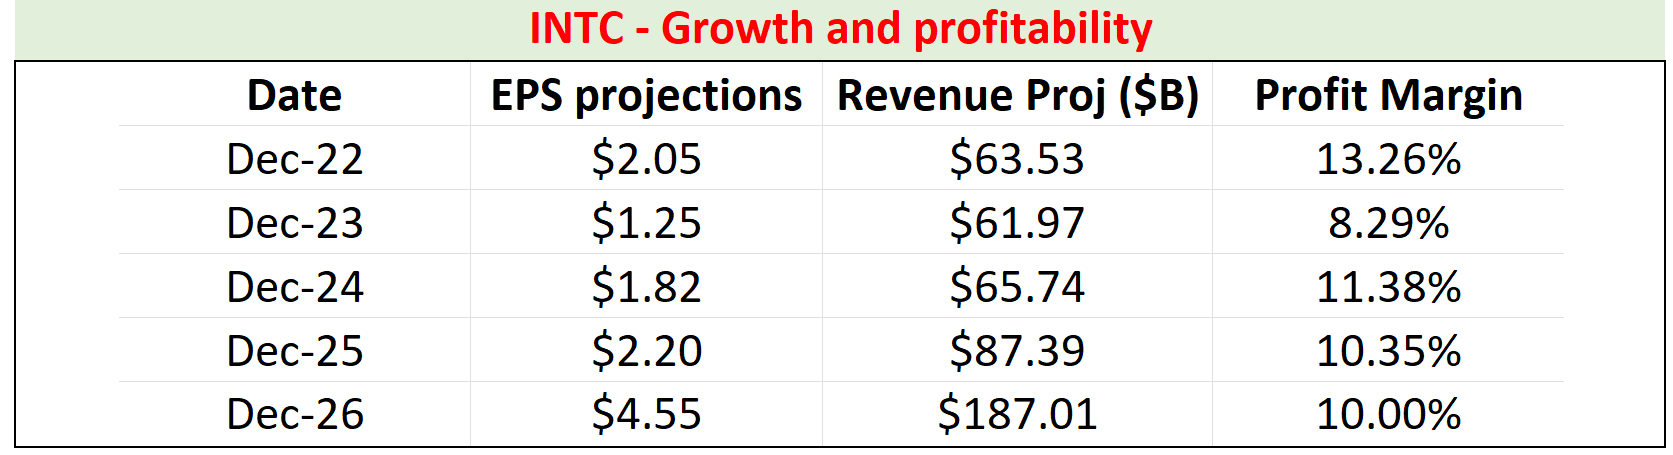
As just mentioned above, the trading in October and November is more dominated by volumes on rising stock prices in a range between about $24.5 and $31.0. The table below shows the valuation for INTC within this range. The EPS projections are taken from the SA consensus estimates. As seen, the consensus estimates project its EPS to contract to $1.25 next year and recover to $4.55 in 2026. All told, the implied PEs in this price range are in the mid to low teens except for 2023. And I view such valuations as very reasonable for the growth potential and quality of the stock. Then in 2026, the time when its IFS is expected to be fully online, the implied PE would drop to the single digits, between a range of 5.4x to 6.8x, illustrating the outsized upside return potential.
And next, I will argue that these EPS projections are too conservative because of the extremely pessimistic margin assumptions embed in the consensus estimates.
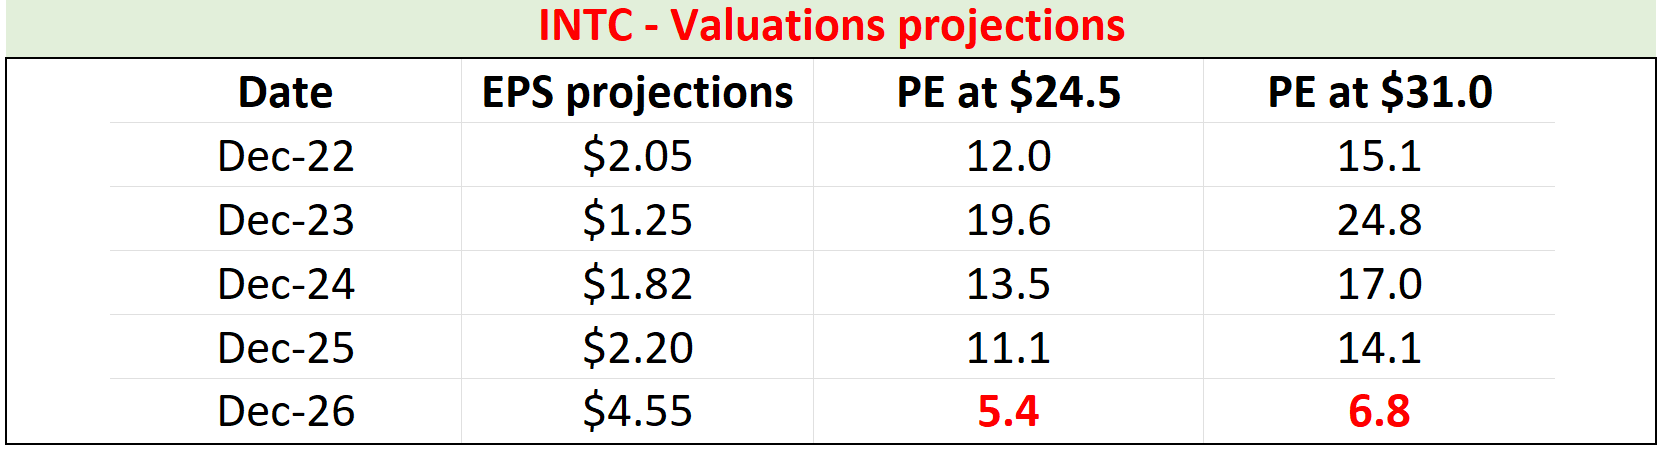
Source: author based on Seeking Alpha data.
Growth and margin projections
The chart below shows the consensus estimates of its revenues too. As seen, the consensus estimates project its revenues to decline to $61.9B in 2023, then gradually recover, and finally be followed by a sudden expansion in 2026 again because of the IFS. Assuming its share counts remain at the current level of 4.11B, I computed its total profit based on the EPS projections so I can obtain the implied margins, which are shown in the 4th column. As you can see, the consensus estimates implied a profit margin hovering around an average of 10% in the next few years.
Source: author based on Seeking Alpha data.
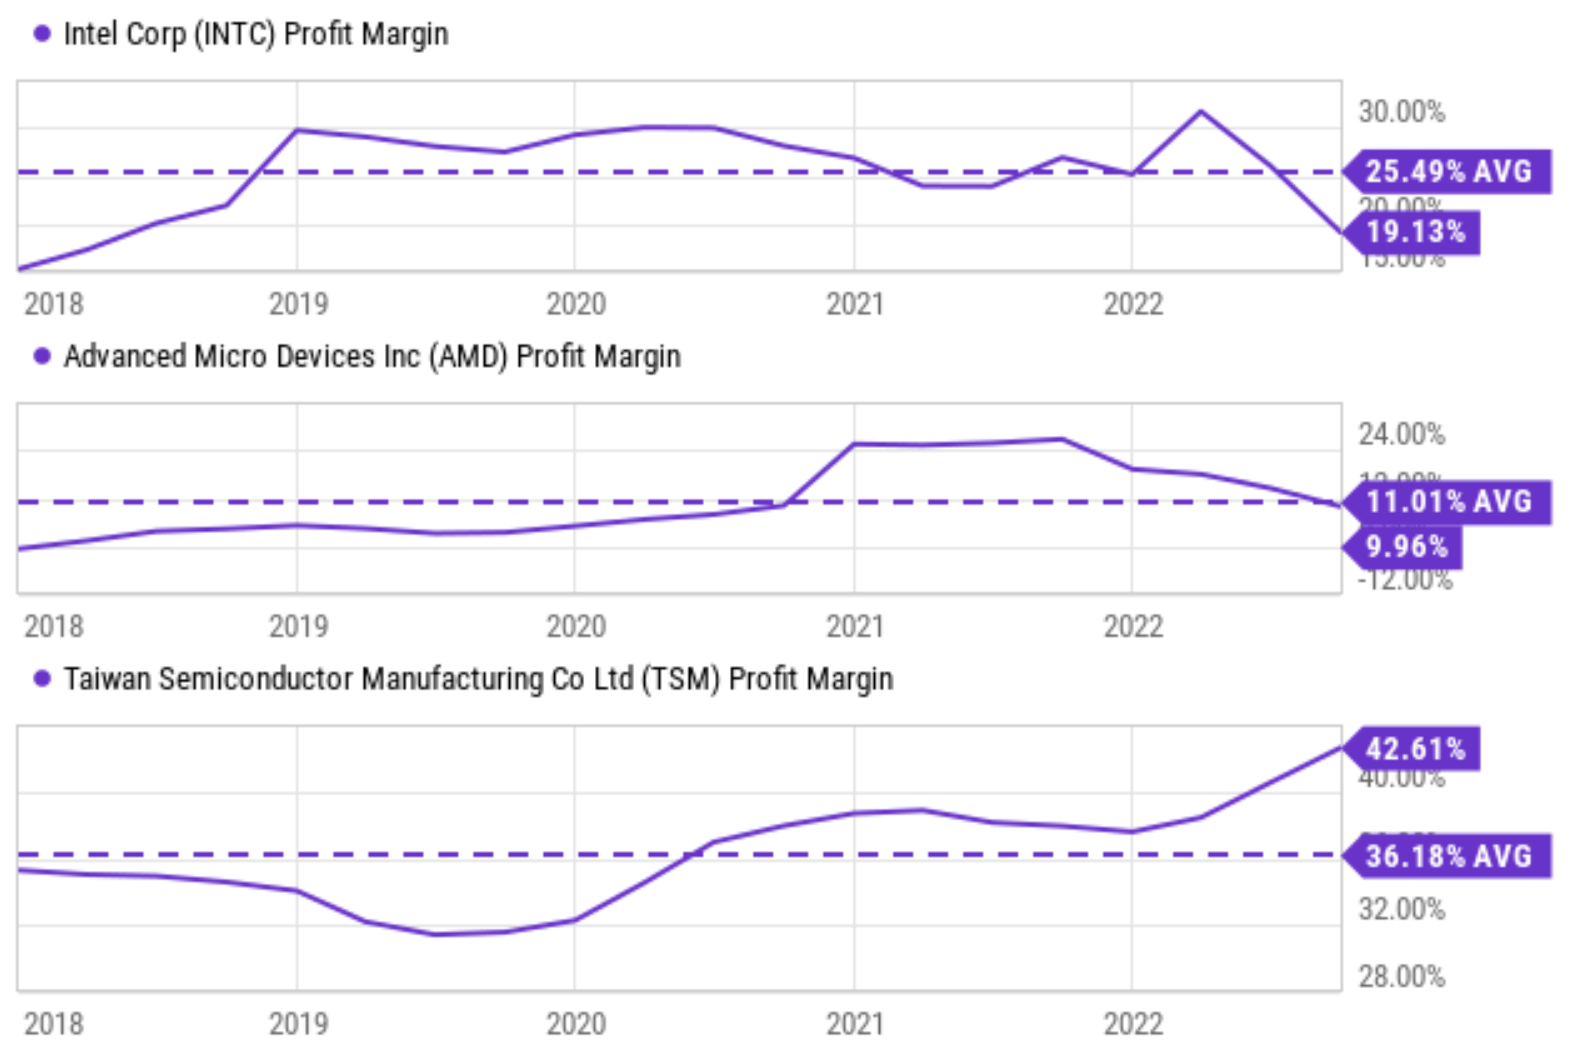
Such an implied margin is too pessimistic in my mind based on its historical record and also its peers’ profit margins (“PM”). The chart below shows its PM in the past 5 years together with those from Advanced Micro Devices (AMD) and Taiwan Semiconductor (TSM). As seen in the top panel, INTC’s PM has been on average 25.5%. Its current PM of 19.1% is admittedly far below its historical average due to the various headwinds we mentioned above. However, it is almost double the 10% level consensus estimates implied. The mid panel shows that AMD’s average PM is about 10%, and TSM’s average PM is about 36%. Considering that A) AMD is a pure chip designer, B) TSM is a pure chip manufacturer, and C) Intel is going to be a hybrid, I think it’s logical to expect Intel’s PM to be some sort of weighted average of the PM of AMD and TSM, which would put it above the implied 10% also.
Source: Seeking Alpha data.
Risks and final thoughts
To recap, INTC has been plagued by a multitude of issues, ranging from macroeconomic factors to company-specific execution issues. As a result, almost of all its segments (the Client Computing Group, Data Center and AI Group, and Intel Foundry Services) suffered profit declines on a YoY basis. Looking forward, some of these issues may persist longer, such as the technological catch-up of its products, the heavy investment involved in its IFS initiatives, the supply-chain challenges, and also inflationary pressures.
However, I see strong signs, both technical and fundamental signs, that the stock has bottomed in Q3 at a price near $25. Going forward (baring a full-scale economic recession), I see the supply-chain challenges, the inflationary pressures, and also global PC slowdown have already passed their worst. In terms of its IFS CAPEX requirements, I expect a help of around $4B from EU and Brookfield Asset Management contribution in CY22 alone. Then I also expect substantial subsidies from the US CHIPS Act funding in CY23, further easing its CAPEX requirement.
Considering these developments, its valuation is too compressed to ignore. Its PE is only in the single digits (5.4x to 6.8x) once its IFS becomes online even under extremely pessimistic margin assumptions implied by the consensus estimates. These implied profit margins are on average only about 10%, while I think its profit margin should be at least 20% on average considering its historical record and peers’ profitability.