Installed Building Products Stock: Finally Looking Attractive (NYSE:IBP)
Fokusiert/iStock via Getty Images
Sometimes, when you find a quality company that looks a bit pricey, the best option is to sit by the sidelines and wait for shares to get cheaper. Often, this will result in a missed opportunity. But when it does work, it can allow you to buy shares of the company in question at a substantial discount to what they were trading for previously. A great example of this can be seen by looking at Installed Building Products (NYSE:IBP). This company, which installs insulation for residential and commercial builders throughout the continental US, and that provides a portfolio of other infrastructure-related goods and services, has taken a bit of a beating in recent months. This comes even at a time when the fundamental condition of the company continues to improve. While investors are right to be concerned about the economy more broadly and the fact that this could hit the business in the near term, those focused on the long haul will likely find the company an appealing opportunity right now. Ultimately, I have taken this chance to increase my rating on the company from a ‘hold’ to a ‘buy’.
Now’s the time to be excited
Back in February of this year, I wrote an article detailing my thoughts on Installed Building Products. In that article, I said that the company had a history of attractive and consistent growth. I was impressed by the quality of the operation and I said that its long-term prospects are very likely positive. Having said that, I viewed the company at that time as being more or less fairly valued because of how pricey shares were. When I rate a company a ‘hold’ like I did then, it is my opinion that shares will generally perform at a level that matches the broader market. Since then, the company has not been far off from this. While the S&P 500 has dropped by 15.4%, shares of Installed Building Products declined by 17.4%.
Author – SEC EDGAR Data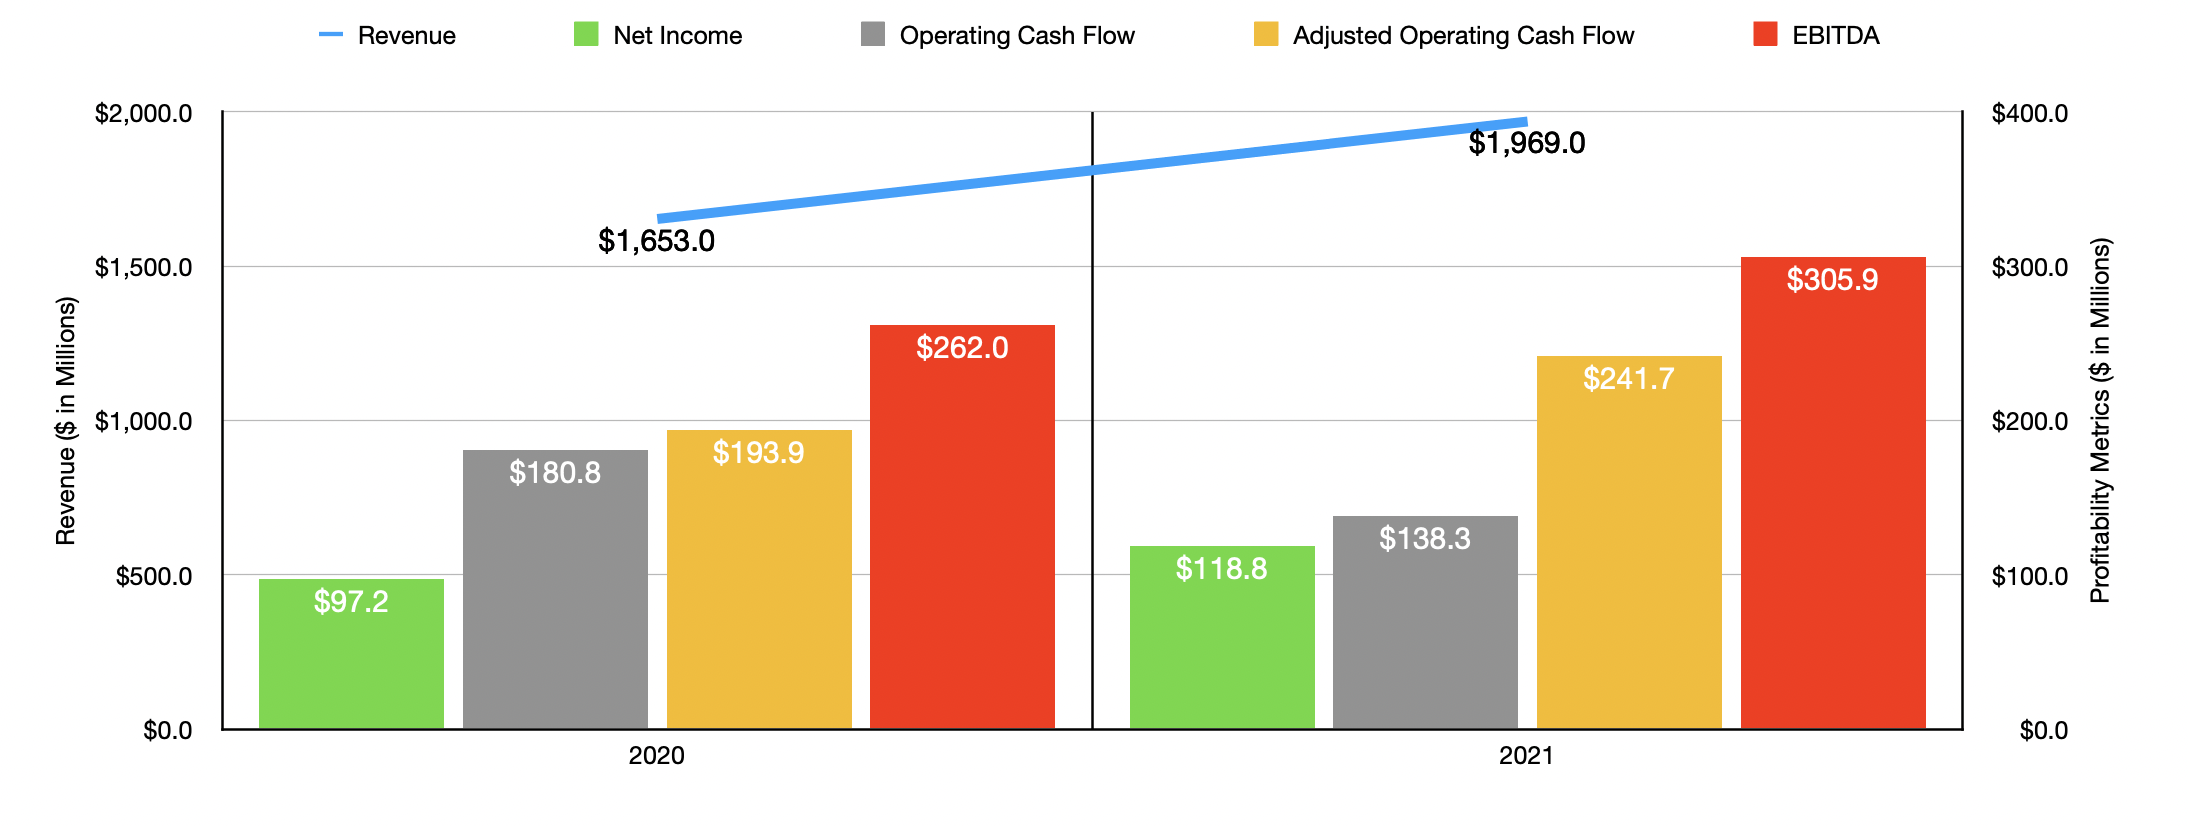
Even though the share price situation for investors has not been ideal in these past few months, the fact of the matter is that the fundamental performance of the company remains stronger than ever. When I last wrote about the company, we only had data covering through the third quarter of its 2021 fiscal year. We now have data covering through the first quarter of this year. For the 2021 fiscal year as a whole, the business ended up generating revenue of $1.97 billion. This represents an increase of 19.1% over the $1.65 billion generated during the company’s 2020 fiscal year. Growth was particularly strong in the final quarter of the year, with sales jumping by 21.1% year over year, rising from $441 million to $534 million. For the year as a whole, management attributed this to a number of factors. In particular, the company benefited from a 20.7% rise in residential sales growth. Commercial sales growth came in at 10.2%. Volume growth for same-branch locations came in at 7.7%, while increased price and product mix contributed 3.2% to the company’s top line.
On the bottom line, strength has also been impressive. Net income of $118.8 million represented a year-over-year increase of 22.2% over the $97.2 million reported for the 2020 fiscal year. What this indicates is that management was able to effectively push increased costs onto its customers. This shows up in other data points as well. Even though operating cash flow for the company declined year over year, dropping from $180.8 million to $138.3 million, if you adjust for changes in working capital, the picture looks different. On this basis, the cash flow for the company grew from $193.9 million to $241.7 million. Even EBITDA improved, rising from $262 million in 2020 to $305.9 million last year.
Author – SEC EDGAR Data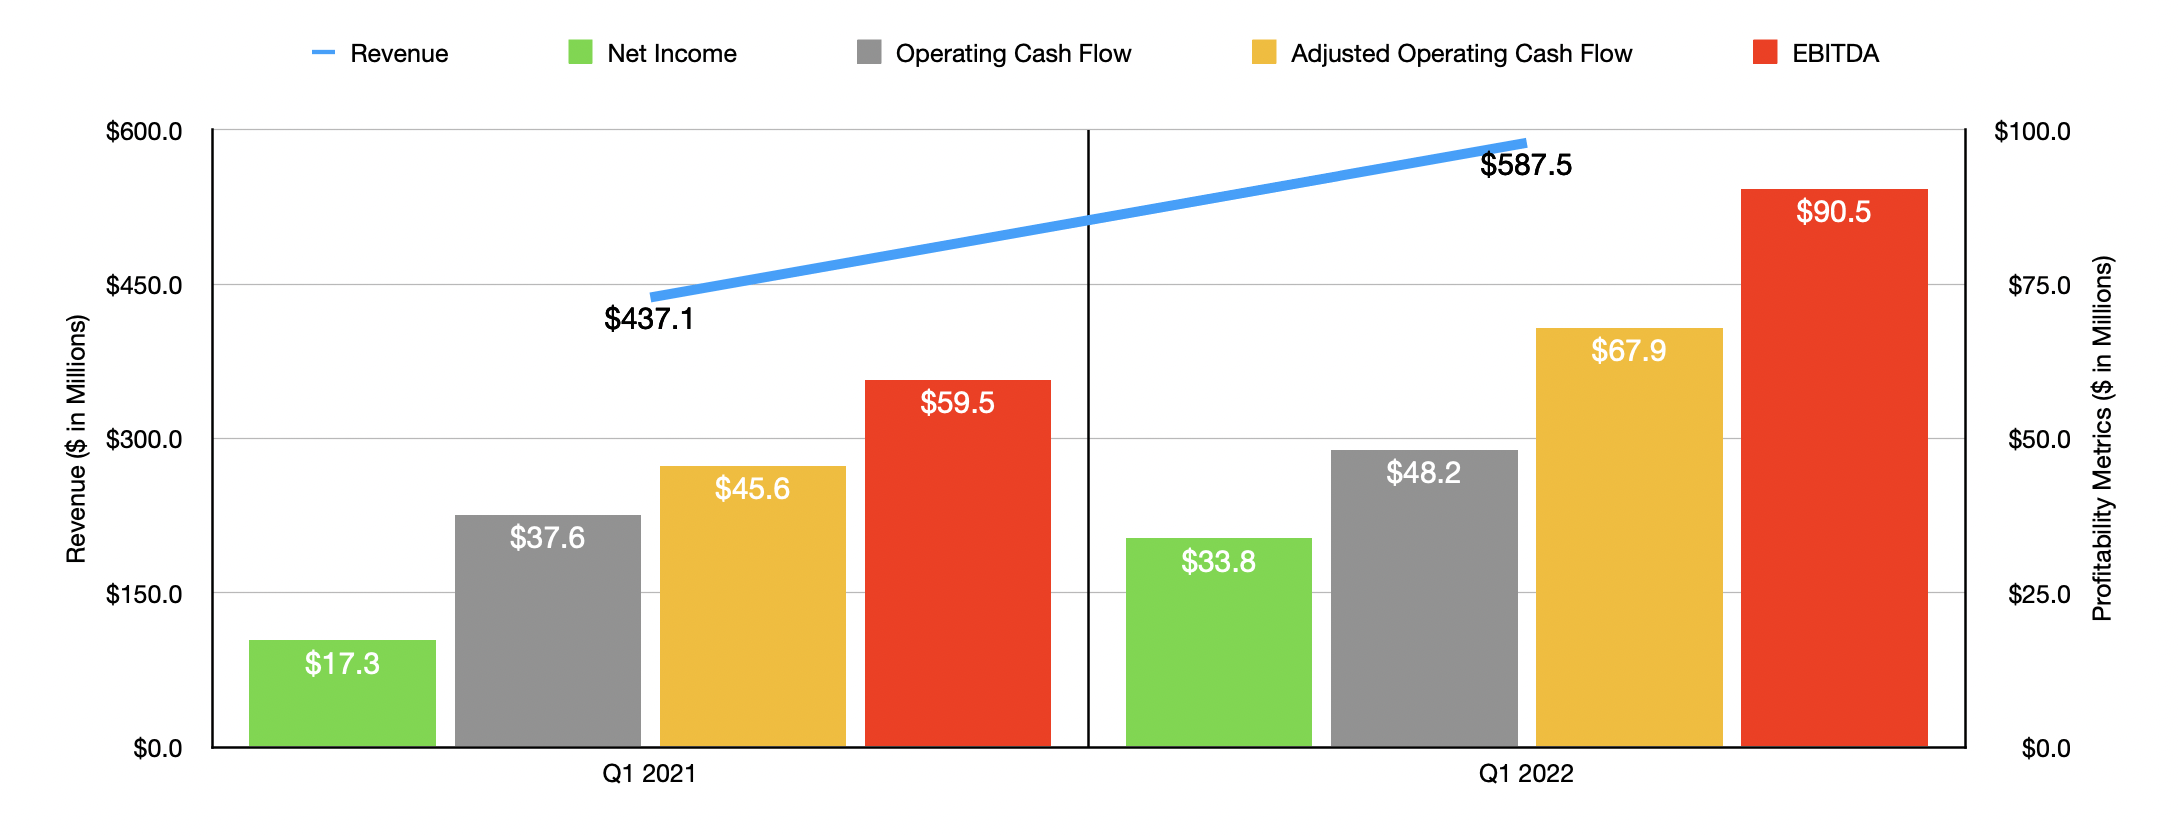
Obviously, we should also pay attention to more recent data. For the first quarter of the company’s 2022 fiscal year, revenue came in at $587.5 million. This represents an improvement of 34.4% over the $437.1 million the company generated the same time one year earlier. Residential sales growth was an astounding 35.2%, with single-family sales growth coming in at 37.4% year over year. At same-branch locations, volume growth was 9.7%, while price and product mix contributed 14.6% to the company’s top line. This came even at a time when total housing completions dropped by 5.5% and as multifamily completions declined by 17.3%. Management does expect acquisitions to play a role in any top line growth it experiences this year. So far in 2022, the company has made acquisitions of assets that will add $68 million in annualized revenue to it. Their ultimate goal is to increase this number to $100 million.
Despite some of the difficulties in this space, management was still successful in generating strong profits. Net income in the latest quarter totaled $33.8 million. That stacks up against the $17.3 million generated the same quarter one year earlier. Operating cash flow rose from $37.6 million in the first quarter of 2021 to $48.2 million the same time this year. Adjusted for changes in working capital, it would have grown from $45.6 million to $67.9 million. Meanwhile, EBITDA increased from $59.5 million to $90.5 million.
Author – SEC EDGAR Data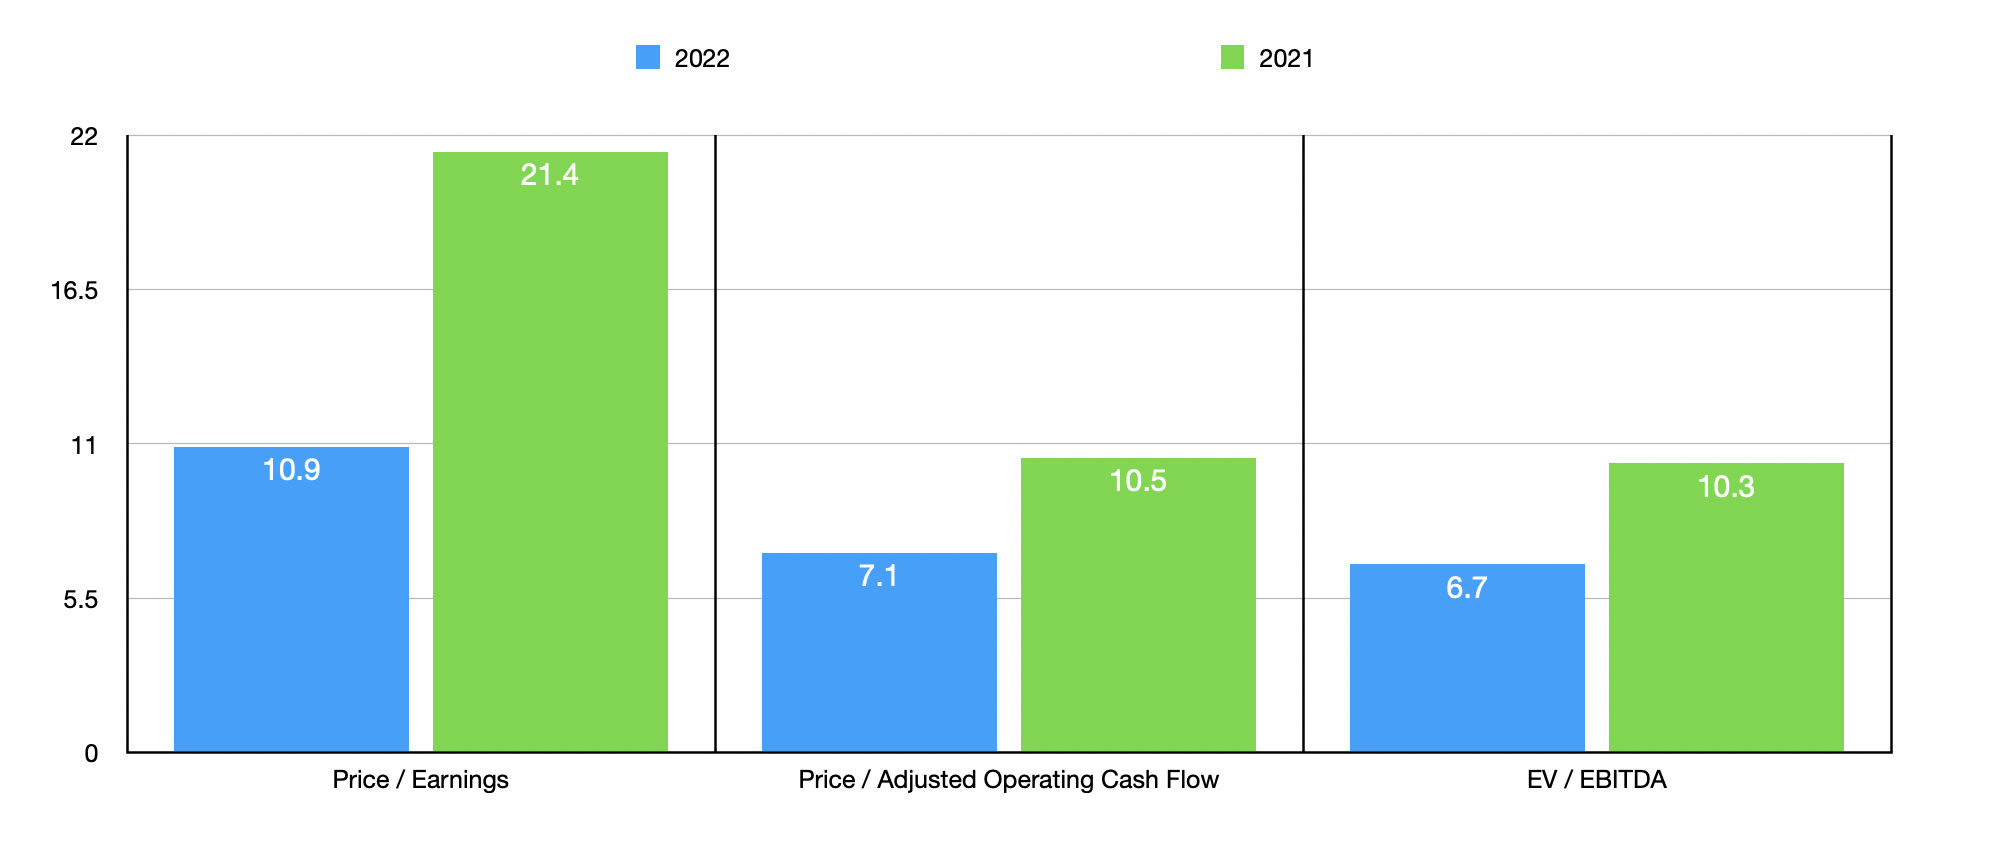
The company has not provided any real guidance for the current fiscal year. But if we annualize results seen so far, we should anticipate net income of $232.1 million, adjusted operating cash flow of $359.9 million, and EBITDA of $465.3 million. Using this data, we can easily value the business. On a price-to-earnings basis, using the forward estimates, the firm is trading at a multiple of 10.9. This compares to the 21.4 reading that we get using our 2021 results. The price to adjusted operating cash flow multiple should be 7.1. That’s down from the 10.5 reading that we get if we use our 2021 figures. When it comes to the EV to EBITDA approach, we get a reading of 6.7. That compares to the 10.3 that we get if we use our 2021 figures.
To put the pricing of the company into perspective, I decided to compare it to five similar firms. On a price-to-earnings basis, these companies ranged from a low of 10.5 to a high of 25.6. Four of the five firms were cheaper than Installed Building Products. Using the price to operating cash flow approach, the range was from 14.3 to 75.3. In this case, our prospect was the cheapest of the group. When it comes to the EV to EBITDA approach, the range was from 7.6 to 14.2. In this scenario, three of the five were cheaper than our target.
| Company | Price / Earnings | Price / Operating Cash Flow | EV / EBITDA |
| Installed Building Products | 21.4 | 10.5 | 10.3 |
| Masonite International Corporation (DOOR) | 16.5 | 14.3 | 8.0 |
| CSW Industrials (CSWI) | 25.6 | 24.0 | 14.2 |
| Griffon Corp (GFF) | 13.1 | 75.3 | 12.6 |
| JELD-WEN Holding (JELD) | 10.5 | 27.0 | 7.6 |
| Gibraltar Industries (ROCK) | 16.9 | 71.2 | 9.5 |
Takeaway
Relative to similar firms, Installed Building Products looks to be more or less fairly valued. But the data we are seeing so far is highly promising. If management can achieve the numbers I calculated, the company could offer significant upside. But even if it doesn’t, shares are cheap enough now from a cash flow perspective to offer some upside that is worth going after for those so inclined. Near-term, we could see some additional pain. But for those focused on buying a quality company at an attractive price and who are in it for the long haul, now is definitely a time to consider picking up a stake in the business.