Health Care Select Sector SPDR Option Strategy: Selling That Put Skew (NYSEARCA:XLV)
Torsten Asmus
Intro
When selling option premium over a timeframe of let’s say two months, it is all about trying to ascertain where a respective underlying will trade over the short term. In fact, because we take off our positions well before expiration, it essentially boils down to the upcoming four weeks and where the underlying will trade in this timeframe.
Suffice it to say, if we take a chart of the Health Care Select Sector SPDR fund (NYSEARCA:XLV) (taking into account that a strong up-move preceded the consolidation we have seen since mid-2021), we can see that through strong momentum, shares seem to have found a short-term bottom. We state this because the move above the fund’s 10-day moving average has coincided with a positive reading in the money flow index. We should now get a least a move up to the fund’s 200-day (just above $130 a share) moving average, with the ETF’s August highs being the next resistance point after this. Given that there is far more short-term overhead resistance compared to downside support, it was encouraging to see XLV successfully testing its 2021 June lows in late September this year. This gives us short-term support at just under $120 a share.
XLV Technical Chart (Support & Resistance) (Stockcharts.com)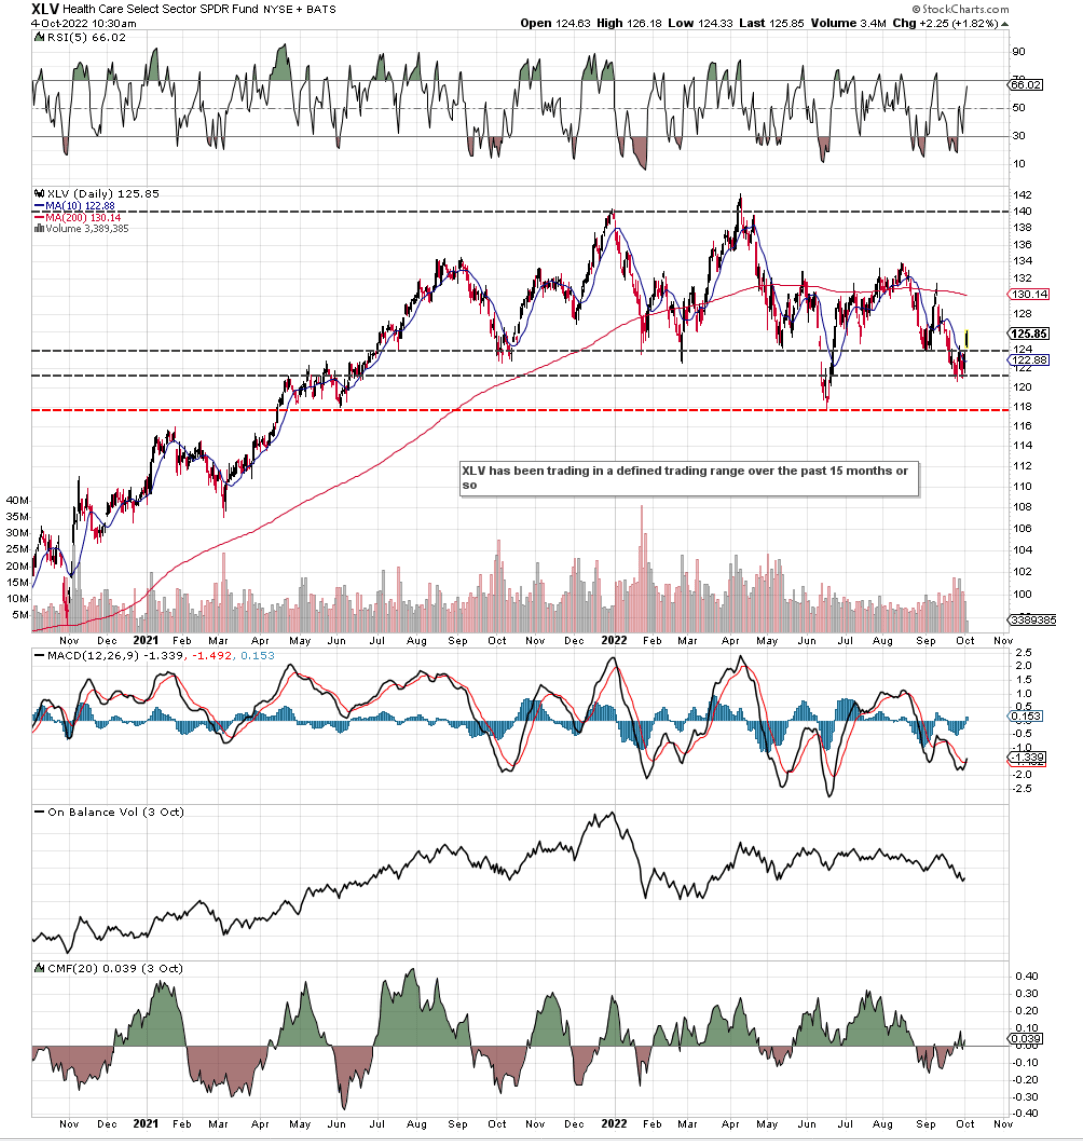
This preliminary work before getting into strategy is vital as essentially all of our short-term positions are up against the clock. The more support and resistance we have available to use at any given time, the more theta decay we can take advantage of and the more delta neutral our positions can invariably be.
Therefore, let’s get into strategy so we can take advantage of the fund’s high implied volatility which currently is on offer as we see below.
XLV Implied Volatility V Implied Volatility (Interactive Brokers)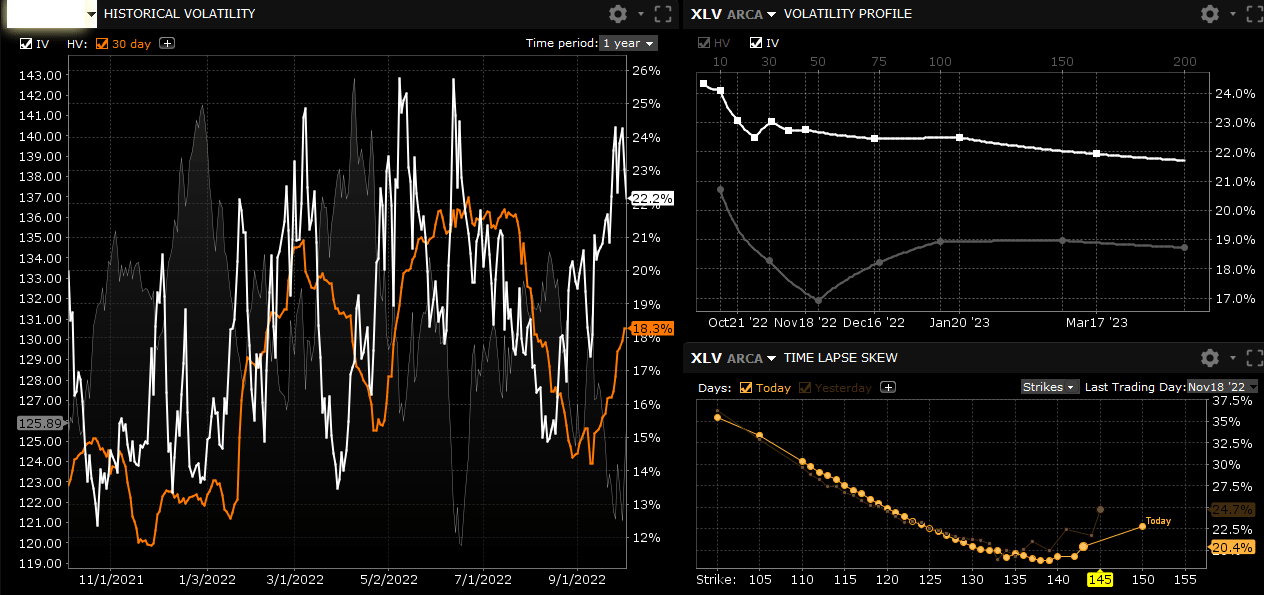
Implied Volatility V. Historical Volatility
Two areas should be focused on in the above chart. The first is that XLV’s historical volatility trails its implied volatility by some margin. Whereas implied volatility is a forward-looking indicator that gives us a read on how volatile XLV will be going forward, XLV’s historical volatility gives us a read on how volatile the ETF has been in the past. Suffice it to say, if both of these metrics were trading around the same level, we would not have any significant edge to work from. However, since implied volatility (22%+) is trading higher than historical (18%+), it means the fund’s options are essentially overvalued. Therefore in expectation of a move down in implied volatility over time, this setup gives us an edge as option sellers as it would enable us to buy back those very same options for much cheaper prices over time.
Put Skew
The second area which should be focused on is the put skew which is clearly evident in XLV. When puts are richer than their associate call options, it means traders can go further out of the money on the downside and still collect rich premiums. All things being equal, the 20 delta put option will be higher in value that the 20 delta call option in the same expiration cycle. Since puts are richer compared to their associated calls, it means put spreads are actually cheap while call spreads are actually expensive due to the lack of implied volatility on the call side.
Strategy
Therefore how can we take advantage of this setup we have presently in XLV? By selling an out-of-the-money naked put along with an out-of-the-money call spread, we are selling both a rich put contract as well as a rich call spread (Remember, the more premium, the better). As we can see below, the premium received for this high probability of profit strategy is $101 per setup. Furthermore, there is no risk to the upside in this setup because the credit received is higher than the overall width of the call spread ($100). Suffice it to say, even if XLV were to rally aggressively from this point, the trader would not lose in this setup. The risk is all to the downside where the new cost basis if indeed the trader wanted to defend a losing position would be just under $112 per share of XLV ($13+ per share beneath the prevailing share price of the ETF).
Put Skew Strategy In XLV (Interactive Brokers)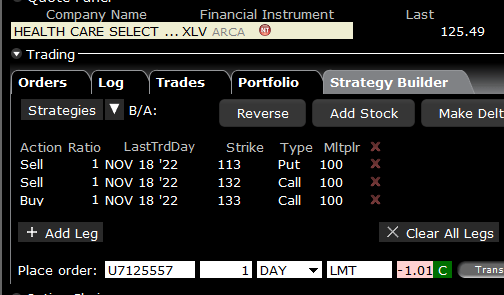
Conclusion
Therefore, to sum up, the technicals in XLV as well as its high levels of high implied volatility and put skew presently present opportunity in this underlying over the next couple of months. We look forward to continued coverage.