Generac Stock: Invest In The Energy Ecosystem (NYSE:GNRC)
J. Michael Jones
Thesis
Providing a smarter ecosystem for home energy independence is an extremely powerful idea and Generac (NYSE:GNRC) is well positioned to continue moving into that space. Capitalizing on themes like energy independence, smart energy management, and contingency planning will create synergistic effects and drive growth. The unquestionable risk is that their estimated revenue growth may be unsustainable or misrepresented given the probability of a recession and economic friction. I value Generac currently at $212.13 given a mix of analyst revenue estimates, historical data, and a margin of safety to compensate for uncertainty.
Energy Technology Potential
Generac has a strong brand and is well established for their generator products. They are the market leader with approximately 70% market share in home standby generators according to Morningstar analysts. Generac also boasts strong omni-channel distribution networks, stable and low capital expenditures, strong marketing compared to competitors, and a breadth of products and services that help maintain their competitive nature in the generator space.
Generac has made a strategic pivot in recent years into becoming an energy technology company. This newest strategic development aligns well with macro-trends relating to energy themes such as energy independence, optimization, and infrastructure. Residential revenue accounts for approximately 66% of Generac’s net sales over the past twelve months of which 85% of that was domestic. Residential electricity was the largest electricity consumption sector in the United States in 2020 according to Statista (Figure 1). Generac is already well positioned as a market leader for residential electricity contingency products and is positioning well to integrate its offerings into the everyday electricity market which is an essential service for function in today’s world.
Figure 1. Electricity consumption in the U.S. 2020 (Statista)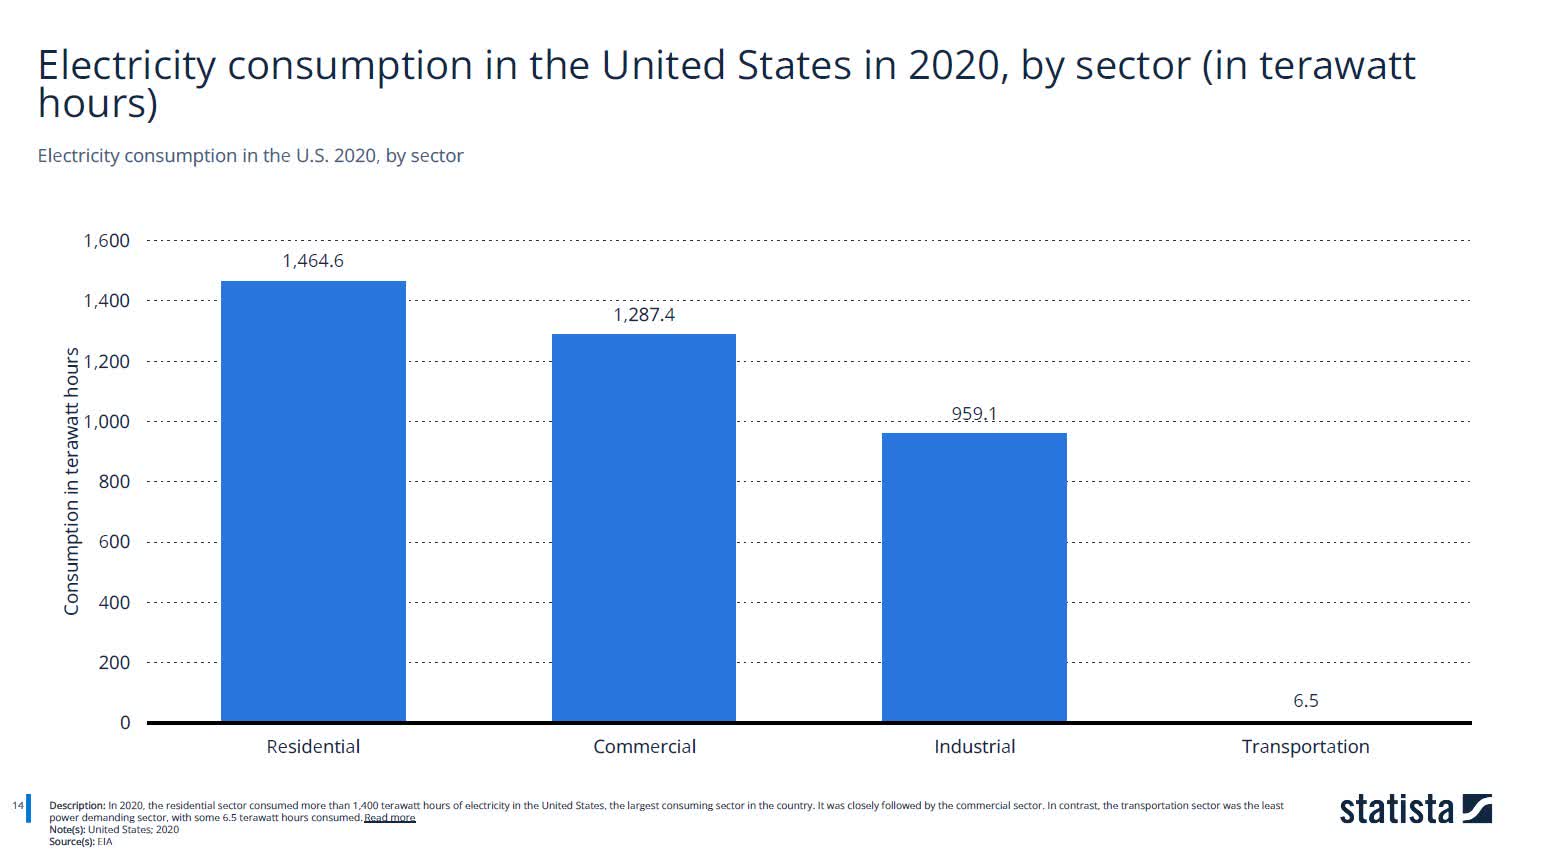
The utilization of solar technology has been increasing substantially and the primary consumption of solar energy across the U.S. between 2006 and 2020 has grown at a CAGR of 24.05% (Figure 2). This trend represents a large growing market for Generac to continue to integrate its products and services which may stimulate future firm growth.
Figure 2. Primary consumption of solar energy in the U.S. 2006-2020 (Statista)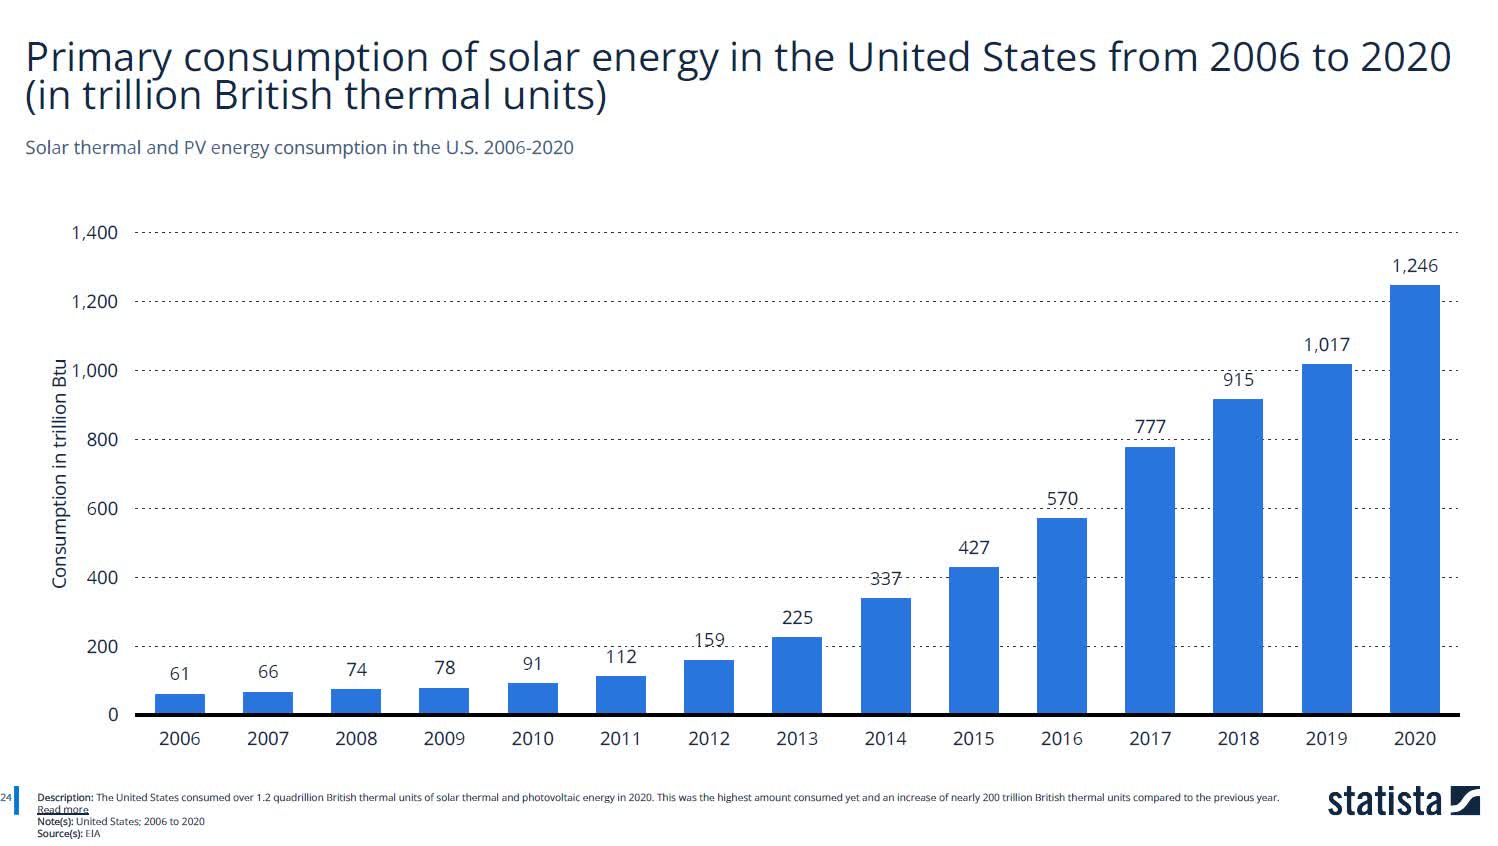
Generac is refocusing on targeting synergistic markets that align well with growing energy technology trends and integrating themselves into an energy ecosystem. Their products and services offerings are more encompassing than they were historically by providing hardware, customer service, and software to consumers (Figure 3). Generac has also been acquiring businesses at a high rate to help align their services with their strategic goals. This could enable them to create a competitive advantage by synergistically offering products and services in the growing market.
Figure 3. Generac energy ecosystem (Generac investor presentation)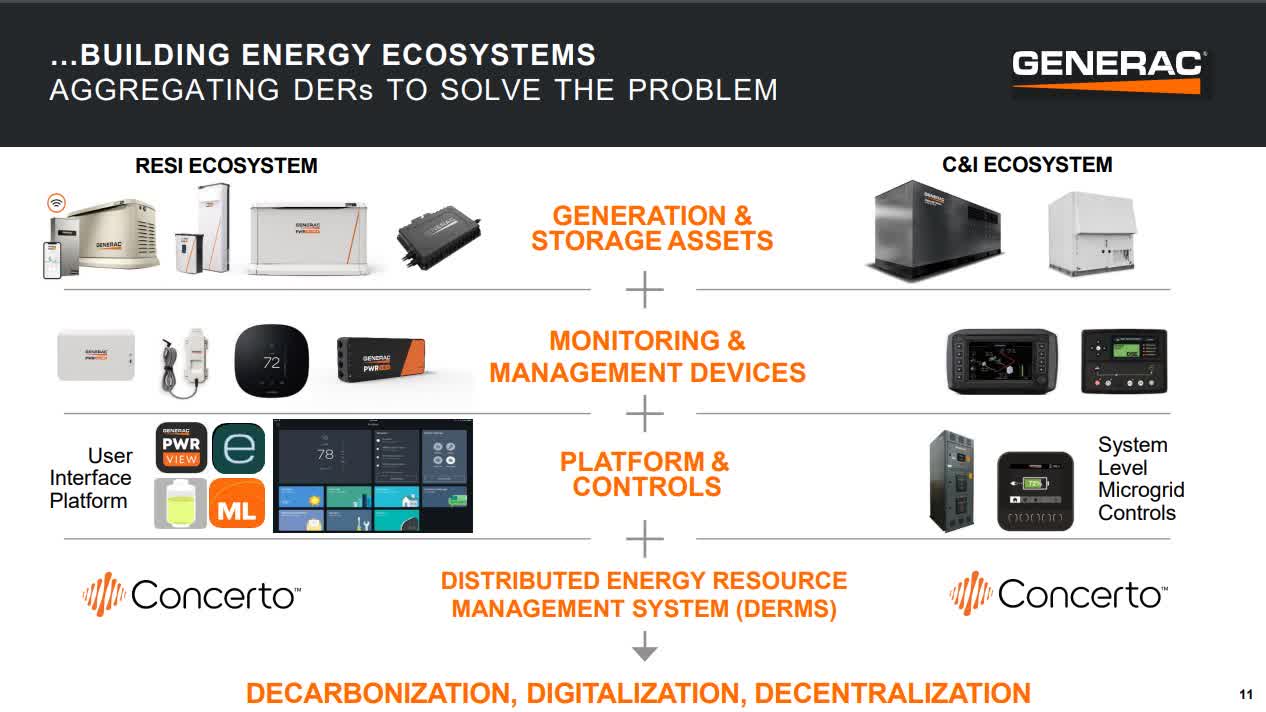
There is currently a large untapped market for the home standby generator (HSB) ecosystem. Generac is already well defined as the market leader in this space and their current estimates of home standby generators U.S penetration is approximately 5.5% (Figure 4). There is currently large penetration in the New England area and Northern states along with more hurricane prone areas in the Southeast. This visual represents ample room for growth of home standby generators and domestic areas that would be optimal for synergistic products like solar panels and generator combinations managed by smart technology.
Figure 4. Generac HSB penetration (Generac investor presentation)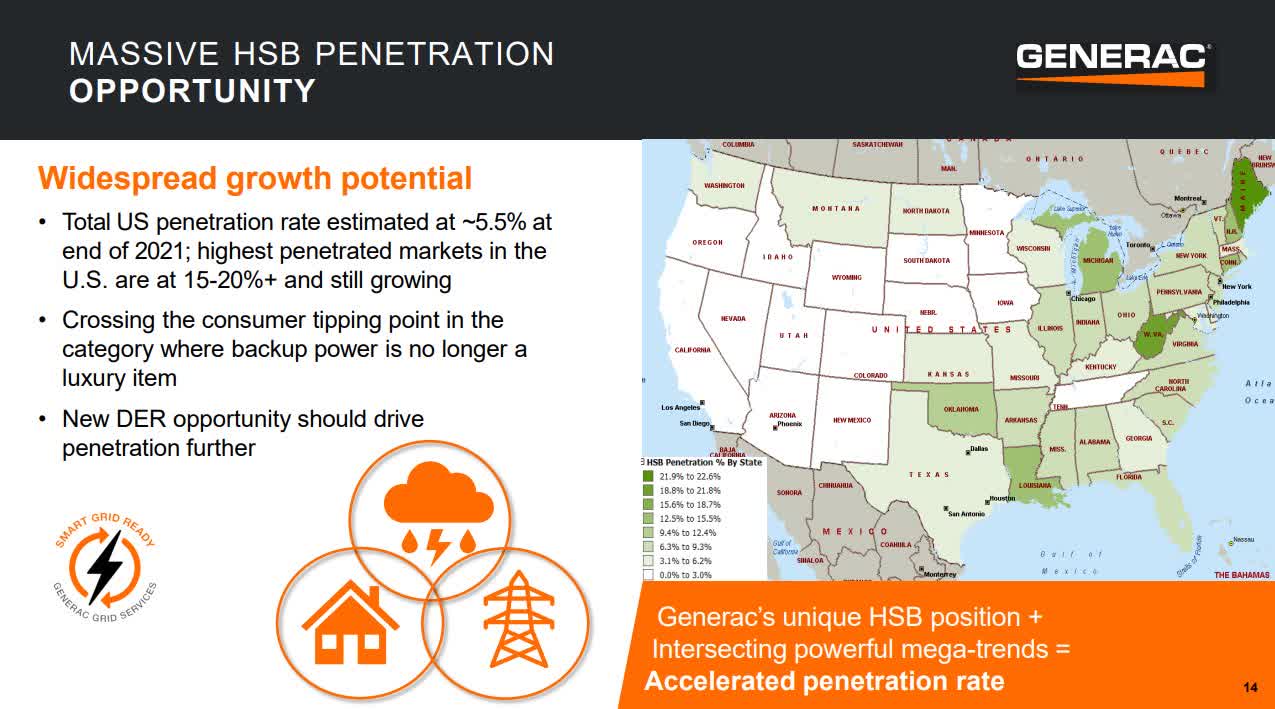
Generac is also entering into the smart energy management market which is an early adopter move strategically since the technology is in its early stages of adoption globally according to Statista researchers (Figure 5). As of 2020, the U.S is still in the early adopter’s stage which represents that less than 16% of the target market has been captured and has a large space for growth and adoption of smart energy management technology. Generac is well positioned to augment smart energy management products and services synergistically.
Figure 5. Smart energy management in innovation adoption lifecycle (Statista)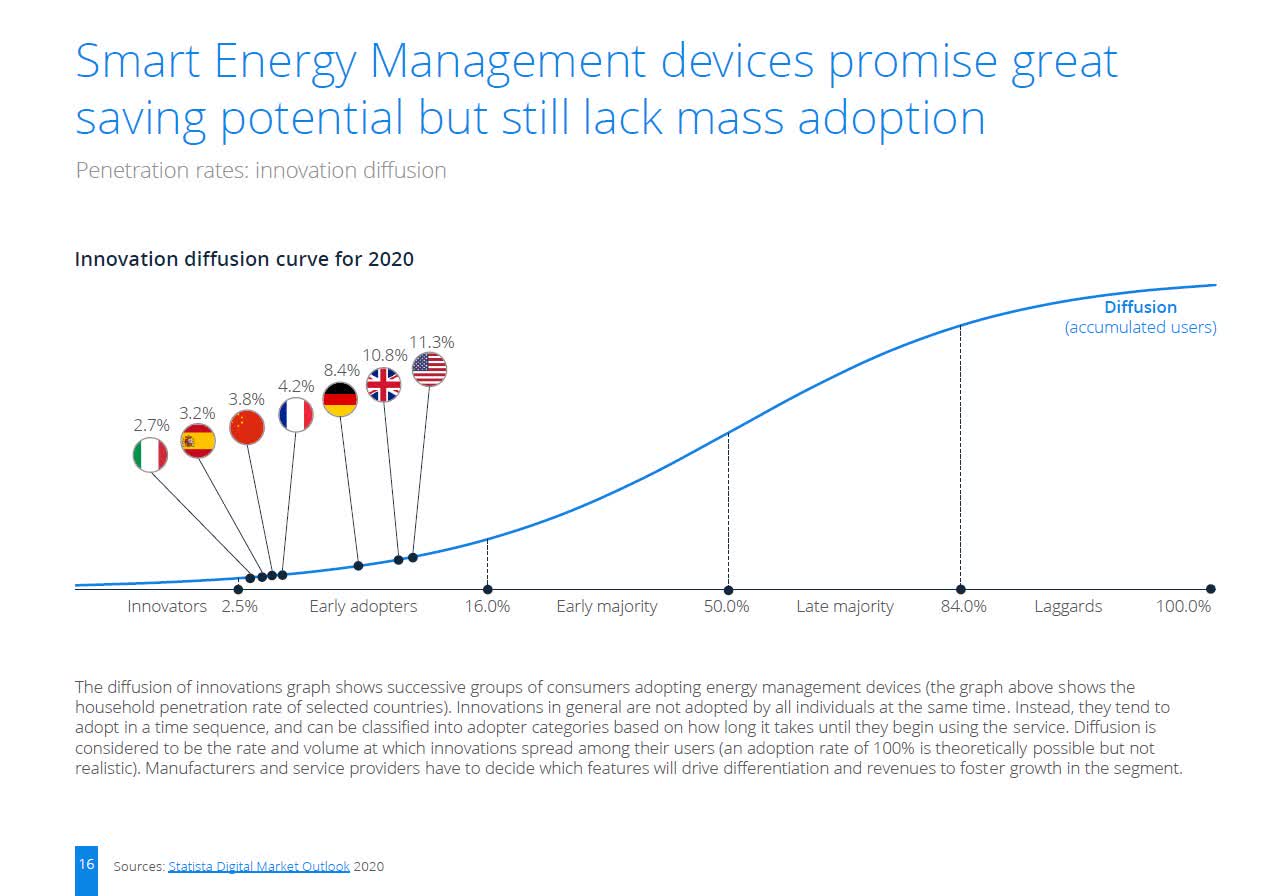
Generac’s is aligning its strategic goals to maximize its opportunities aligning well with multiple factors. Residential energy is a consistent market and will continue to be as population and housing grows. Alternative energy sources like solar are becoming more accessible and will continue to be integrated as an energy source which Generac is well positioned to synergize with over the long term. Generac is utilizing its products and services to offer more comprehensive energy ecosystems which align well with building a stable consumer base. There is currently a massive lack of penetration across large portions of the United states which gives them a large runway to capitalize on. Smart energy management is still in the early adopters phase of the innovation adoption lifecycle and has large growth potential. Providing a smarter ecosystem for home energy independence is an extremely powerful idea and Generac is well positioned to continue moving into that space.
Statistical analysis
Methodology
The goal of this portion of the analysis is to determine the valuation of Generac. A graphical observation approach using JMP software and historical data can be utilized to analyze trends from their firm. The analysis will be broken into multiple components to gain an understanding of significant trends augmented by relevant statistics. Observing the graphical representations can highlight discrepancies and provide insights that are useful for investors to understand relationships. The trends can then be utilized to derive inputs for the valuation model.
The variables this analysis primarily focuses on are split between firm intrinsic, investor specific metrics, and macro-economic.
Statistically, we are looking for higher R2 values and significant p values less than 0.05. The R2 is known as the coefficient of determination which measures how well a statistical model fits its independent and dependent variables on a scale of 0 to 1. The higher values closer to one signify a stronger correlation. The p value is the probability value and represents the likelihood of a data point resulting from randomness. Having a lower p value represents data results that are significant and less likely occurring from random chance. A p value less than 0.05 and an R2 value closer to 1 are sought to analyze significant historical trends.
It is important to note that a high correlation does not infer causation. This means that variables having a high R2 and low p value don’t necessarily cause the dependent variable to be changed by the independent variable. Causality has to be proven through more advanced means.
When observing the graphical representations produced by JMP software in this article, the dark line is the trend mean, the dark faded coloring represents one standard deviation, and the lighter faded outer colored line represents two standard deviations. The data points may lie at different distances from the mean, representing variances from the trend. The standard deviation is a standardized measure of variance. Two standard deviations provides an approximate 95% confidence interval which can be interpreted as 95% of the sample data lies within that range.
The raw data that was used as inputs for this analysis in the JMP software was sourced from TIKR terminal.
Profitability Metrics
Generac has provided stable quarterly gross margins over the past decade (Figure 6, green line). The net margins have waivered more inconsistently but have remained elevated over the past 10 periods ending in a recent decline (purple line). The return on equity (ROE) historically has shown large variance over the same period (blue line). The return on capital employed (ROCE) has much less variance observably and indicates the firm is maintaining profitability metrics (orange line). I interpret this data as Generac having volatility in returns for investors but having maintained profitability. It is important to consider both macro and internal variables that may affect the metrics such as inflation in the most recent quarters or possibly internal inefficiencies that are deteriorating margins.
Figure 6. GNRC ROE, ROCE, Gross Margin, Net Margin (Author)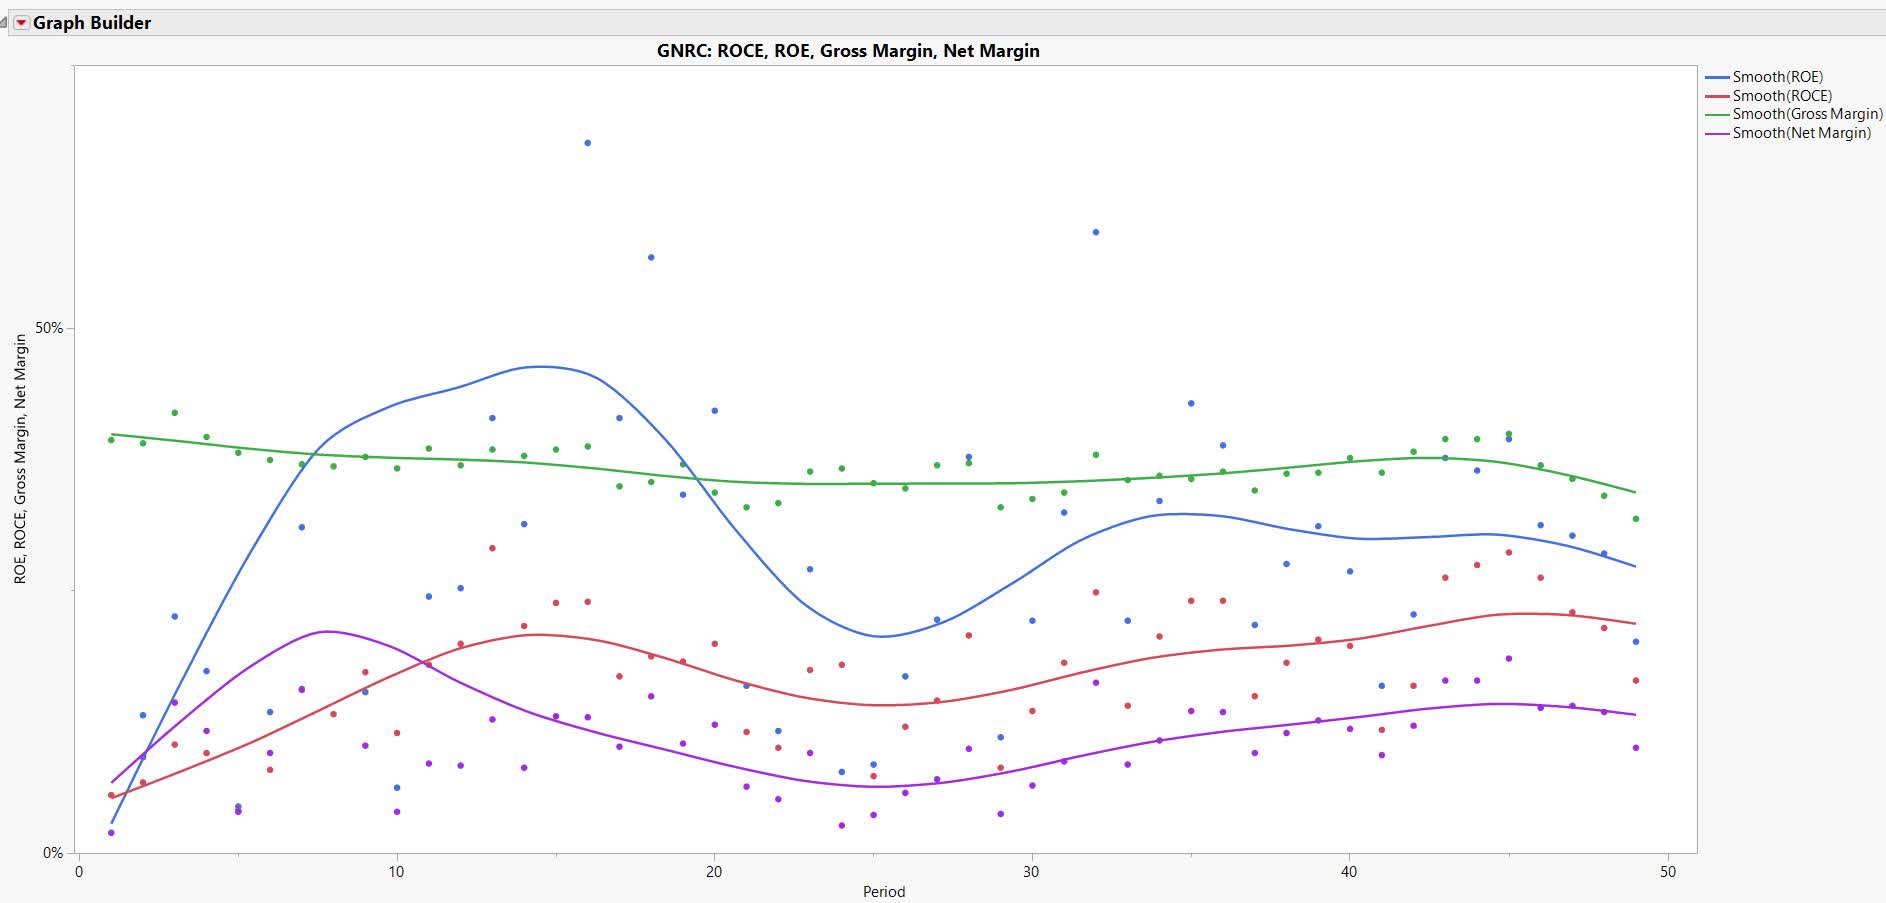
Other Metrics
The quarterly revenue growth for Generac has grown substantially over its history of trading publicly (Figure 7, blue line). Comparatively, the earnings per share (EPS) do not trend in parallel and have increased at a lesser rate (red line). The P/E ratio shows more volatility than both the EPS and revenue growth. This suggests that either the stock price over the short term is appropriately considering future growth that is unrelated to current performance or that there is a more recent irrational component that created an overvaluation trend into the stock price. This representation should be of concern to investors since the cost basis of an investment is critical for investment return rates.
Figure 7. GNRC: Revenue, EPS, P/E (Author)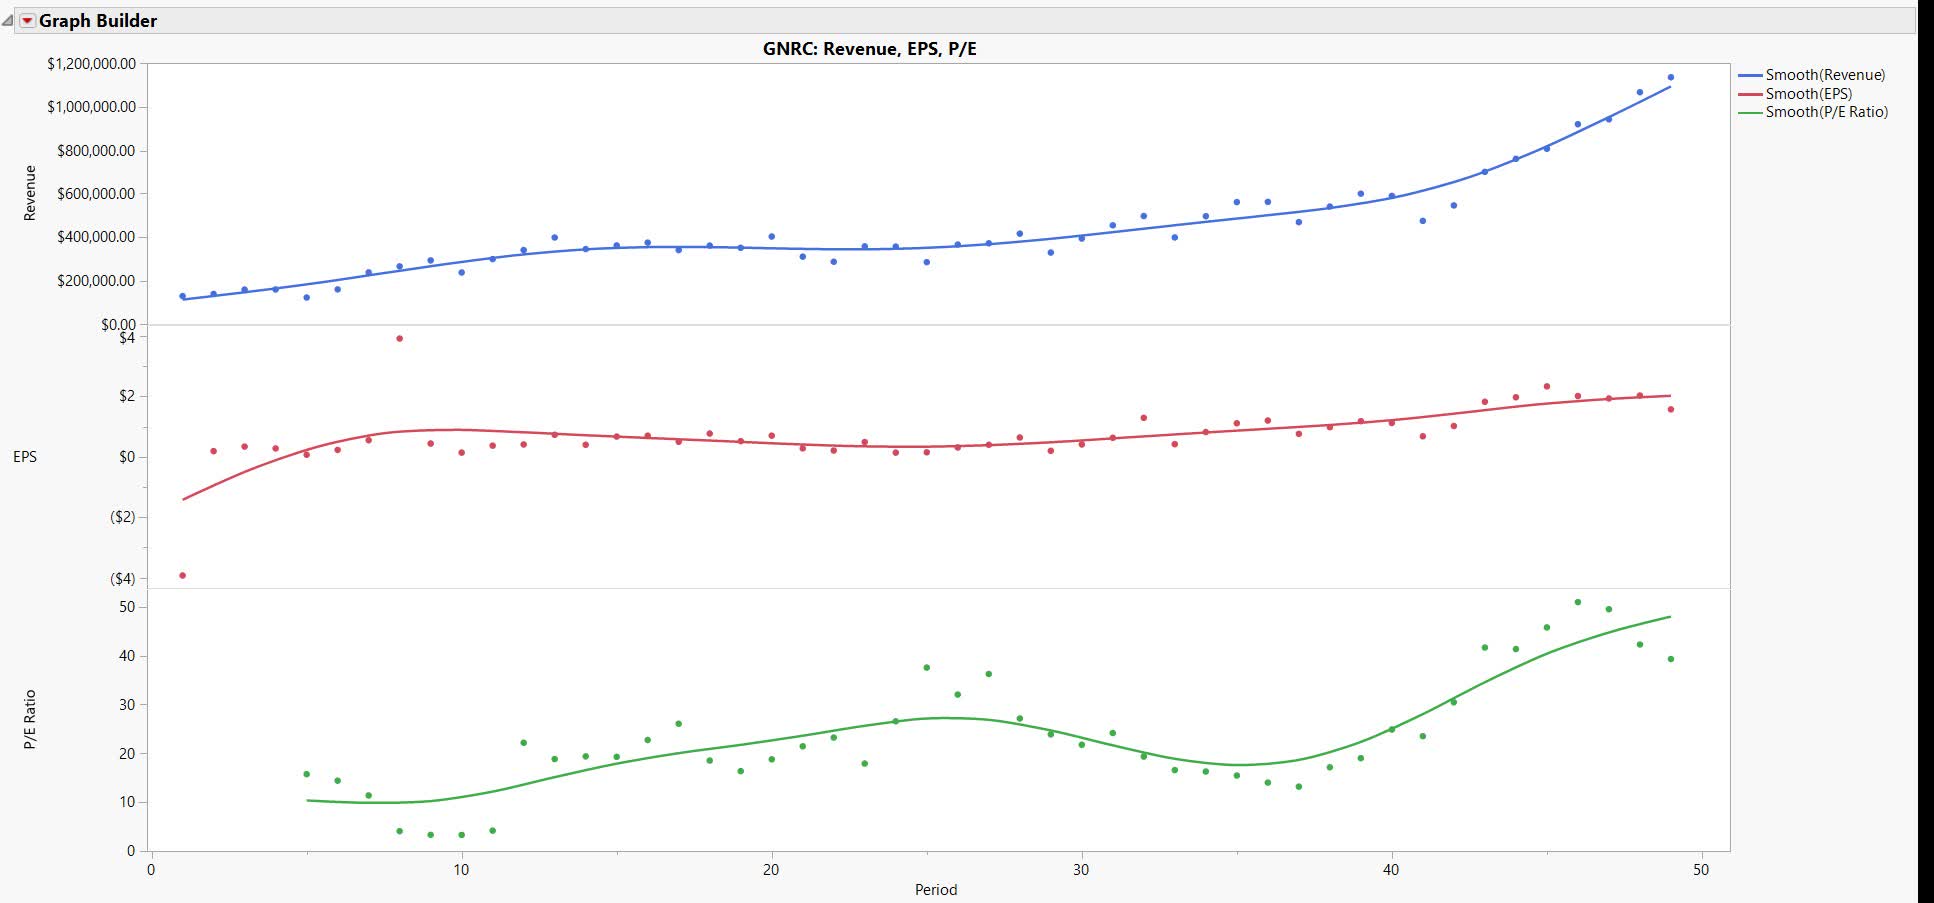
Macroeconomic Considerations
Generac’s largest revenue stream is domestic residential sales. Identifying and understanding key drivers of this revenue segment and incorporating them into the valuation model can help incorporate a margin of safety for investors looking to establish a position into GNRC. The macro-economic trend data can be pulled from the Federal Reserve Economic Data (FRED) website.
The large flaw in this sample is that Generac doesn’t have enough revenue recession data since they went public after the Great Recession and the correlations between consumers and Generac’s revenue may not be causal even though intuitively it seems logical.
The typical customers for residential home standby generators are likely to be homeowners that have a large disposable incomes and can actualize value in Generac products and services. I theorize that as people spend more money on durable goods, they are more likely to contribute a portion of that spending to Generac products. That would suggest that consumers are likely to spend less on Generac’s current products in time periods of expenditure constraint which can be triggered by macro-concerns like inflation, high unemployment, or economic recessions.
Generac’s revenue has a high correlation with personal consumption expenditures for durable goods according to the linear regression (Figure 8, blue line, R2 = 0.893, p < 0.0001). This suggests that when consumer spending is higher for durable goods, that Generac has increased revenues.
Figure 8. GNRC revenue as a function of personal consumption expenditures durable goods (Author)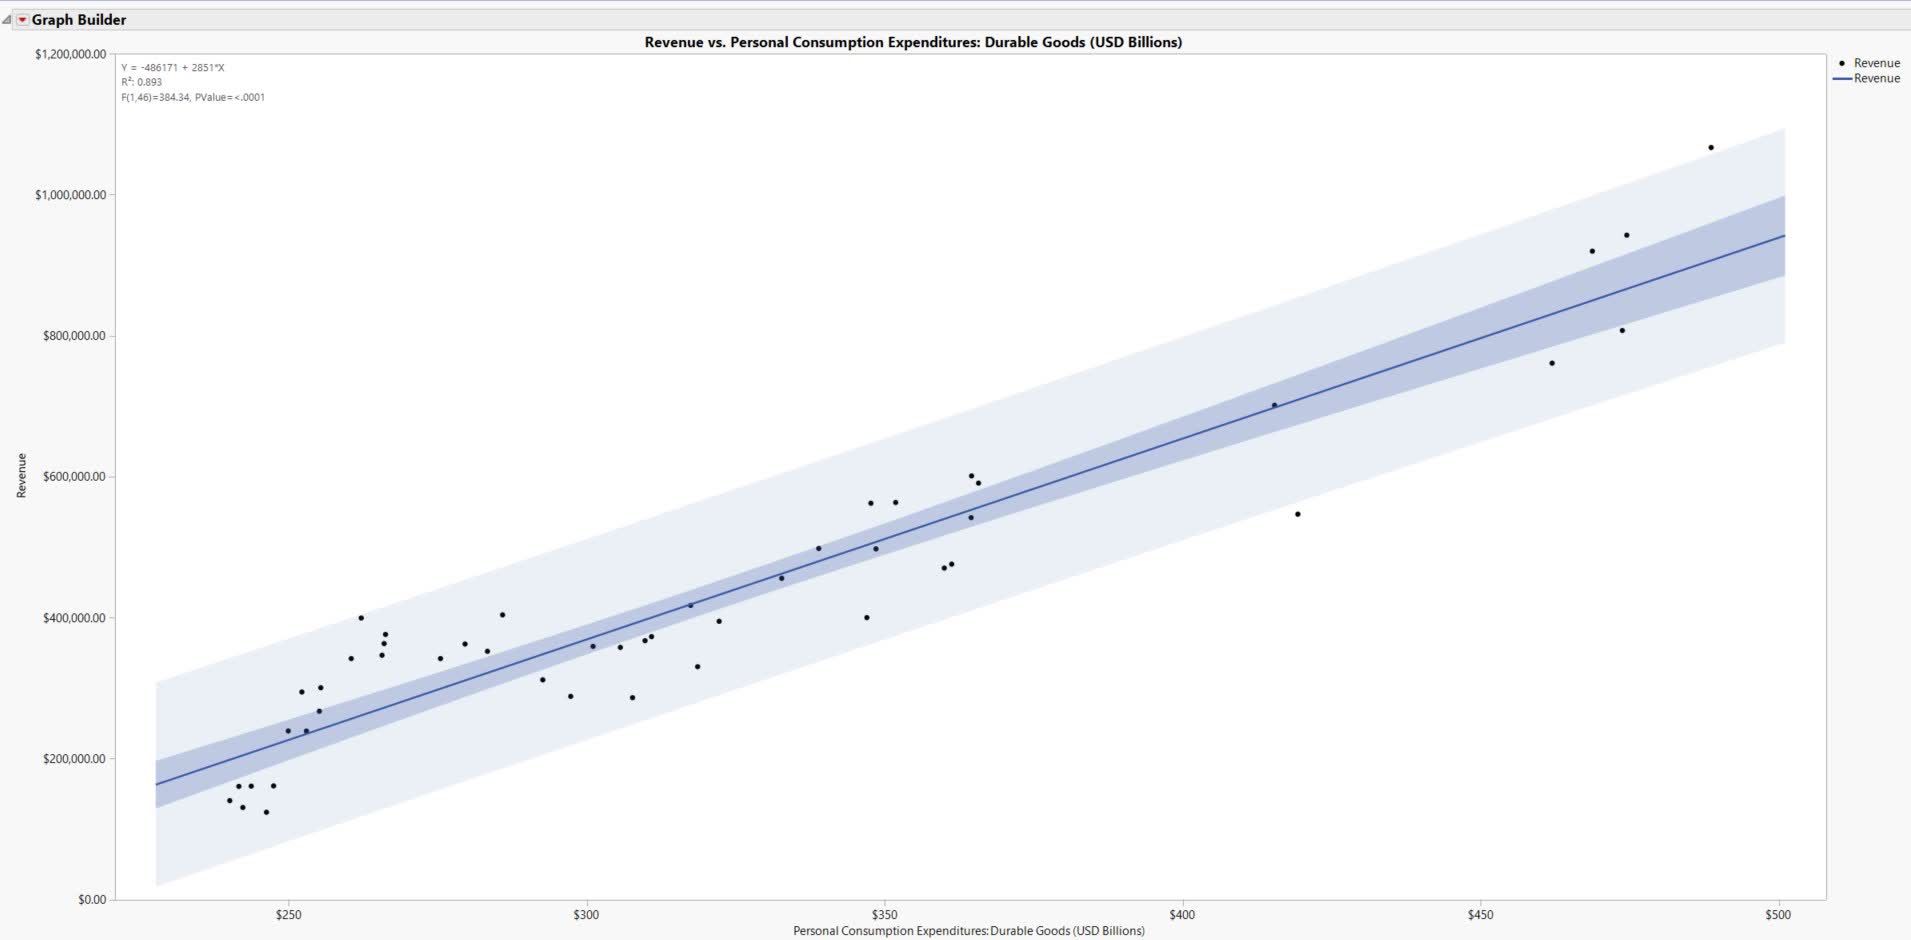
I theorize that there is a relationship between individuals’ incomes and how much they spend, thus other key drivers of their revenue segment would be personal income, overall personal consumption expenditure, and real disposable income per capita.
These drivers may correlate or provide causal links to Generac’s domestic residential revenue segment. The figure below aids in the visualization and identification of correlational relationships between all three factors and Generac’s revenue (Figure 9). Personal consumption expenditures (blue line, R2 = 0.862, p < 0.0001), personal income (red line, R2 = 0.817, p < 0.0001), and real disposable personal income per capita (green line, R2 = 0.605, p < 0.0001) all have a have a high correlation with revenue. This suggests that when consumers have a larger income, have increased expenditures, and have more disposable income, that Generac’s revenues are likely to increase which intuitively seems logical.
Figure 9. Revenue as a function of personal consumption expenditure, personal income, and disposable income per capita (Author)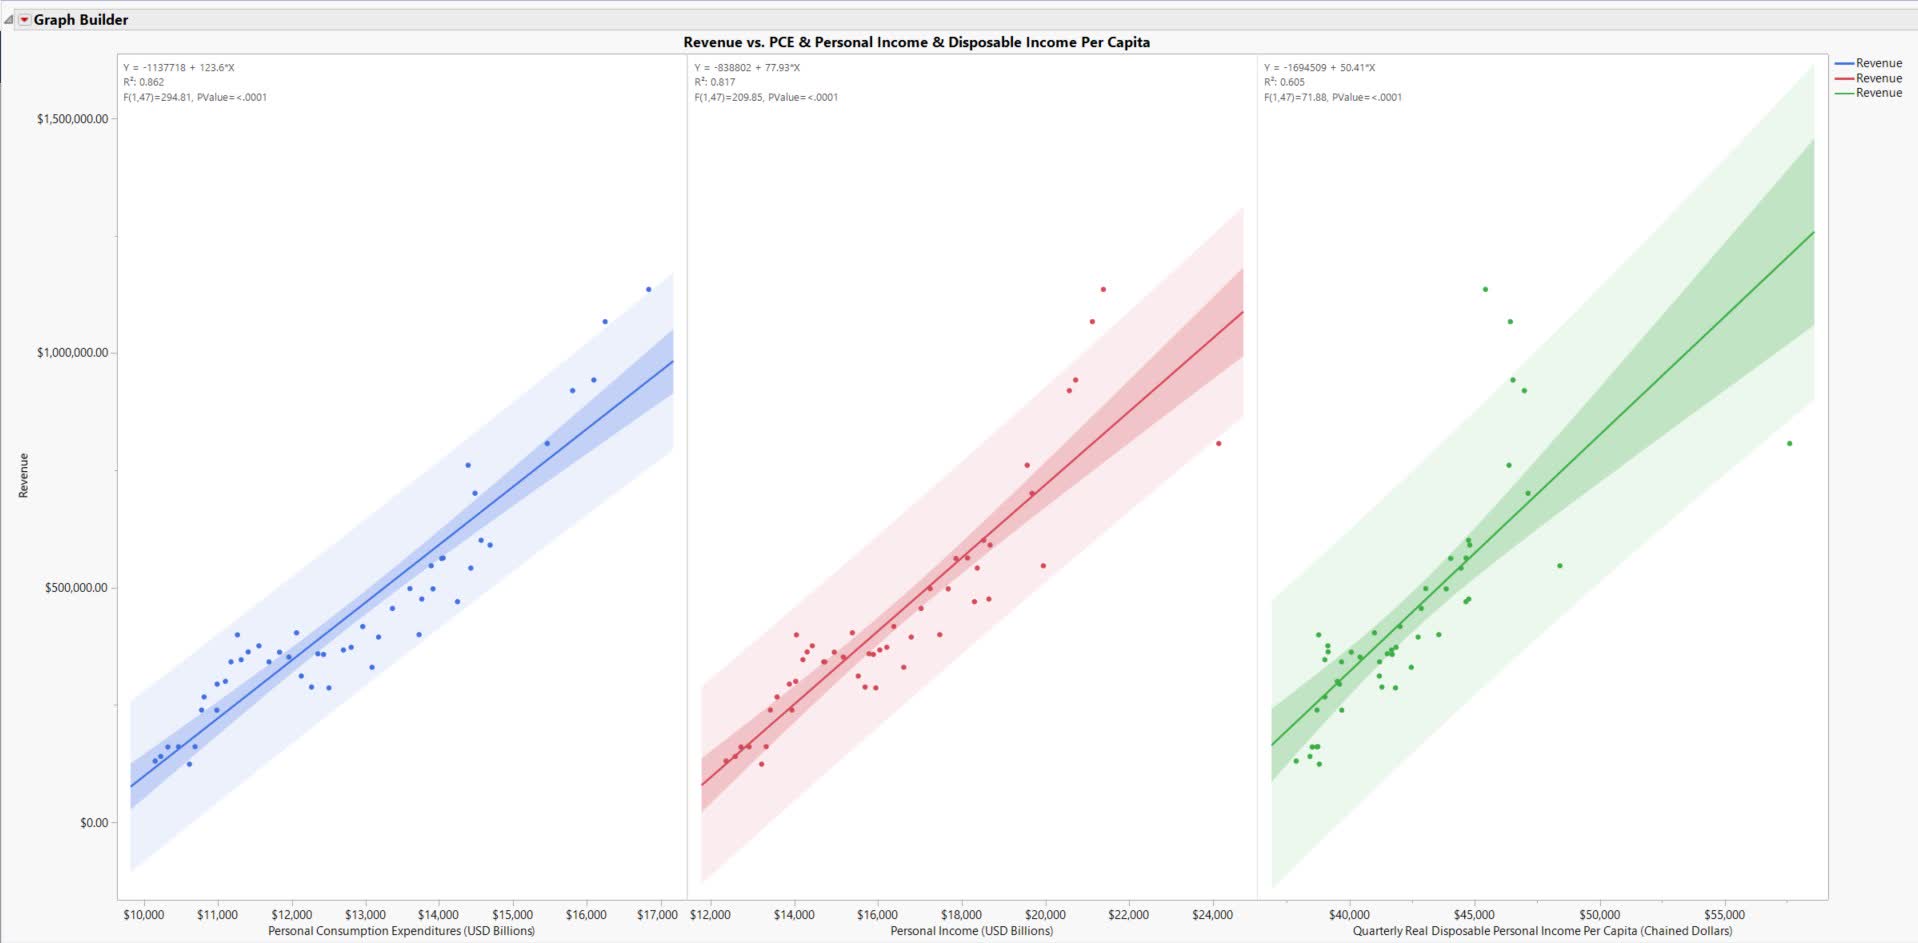
This data suggests concerns for investing in Generac. The high capital investment of their products for consumers and that the purchase typically is for contingencies and a luxury purchase poses issues. They may see a decrease in sales if consumer spending, income, and economic confidence decreases. I don’t anticipate households making generator purchases if they are tightening their household budgets over the short term. 83.3% of the recessions since the late 1940s have led to a decrease in personal consumption expenditures specifically relating to durable goods over the short term (gray columns, Figure 10). This suggests that consumers are likely to spend less during recession periods. The positive aspect of this is that recoveries are a natural part of the cycle and that it is probable that the firms that survive a recession will rebound appropriately. Another important observation is that after the sudden 2020 recession, the rate of change of personal consumer expenditures for durable goods is extremely high. This may be due to the excess money supply that found households able to substantially increase their spending which may also have impacted Generac’s recent revenue outperformance.
Figure 10. Personal consumption expenditures of durable goods (Federal Reserve Economic Data)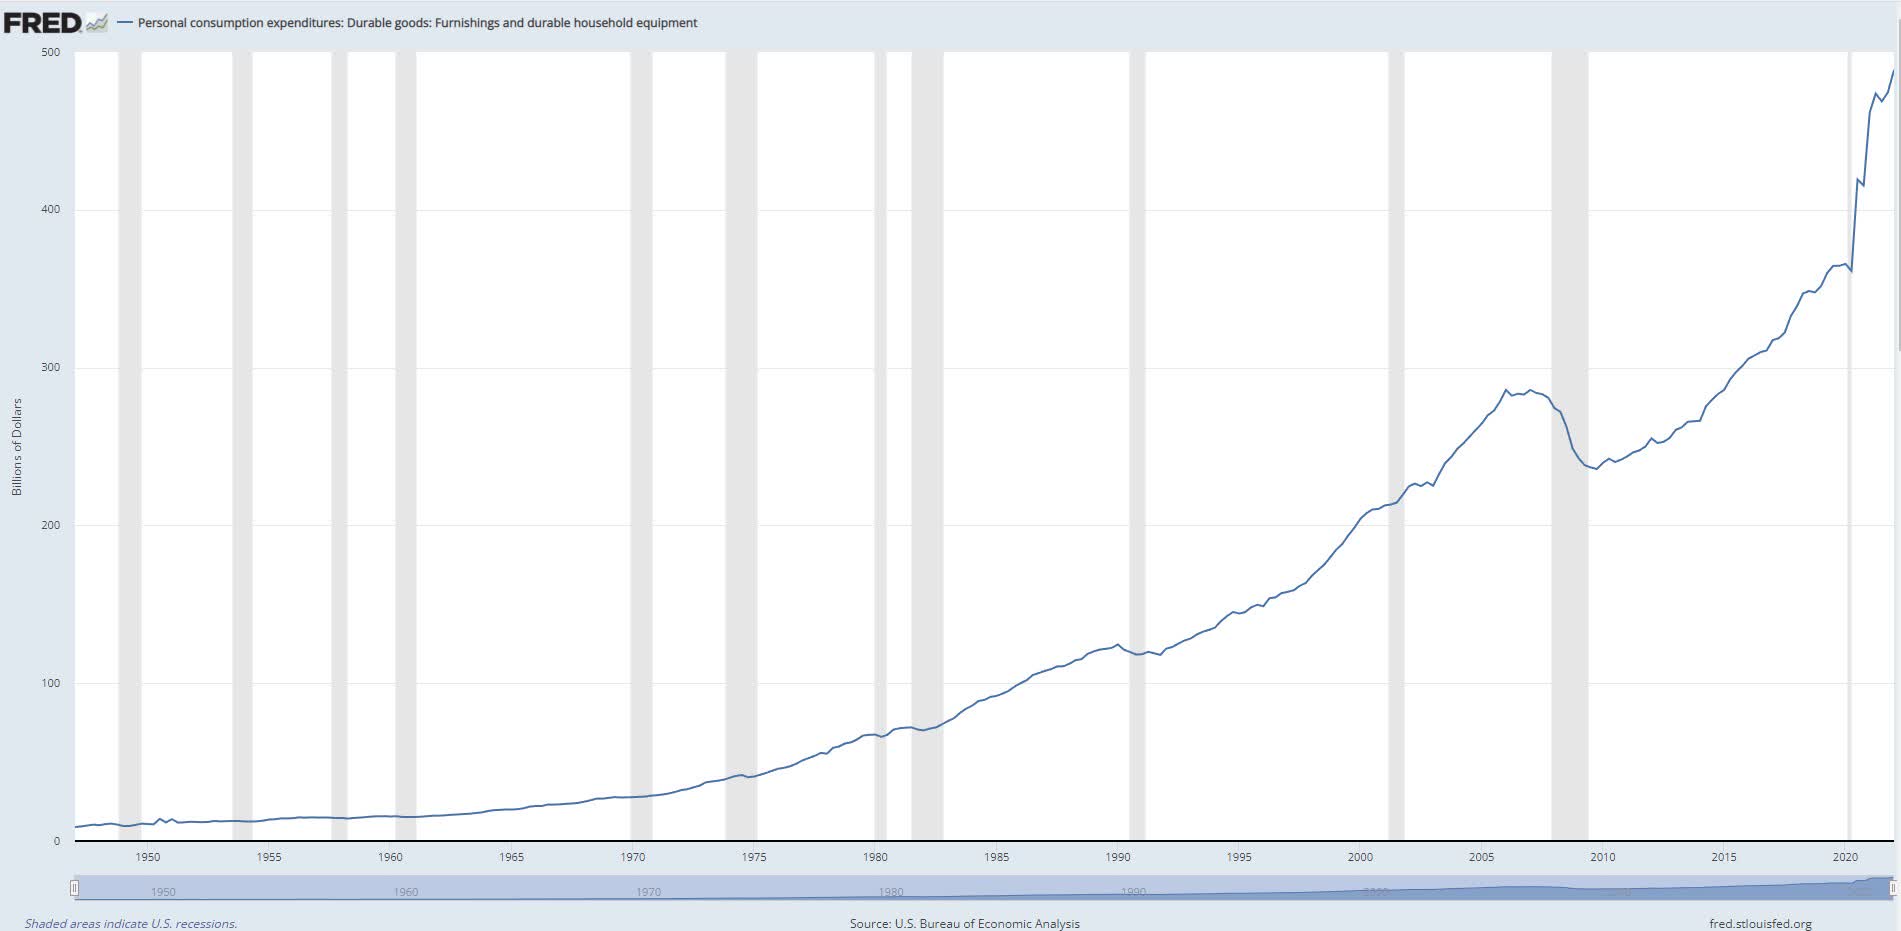
The real disposable personal income per capita had extremely volatile movements through 2020 and 2021 (Figure 11). The real disposable personal income per capita was exceptionally high at points and is starting to restabilize to pre-2020 levels. I theorize that this may also have had an influence on Generac’s record breaking revenues and question whether their growth is sustainable from the consumers perspective.
Figure 11. Real disposable personal income: per capita (Federal Reserve Economic Data)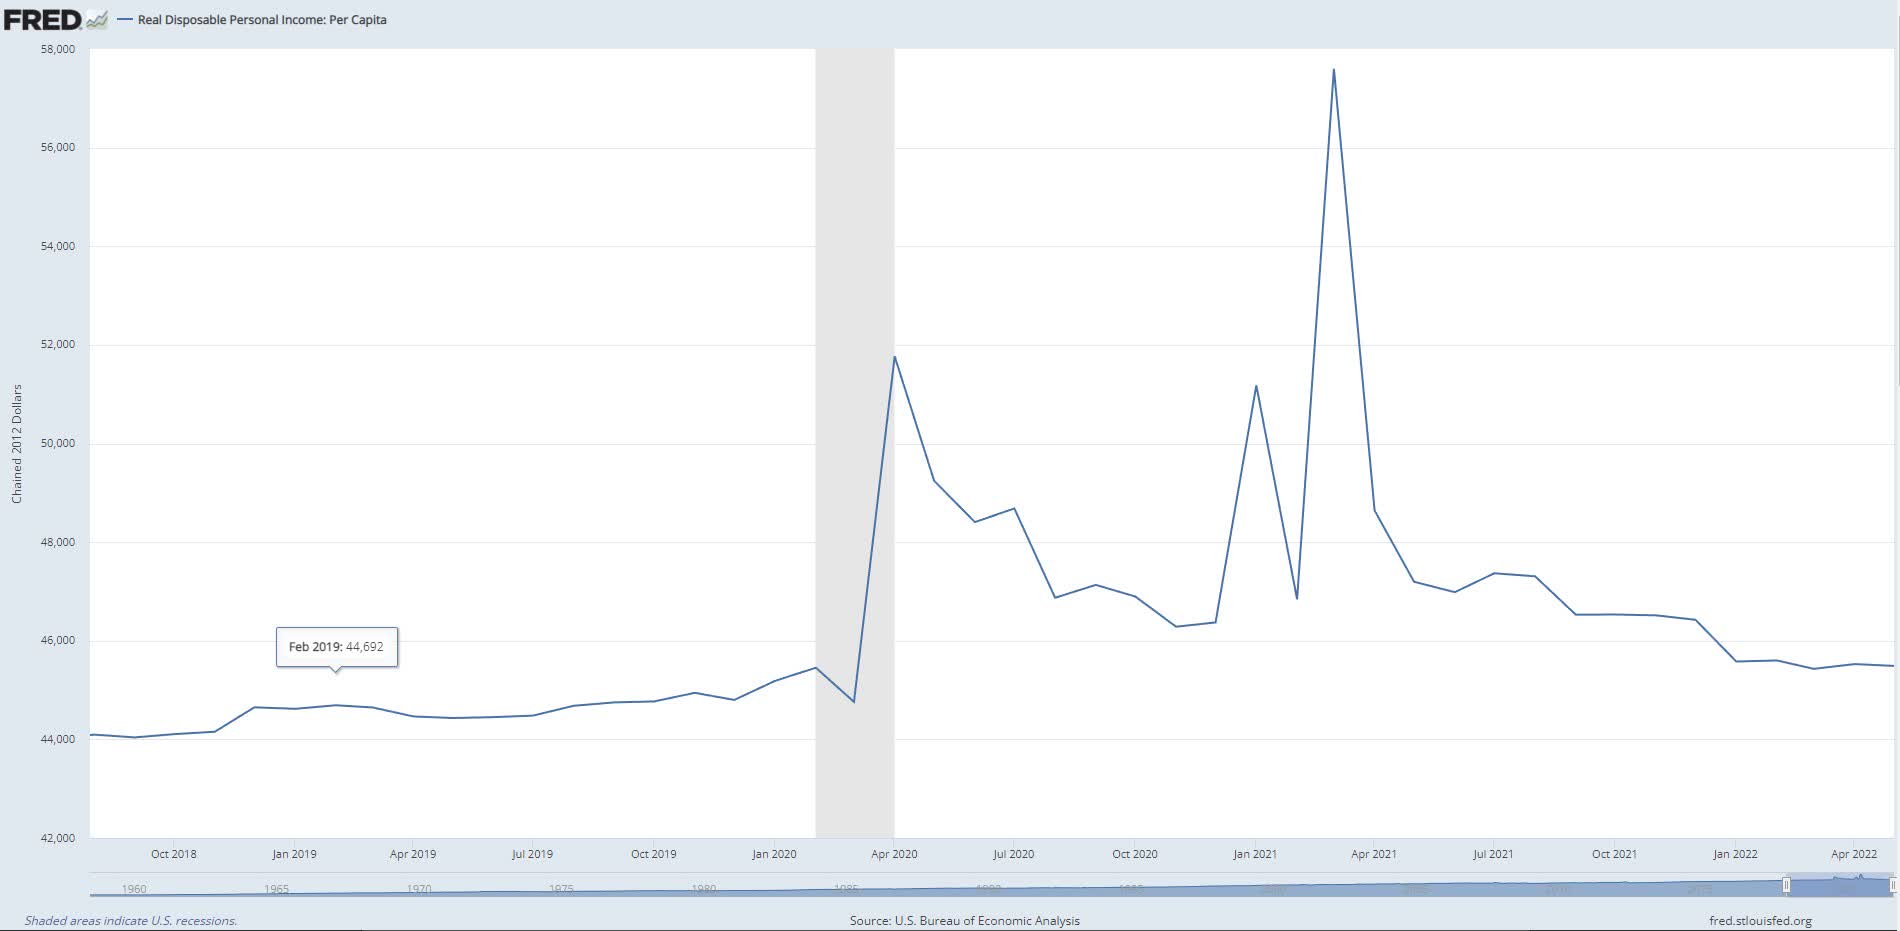
FCF Margins
The quarterly free cash flow (FCF) margin data over the past 10 years represented in a frequency distribution can be used to help estimate the FCF for the future based off historical trends (Figure 12). Generac has had a quarterly FCF margin mean of 13.31% and median of 12.91%. Utilizing conservative estimates, the 12.91% median will be the input for the valuation. The FCF margin frequency distribution also shows that Generac has historically maintained a 95% confidence interval between 10.75% and 15.86%. This means that 95% of their historical FCF margins in this sample fall within that range and builds confidence for investors supporting consistent performance.
Figure 12. FCF margin frequency distribution (Author)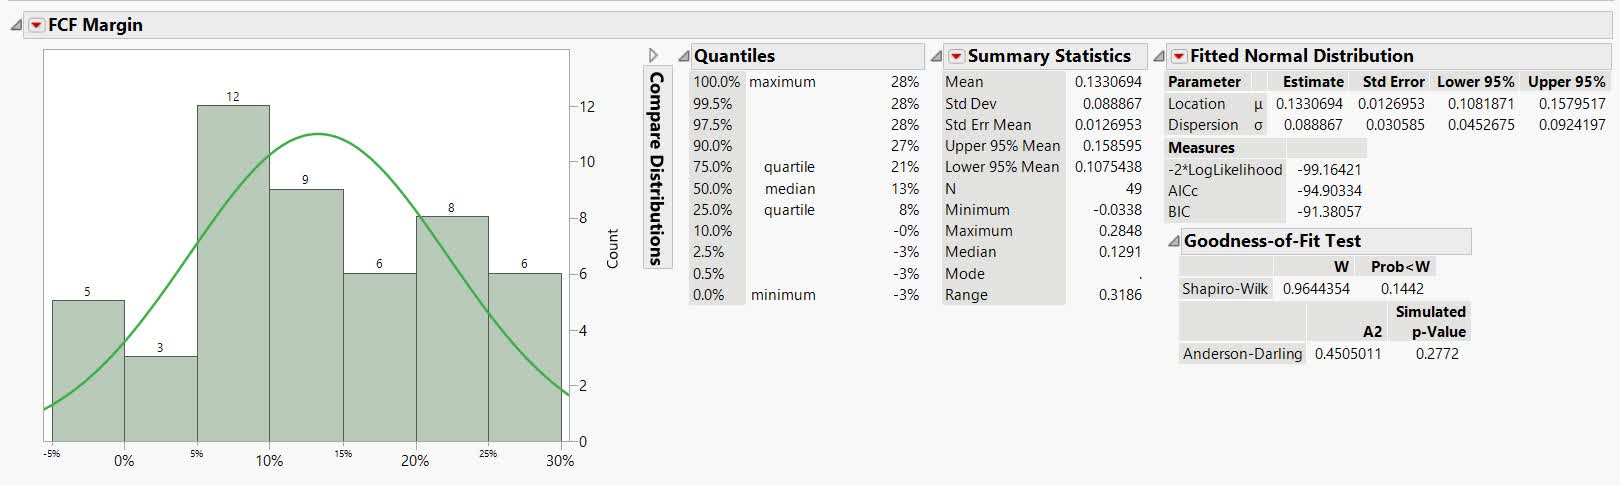
Revenue Growth Rates
The revenue median annual growth rate is 9.42% and mean is 13.28% (Figure 13). The annual revenue frequency distribution also shows that Generac has historically maintained a 95% confidence interval between 3.13% and 23.42% which is a broad range. The most recent annualized growth rate expectation is supposed to be between 36% and 40% for 2022 according to management and analysts. The analyst and management expectation are largely outside of the historical data ranges for this sample. This signifies that either they are grossly misrepresenting the expectations or that the business has made a strong pivot to outperform their historical rates. I think that it is well supported that the business has moved in a positive direction and will utilize analyst revenue expectations for valuations through 2026 reverting to the historical median between 2026 and 2030.
Figure 13. Revenue growth rates frequency distribution (Author)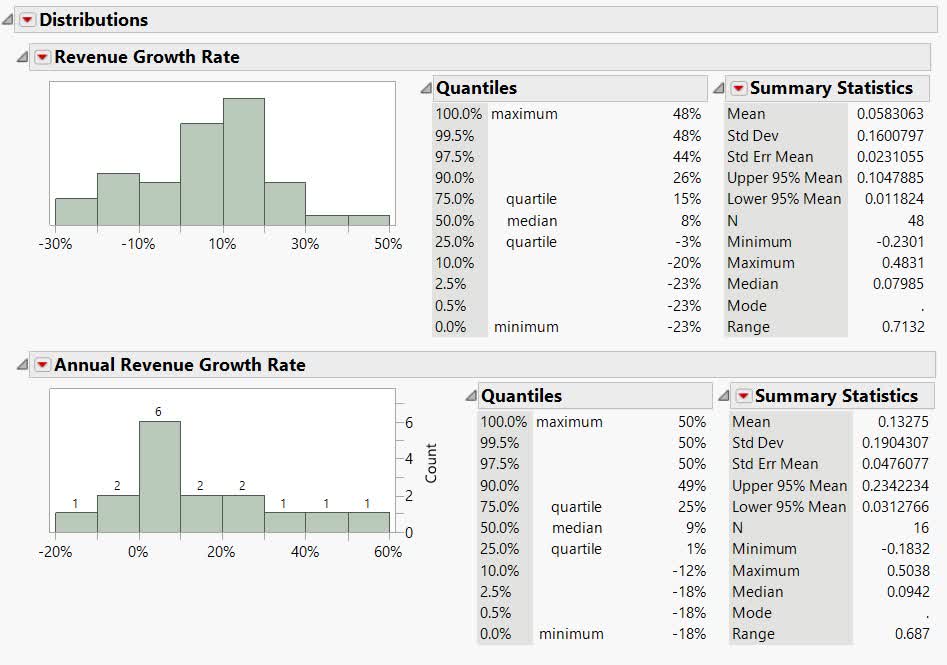
Valuation
Generac valuation is challenging since their recent growth is such a strong outlier to their historical performance. The question is whether that growth is sustainable or not over the valuation period. The goal of this valuation is to identify an implied purchase price factoring in a margin of safety based off the current data and expected future outcomes.
The assumptions are as follows:
FCF margin of 12.91% (historical median).
Analyst revenue assumption of approximately a 10-11% growth rate from 2023 to 2026. Then an approximate 6% growth rate in 2026 followed by a 9.4% (historical median) growth rate to 2030.
It seems plausible that Generac has the ability to grow greater than 3% past 2030 given the energy industry transition, but assuming a 3% terminal value growth rate helps build in a small margin of safety for the unknown.
Discount rate of 10%, I am attempting to value at my expected return to make the investment worthwhile and factoring in a margin of safety for the macro-economic risks that have been expressed.
Figure 14. Discounted cash flow (Author)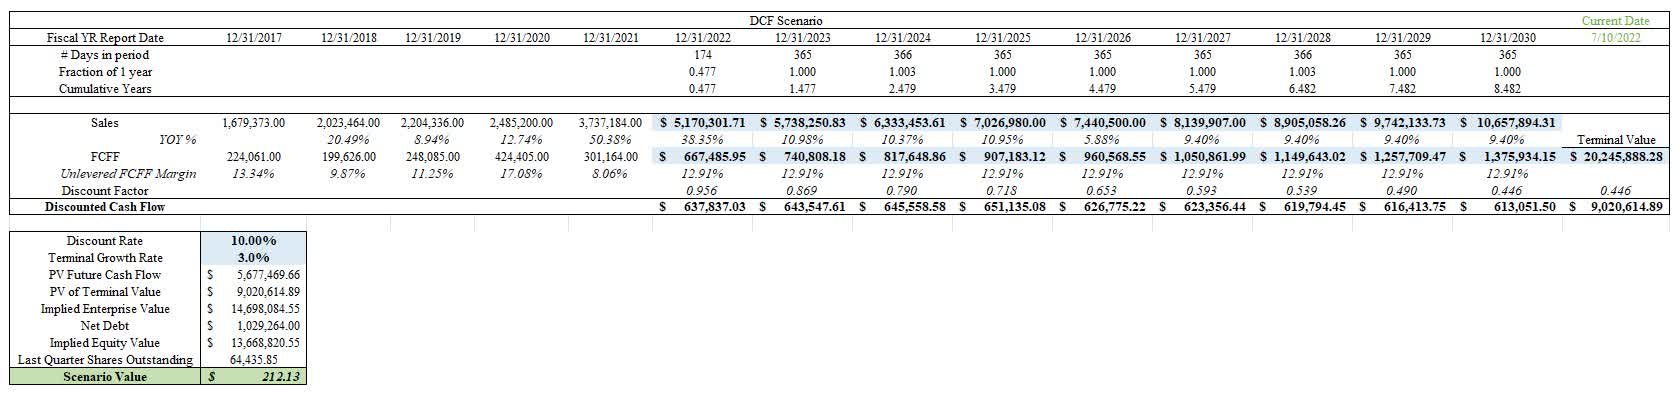
The DCF model with the assumptions stated derive an implied purchase price of $212.13. As of this writing, GNRC was trading at approximately $230 which means that it is less than 10% over my implied purchase price.
Risk
There is looming risk for Generac moving forward given the nature of their products and services. There is a possibility that consumer expenditures have a sharp decrease over the short term and hinder the revenue growth. It is also possible that the accelerated consumer expenditures contributed to an outlier period for Generac and that the assumptions going forward are grossly misrepresented. The return to normalization of real disposable income and rate decrease of consumer expenditures could have a very large impact on Generac. This is also supported by the accelerated P/E change that was disproportionate to historical measures. These risks may not be properly calculated for in the current stock price.
Conclusion
Generac is well positioned to continue moving into developing an energy ecosystem for their customers. The risk I theorize is that their estimated revenue growth may be misrepresented given the potential for economic friction. It is important to have a thoughtful buying strategy for establishing positions in growth focused firms. Caution is warranted in establishing a large or full position directly into Generac over the short-term and investors should consider strategies such as purchasing small positions over the next few years as opportunities may arise. I consider Generac to be a long-term move in a market that has a lot of potential for growth if purchased at appropriate price levels.