FFC CEF: Deep Discount Appears (NYSE:FFC)

cemagraphics
Written by Nick Ackerman, co-produced by Stanford Chemist. This article was originally published to members of the CEF/ETF Income Laboratory on October 1st, 2022.
Flaherty & Crumrine’s suite of funds has generally been running at premiums for years. This was fueled by low borrowing costs due to interest rates being near zero. As they invest in primarily preferred and other fixed-income securities, this benefited the fund. I previously covered more on the topic of higher interest rates when looking at Flaherty & Crumrine Dynamic Preferred and Income Fund (DFP).
Today, I wanted to look at Flaherty & Crumrine Preferred and Income Securities Fund (NYSE:FFC). That article on DFP remains just as relevant for FFC at this time. The higher interest rates should see the fund’s distribution continue to be trimmed until a pivot by the Fed. If they hold rates steady, then we can expect the distribution to stabilize. If they start cutting rates, we could see the interest expenses fall dramatically and see the distributions increase.
It is sporting the largest 1-year negative z-score of the bunch. This type of deep discount hasn’t been seen since 2020 when it made a sharp recovery quickly. Around 2018, this level of discount appeared too for a bit, but we haven’t seen sustained discounts of this level for years since 2008/09. While we are now in a new environment for these funds, it’s getting to a point where the discounts seem to be getting extended.
The Basics
- 1-Year Z-score: -3.29
- Discount: -6.70%
- Distribution Yield: 8.69%
- Expense Ratio: 0.87%
- Leverage: 39.60%
- Managed Assets: $1.268 billion
- Structure: Perpetual
FFC’s investment objective is “to provide its common shareholders with high current income consistent with preservation of capital.” To achieve this objective, the fund will “invest at least 80% of its Managed Assets in a portfolio of preferred and other income-producing securities.”
One thing that helped the F&C funds perform relatively better is the lower expense ratio. At 0.87%, that’s lower than the majority of CEFs. When including leverage expenses, it came to 1.47%.
That expense ratio is set to go higher due to the substantial amount of leverage the fund uses. This isn’t just an FFC thing; most preferred funds are highly leveraged. What might be a bit more unusual for the F&C funds is they don’t utilize any interest rate swaps to try to mitigate the negative impact of higher rates.
The fund did not have to deleverage in 2020, so they’ve maintained this elevated amount of leverage through a volatile period previously. This time though, rates are rising, and that’s what’s crushing the fund. That could prove to be more detrimental, as the decline would be stickier without a quick rebound that we saw previously.
On the other hand, a significant portion of their portfolio is invested in fixed-to-floating exposure. The problem is that the higher rates come much faster than the floating portion kicks in on their underlying portfolios.
As an example, Cohen & Steers Tax-Advantaged preferred Securities & Income Fund (PTA) had negotiated fixed-rate borrowings and interest rate swaps. That saw that around 85% of their borrowings were fixed for approximately 4 years. 4 years is an eternity, and we could be at zero rates again by then, after the Fed careens us into recession.
Performance – Attractive Discount
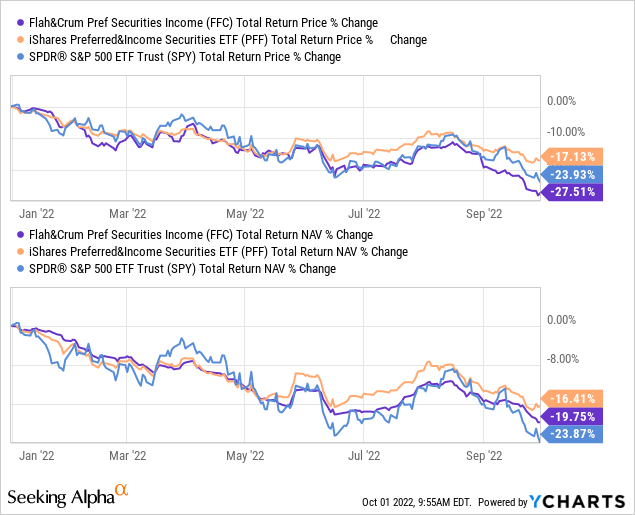
When you think of preferred, you’d generally think of an asset that is a bit safer than common stocks. That is generally true, but with the closed-end fund structure, we have other parts turning too. For one, the discount widened significantly, which pushed the total share price return YTD to a drastic turn lower when compared to SPY and PFF.
Ycharts
On a total NAV return basis, FFC has held up better than SPY. It had faltered below PFF, but that’s where leverage seems to be playing a role. With that being said, consider how highly leveraged FFC is, and one might have expected an even deeper drop relative to PFF. Perhaps a small comfort, but noteworthy nonetheless.
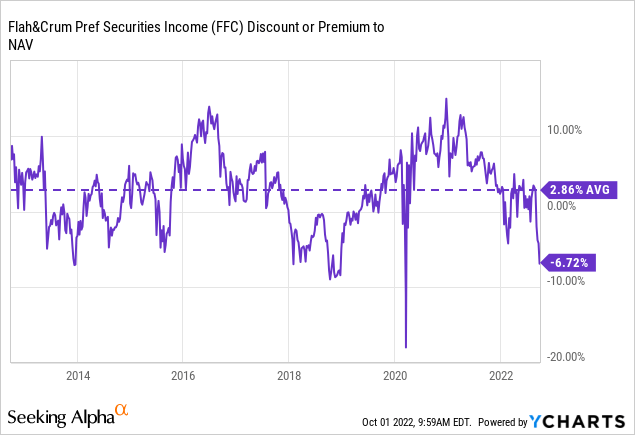
Below, we can see that over the last decade, the fund has sported an average premium. Over the last year, the premium became particularly elevated. While that premium wasn’t warranted, this current discount suggests that it could be fairly attractively priced. That would be in combination with the overall pressure on the fund due to declining values in preferred and fixed-income holdings.
Ycharts
Distribution – More Cuts Probable
One thing that F&C does is utilize a distribution policy where they announce every quarter what they feel is a sustainable level. That means paying out distributions with only what income is coming in. Some investors don’t find this appealing because it means a fairly constantly changing distribution. Over the longer run, though, it can mean less erosion of the fund due to overdistribution.
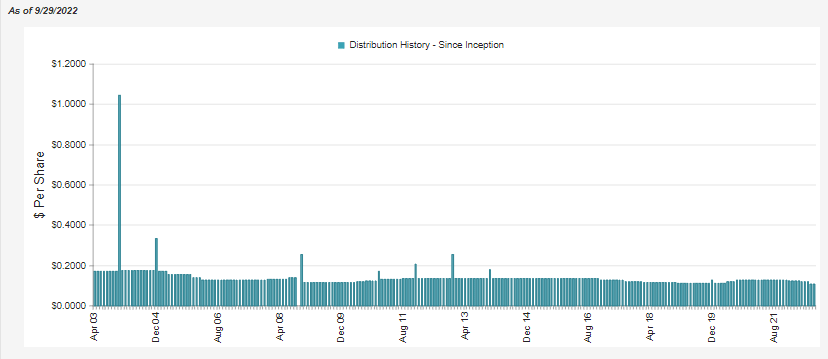
FFC Distribution History (CEFConnect)
The only time this will stabilize is if interest rates stabilize. That’s something we saw between 2009 and 2016. Basically, when rates were set to zero by the Fed to recover from the GFC. Most other periods have seen changes in their payout because we’ve been experiencing changes in interest rates.
These two things are highly correlated. That’s the driving factor behind why we started this year at a payout of $0.1265 monthly and are now at $0.1075.
With rates continuing to rise, we should expect more declines. In fact, in September, we saw that inflation came in hotter than expected. That was enough to boost the Fed’s expected terminal rate and send the market, as well as FFC, much lower.
One might note something interesting here if we look at the net investment income in the fund’s prior six-month report. The fact is that if we annualized the figure, it would have been higher than the previous fiscal year. However, there are two things worth pointing out.
First, it is for the period ending May 31st, 2022. Rates have continued to increase only further since that time. Thus, more increases in their interest expenses.
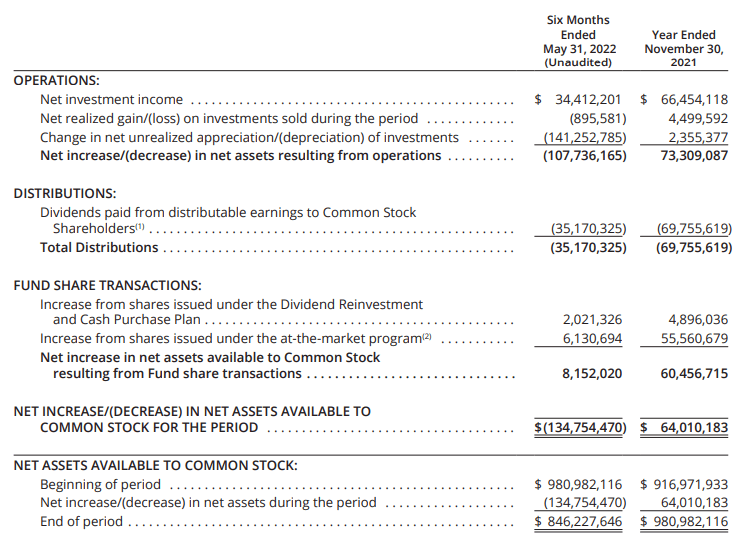
FFC Semi-Annual Report (Flaherty & Crumrine)
The second factor is the DRIP and ATM. Since the shares were at a premium, the fund was issuing significantly more shares. While that increases the actual raw NII figure, the NII per share figure came in at $0.72. If we annualized that, we would arrive at $1.44, dropping from the $1.45 in the previous year. And it is also a drop from fiscal 2020 when it was $1.46.
Annualizing the last six-month figure is fairly crude, as it doesn’t factor in any of the declines we should experience from higher interest rates. So when all is said and done, we should expect that fiscal 2022 will show an even further drop than $1.44.
When done at a premium, the dilution of new shares happening here is accretive to NAV. So it hasn’t been detrimental to the fund. If anything, it had helped slow down the pace of the decline. Now that the fund is at a discount, the shares being issued would have halted.
FFC’s Portfolio
The turnover of all the F&C funds is incredibly low. So much so that I haven’t covered FFC since last year, and the positioning hasn’t changed meaningfully. At that time, we were looking at the holdings as of June 30th, 2021.
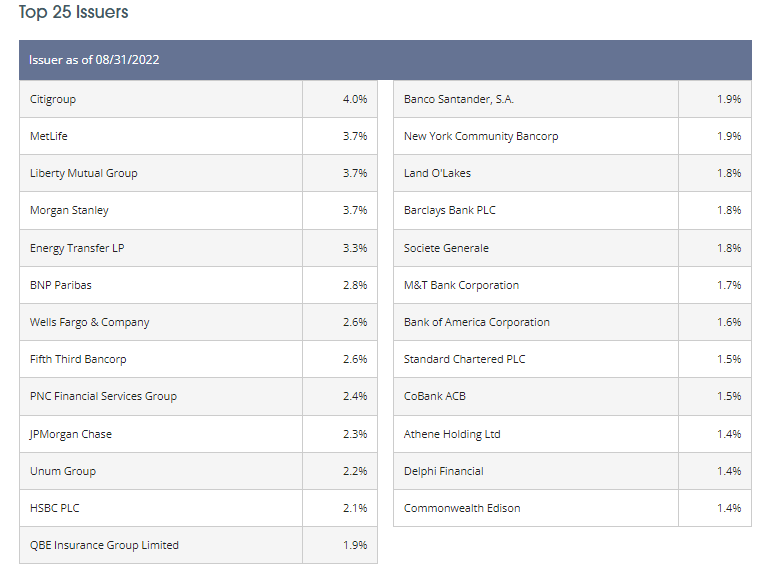
FFC Top Exposure (Flaherty & Crumrine)
Citigroup (C), MetLife (MET), Liberty Mutual Group, Morgan Stanley (MS), JPMorgan Chase (JPM) and Energy Transfer (ET) are all still among the top issuers of the underlying portfolio holdings. The position in JPM has moved lower, which looks to be partially responsible due to reducing their exposure.
Here are the JPM securities being held as of May 31st, 2022. PAR value of the holdings came to $29,921,000
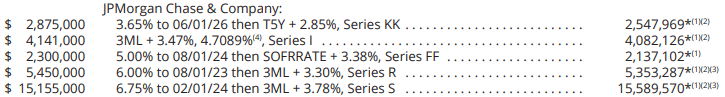
FFC Holdings (Flaherty & Crumrine)
Now here is a look at the May 31st, 2021 JPM exposure. The PAR value of the holdings was $47,827,000 at that time. The same holdings are present, but a reduction in the Series KK and Series I accounted for the change in weighting.
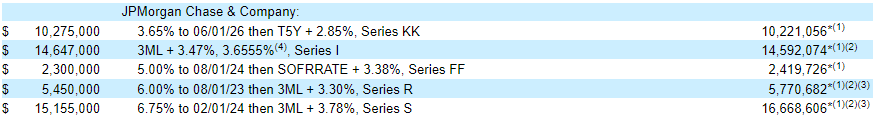
FFC Holdings (Flaherty & Crumrine)
This is also a good example of where the floating rate exposure can be coming in to help the fund’s income generation. The Series I yield went from 3.65555% to 4.7089%.
The bulk of the portfolio remains heavily weighted towards banks and insurance companies. This tends to be the case as financial institutions tend to be issuers of preferred. Before adding further GFC-driven regulations, this was even more so the case, but regulation changes made it somewhat less appealing.
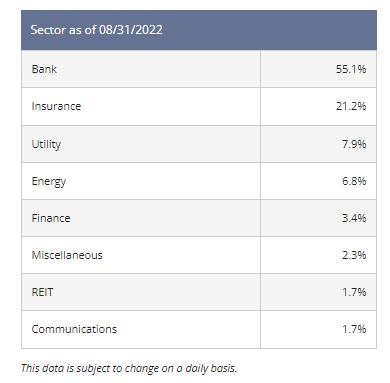
FFC Sector Weightings (Flaherty & Crumrine)
Conclusion
FFC seems to be drifting lower to an attractive discount as one of the largest negative z-scores. That could create an opportunity for a long-term income investor to start nibbling into a position. If inflation continues to persist, the Fed will remain aggressive towards raising rates. That is the main risk for FFC and other fixed-income funds; if interest rate expectations rise, these will all be sent sharply lower again.