Exxon Stock: How Much Higher Can It Go? (NYSE:XOM)
Win McNamee/Getty Images News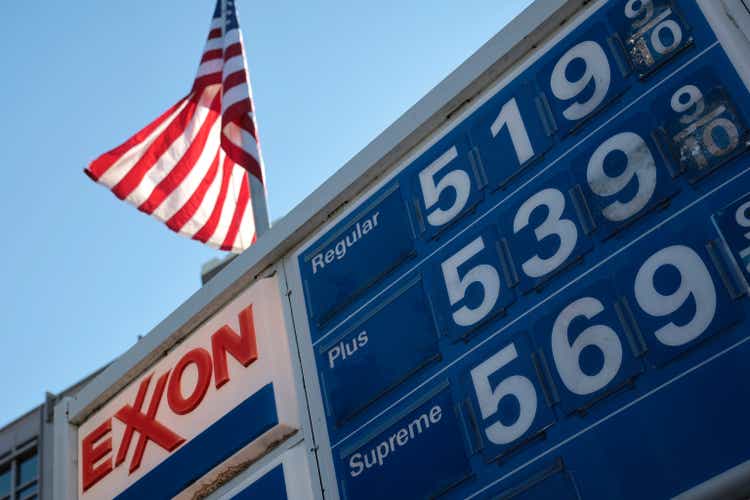
Introduction
2022 has been a great year for oil stocks like Exxon (NYSE:XOM). After the oil crash of 2020, ESG initiatives, and a growing distaste for oil companies, investments in the industry dried up and left the world undersupplied with oil, causing prices to soar.
As one of the largest producers of oil, Exxon has been one of the largest beneficiaries too:
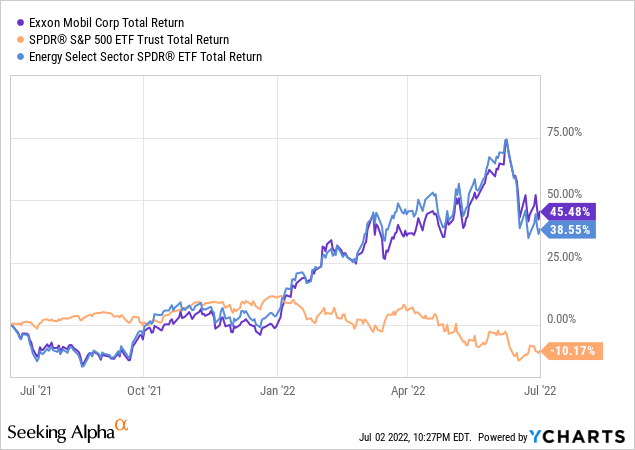
Since Exxon’s 2020 low of around $33 a share the company’s stock price has nearly tripled, that’s after its recent retreat down from the $105 level, settling back down to $88.
But, as investors, we’re faced with a conundrum: Exxon, and oil companies like it, are reaping record profits, profits that look set to continue due to record low investments, but could a potential recession turn Exxon into a losing investment? And furthermore, is Exxon the best investment among the major oil producers?
Within this article I’ll provide:
- An update on Exxon’s business and prospects
- A comparison of the financial performance of Exxon vs Peers
- A valuation of Exxon’s shares under different market environments
Exxon Business Update
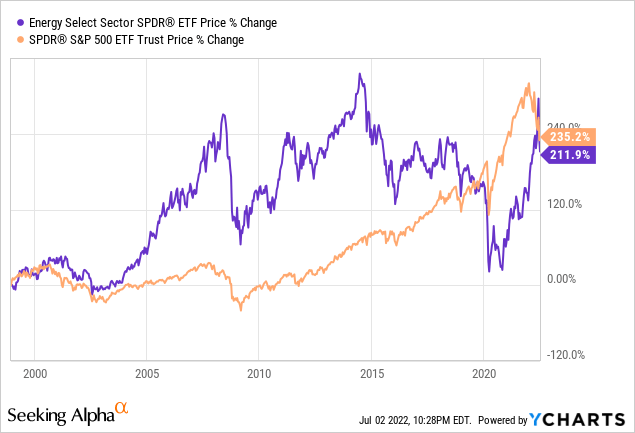
Exxon has been a major beneficiary of the recovery in global oil prices. After decades of underinvestment, and Russia-induced geopolitical uncertainty, oil stocks are shining once again. Finally, oil is back in vogue. (XLE) (USO)
In the first quarter of 2022, Exxon reported some stellar numbers. Cash flow from operations soared to $14.8B and excluding its Russia exit, earnings would have been up $6B from the prior year to $8.8B.
Adjusted for Russia, Exxon’s earnings went from $2.8B to $8.8B, which is nothing short of miraculous and speaks to the correlation between Exxon’s performance and the global commodities market.
In addition to the strong financial performance, Exxon likely made a few shareholders happy when they announced a $30B buyback through 2023 (roughly 8% of its current market cap). Add on to its 4% dividend yield, and Exxon looks set to return roughly 12% of its market cap to shareholders this year.
Outside of oil, Exxon is also active in a number of LNG projects around the world. LNG has become more important than ever as European countries are scrambling to replace Russian gas dependence.
Russian gas edging toward extinction in Europe | Business | Economy and finance news from a German perspective | DW | 11.03.2022 (DW)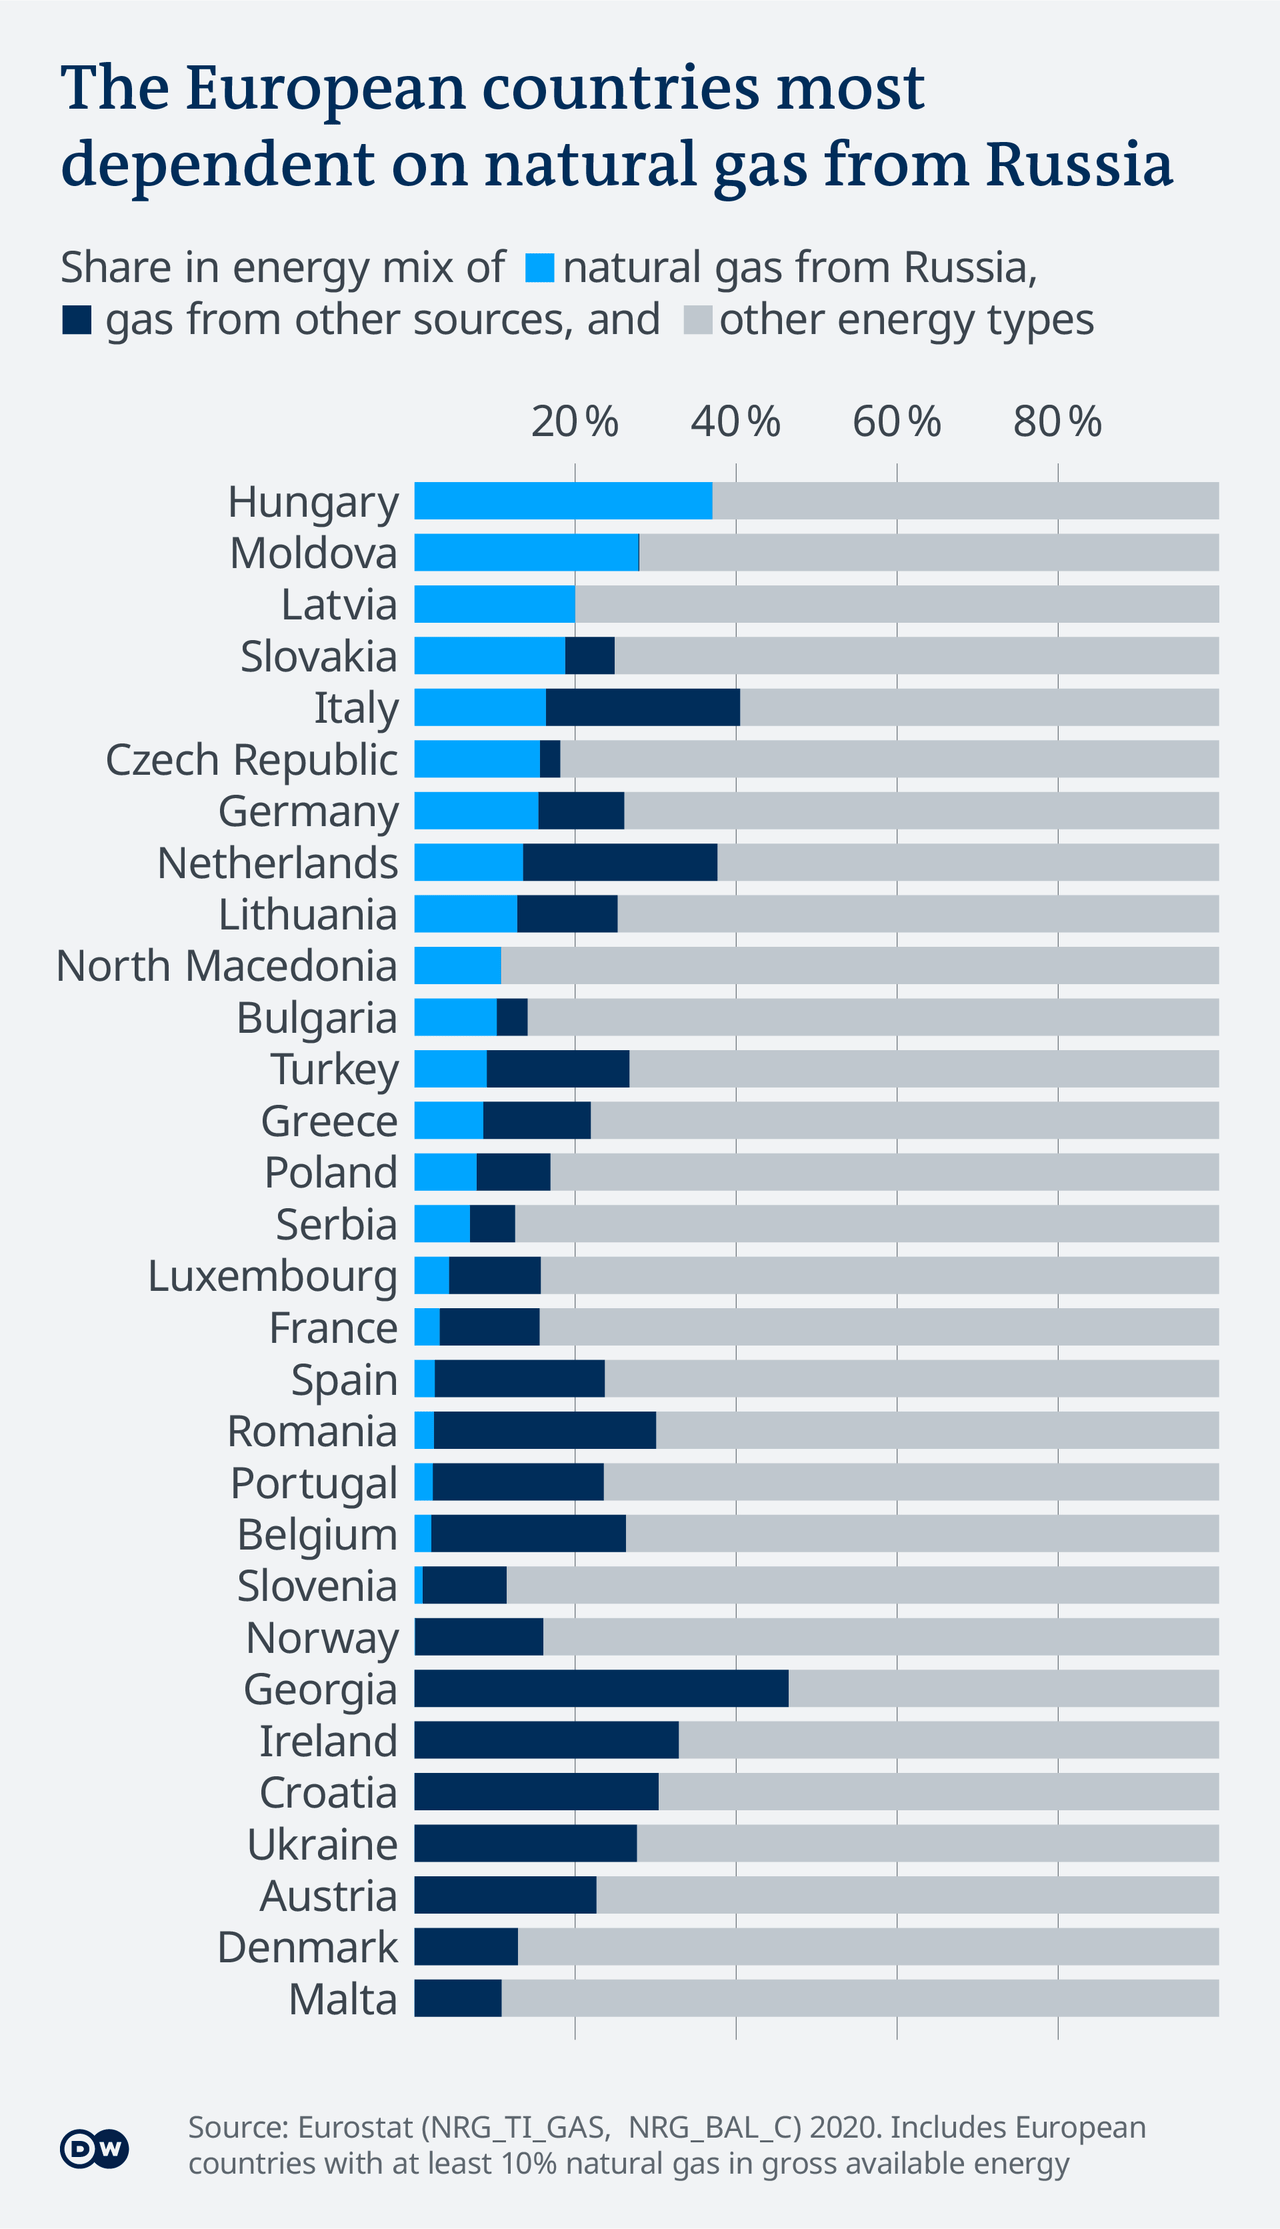
Countries like Germany are building new LNG terminals and looking to lock down additional alternative supplies. An LNG project can take years to plan and execute, meaning LNG, like oil, is likely to stay in short supply and expensive for some time, luckily Exxon is continuing to make progress on its LNG ambitions.
ExxonMobil continued to progress its global LNG growth strategy to meet growing worldwide demand for reliable gas supply. Commissioning of the Area 4 Coral South Floating LNG project in Mozambique is underway, with first production expected this year, and the company signed the P’nyang Gas Agreement in Papua New Guinea. Additionally, construction of the Golden Pass liquefaction facilities on the U.S. Gulf Coast remains on schedule.
Financial Analysis:
Moving forward to the financial analysis, let’s compare how Exxon has grown versus peers: Chevron (CVX), Equinor (EQNR), TotalEnergies (TTE), and Shell (SHEL).
Revenue and Earnings Growth
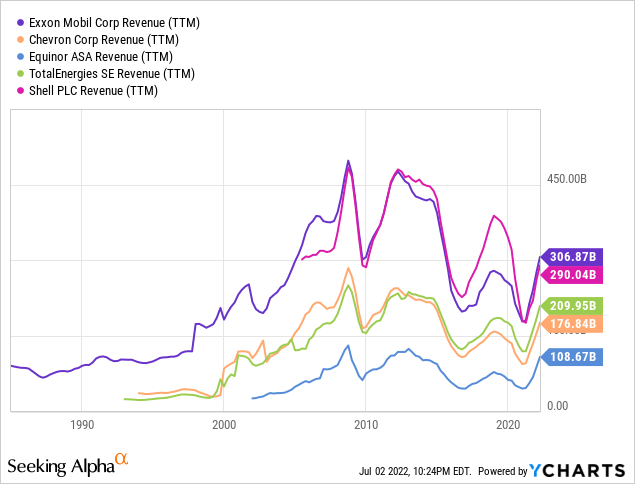
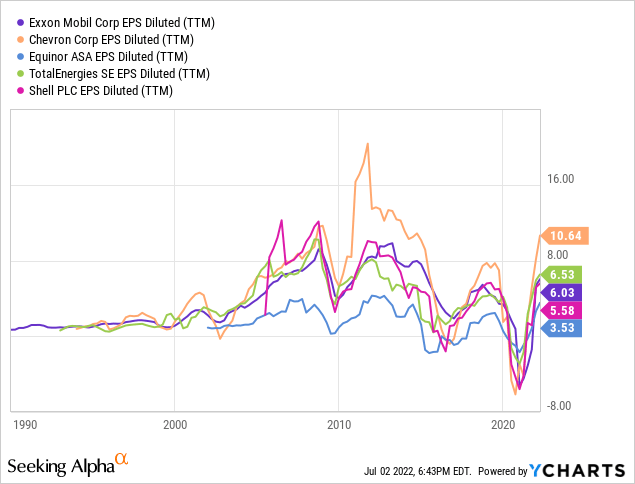
The oil industry has its good times, and it has its bad times. Nowhere is that more apparent than in the volatility of both revenue and earnings for these companies. Some of these companies have sizable non-petroleum operations (Total and Equinor), but they are still by in large reliant on global oil market pricing. Because of that connection, there are massive fluctuations in earnings and revenue from year to year.
This variability is undesirable as it makes forecasting future cash flows that much more difficult, because of this, I would expect an oil producer’s valuation to be lower than other stocks with more predictable cash flows.
Operating Cash Flow
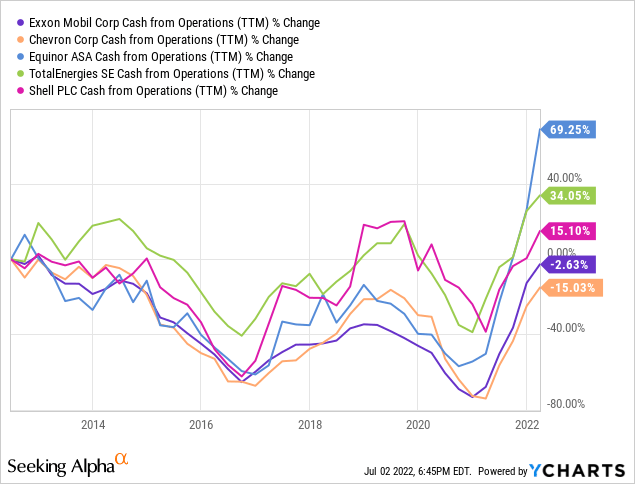
When evaluating companies, I also like to look at their operating cash flow. I find this useful because it shows us how much cash flow their operating business generated. Like the revenue and EPS charts, there is significant volatility in their operating cash flows.
Interestingly, the two US-listed companies on this chart, Exxon and Chevron, both ended the decade with less operating cash flow than when they started it, despite crude oil prices being higher now than they once were.
Equinor’s performance is particularly noteworthy, I’d wager that this is due to their site’s proximity to Europe which trying to wean off Russian oil and gas products.
US Crude 10-Year Chart:
Macrotrends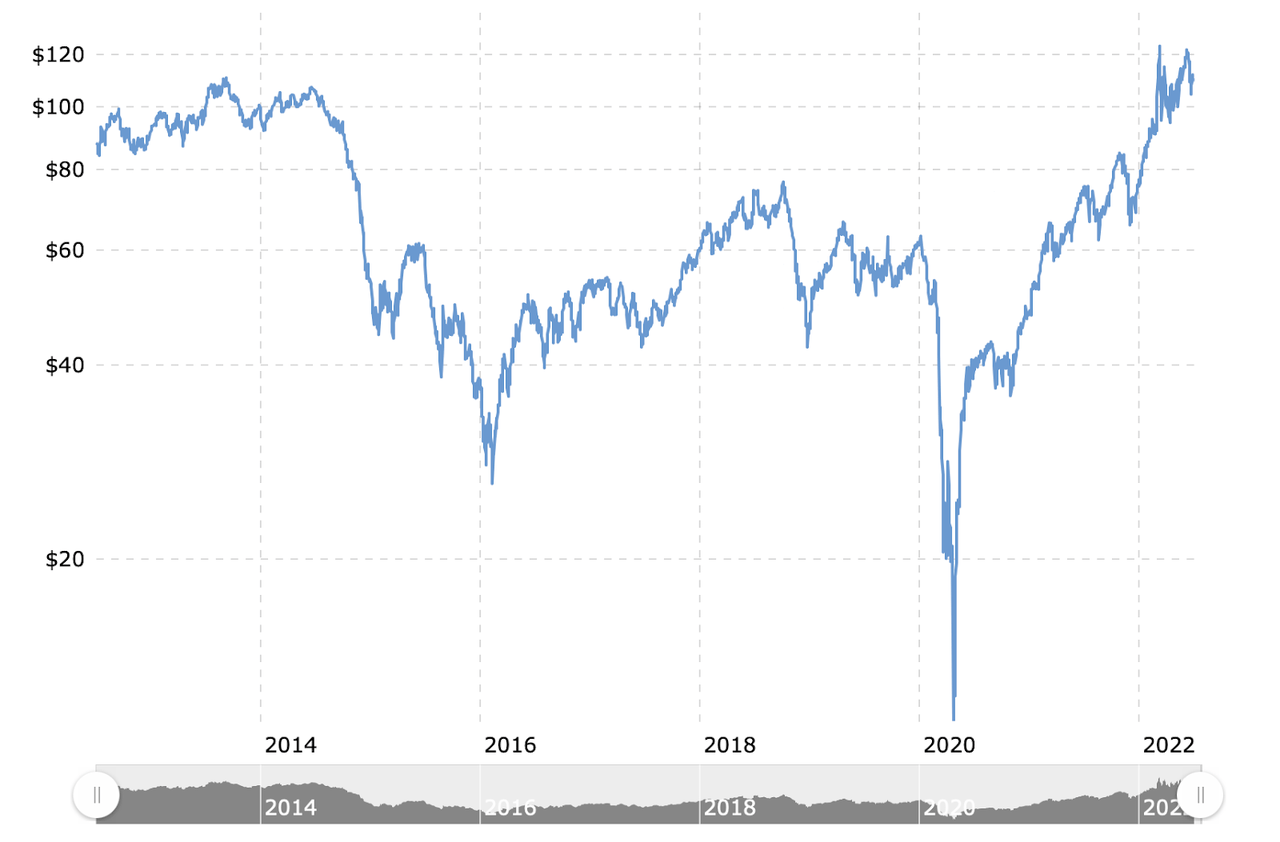
Return on Invested Capital
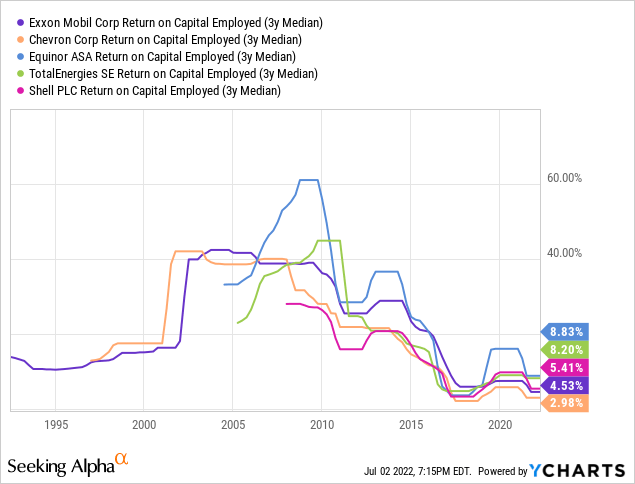
Return on Invested Capital for these companies has varied wildly over their existences.
In times like the 2000s with oil prices, investments into oil exploration and refineries yielded huge returns on capital (upwards of 40%!). But when oil prices are low, as they were the last two years, investments fail to break through single-digit returns.
I’m not a fan of this business model.
Exxon’s Correlation to US Oil Fund
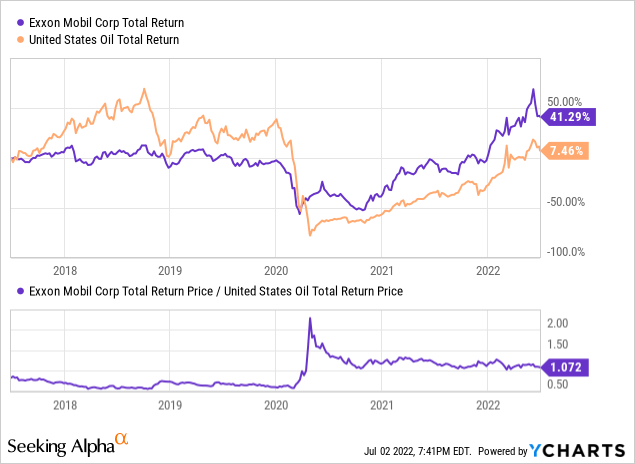
Given the strong correlation of Exxon’s earnings to oil prices, it’s no surprise the stock’s price is too. As you can see, over the last 5 years Exxon has exhibited an exceptionally strong correlation to the price of crude (estimated vis-a-vis (USO) ), especially during volatile periods like Spring through Summer of 2020.
This could be viewed as either a pro or a con, if you’d like exposure to crude oil it’s clearly a strength. But for myself, someone who prefers to invest in companies that are not as reliant on macro factors to succeed, I see this as a negative.
Valuation
There are many ways to value a company, but two of my favorites are the discounted cash flow analysis and comparing forward PEs vs peers. The reason I typically employ these two different models is that they help me accomplish a few different goals. First, using the forward PE analysis I can remove any biases I may hold (if I can identify the right peers). And secondly, in the discounted cash flow analysis I can adjust all the inputs to my expectations and account for growth much further into the future. Let’s start with the Forward PE analysis.
Forward PE Analysis
|
Company |
Current Stock Price |
EPS 2023 Est. |
2023 P/E |
|
XOM |
$88 |
$8.99 |
9.7 |
|
CVX |
$147 |
$14.77 |
9.9 |
|
TTE |
$53 |
$10.71 |
4.9 |
|
EQNR |
$34 |
$4.70 |
7.2 |
|
SHEL |
$52 |
$9.37 |
5.5 |
|
Average PE (excl. XOM) |
6.9 |
Source: Yahoo Finance, Analyst Expectations, and Authors Calculations
Looking at the chart above, we can see that Exxon is one of the most highly valued oil majors with a forward PE ratio of 9.7x. Based on the average analyst expectation, Chevron is the only oil major priced more richly at 9.9x.
Exxon’s European peers Total, Equinor, and Shell are all priced significantly lower than either Exxon or Chevron. In my view, this is likely due to the heightened regulatory environment abroad.
That said, at 9.7x. Exxon’s shares are not overvalued when compared to the market as a whole, especially tech stocks. In a prior article, I calculated that Microsoft’s (MSFT) forward PE is roughly 23x, so 9.7x could still be considered quite a bargain. But many will agree that Microsoft is likely to grow faster, and for longer than Exxon or an oil company. In other words, it’s a bit of a toss-up.
Share Price by Forward PE (Created by Author)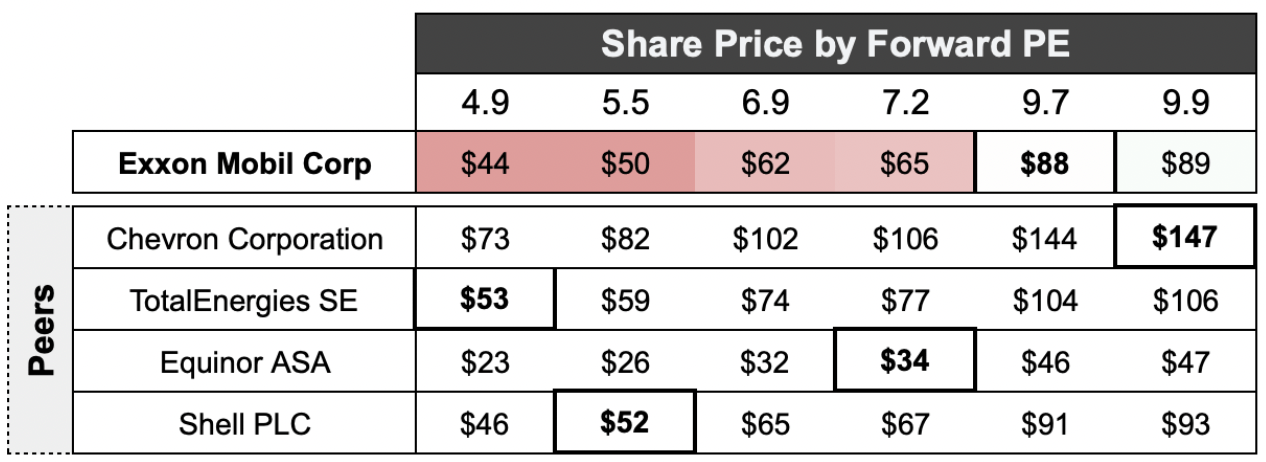
Speaking on a relative basis, based on my analysis, Exxon’s shares appear to be overvalued versus its peers. The average forward PE in this group worked out to be 7.2x earnings implying Exxon could trade down to $65 a share.
TotalEnergies looks to be the best value, if its shares are traded like Chevron, Total could see its shares double to $106.
Discounted Cash Flow Analysis
As I alluded, let’s see how Exxon’s valuation changes once you consider various future growth scenarios and discount rates. For my base case, I’m assuming no changes to the share count, a 10% discount rate, 1% revenue growth after 2023 through 2028 (analyst expectations for ’22 and ’23), and -2% thereafter.
|
2022 |
2023 |
2024 |
2025 |
2026 |
|
|
Revenue |
$442,520 |
$394,310 |
$398,253 |
$402,236 |
$406,258 |
|
Net Income |
$43,768 |
$37,871 |
$38,249 |
$38,632 |
$39,018 |
|
Cash Flow |
$39,000 |
$36,630 |
$36,996 |
$37,366 |
$37,740 |
|
Intrinsic Value per Share ($USD) |
$78 |
|
Current Share Price ($USD) |
$88 |
|
Upside Potential |
-10.4% |
Source: Yahoo Finance, Analyst Expectations, and Authors Calculations
Using the inputs from my base case, I come to a fair value per share of $70, a bit more than 10% below the current share price.
Given the environment of elevated oil prices and low investment in exploration, I believe oil prices could potentially be sustained over the medium/long term. But the oil market has been especially volatile since 2020 started which makes it especially difficult to predict where oil prices will go in the future.
Because of that, I included a few other growth scenarios using different discount rates.
Sensitivity Analysis
|
8% Discount Rate |
10% Discount Rate |
12% Discount Rate |
|
|
Bull Case: +5% Revenue Growth |
$125 |
$99 |
$81 |
|
Base Case: 1% Revenue Growth |
$95 |
$78 |
$67 |
|
Bear Case: -5% Revenue Growth |
$68 |
$59 |
$52 |
|
Terminal Growth Rate For: |
|
|
Bull Case |
0% |
|
Base Case |
-2% |
|
Bear Case |
-5% |
In my sensitivity analysis, three of nine scenarios work out to be money makers, largely depending on if the price of oil can be sustained/increase over time.
With Exxon, I think it’s prudent to form an honest evaluation of your own knowledge and ask yourself to what degree you understand the oil industry and where prices will go from here. Frankly, I’m not a macro-economic expert, because of that and my doubts in predicting future oil price trends, I require a higher discount rate to compensate me for the additional risk.
Risks
Speaking of risks, before I present my final price target and verdict on the company, let’s first consider some of the risks facing Exxon, and the oil industry writ large.
ESG: Stock prices are fickle. In the short term, prices can be affected by a myriad of factors, especially sentiment. As Benjamin Graham said:
In the short run, the market is a voting machine but in the long run it is a weighing machine.
But what happens when sentiment is permanently destroyed?
I wonder if that is perhaps what has gone on with oil stocks. Since the rise of ESG investing companies have been encouraged to embrace “stake-holder” capitalism whereby the companies should place equal weight on all stakeholders, including the environment. While I don’t personally buy into this philosophy, it seems clear to me that many investors do.
As a result, ESG has cast a shadow over oil companies, often blaming them for much of what is wrong in the world. It’s actually led to some funds divesting from oil companies entirely.
If, over the long run, these ESG concerns are no longer relevant, then perhaps we could see a further appreciation in share price. Personally, I don’t expect ESG to go away anytime soon. And, based on that, I don’t see the earnings multiples ever coming back to where they once were.
Regulation: Another headwind facing oil companies is regulation, now more than ever. Some countries in Europe have implemented so-called “windfall” taxes on oil companies to tax them at an increased rate now that prices are high again. To say nothing of the environmental regulations, it should be common sense that regulations desensitize further investments to increase supply.
So perhaps regulation could be a tailwind as it will cause higher oil prices… But even in that case, I think it’s probable the primary beneficiaries of that would be non-democratic countries that can more easily ignore societal demands.
Recession: I’ll keep these last couple of risks succinct. Recessions lead to demand destruction. As demand is destroyed less oil is consumed across the entire global economy. Less travel being done, fewer goods being produced and transported, etc.
This is especially worrisome given the Fed’s mandate of price stability and the ongoing QT which may cause a recession.
Electric Vehicles: The rise of electronic vehicles could threaten the long-term oil demand. First are cars, next will be semi-trucks, and then later we could see planes and boats shift towards electric. As renewable energy comes down in price, EVs will grow in demand. This will likely be a slow multi-decade shift, but it does appear we are at the beginning of a strong trend, at least in this author’s mind.
Conclusion
Exxon is the right company, for the right time. In the words of Sam Elliott, in the Big Lebowski:
Sometimes, there’s a man, well, he’s the man for his time and place. He fits right in there.
And well, Exxon is the “man” for this time. Inflation fears run rampant, and supplies for both oil and LNG appear to be with us for the long haul. Exxon is the company that can provide both LNG and Petroleum when we need it most. So their shares have rightly soared.
As far as financial performance goes, well, it’s checkered. They are performing well now. But how long will it last? Well, that’s anyone’s guess.
Supply is likely to be low for some time but the odds of demand destruction vis-a-vis a recession seem higher than they were earlier in the year.
Valuing Exxon was a particular challenge because so much of its future cash flows will hinge on commodity prices. With that in mind, my price target and recommendation will be based on the average forward PE in its group.
I rate Exxon a “Sell” with a 1-year price target of $65 a share.
At $65 a share, Exxon would be in line with the average forward PE in its peer group, 7.2x.
So, to answer the question is Exxon the best of the oil majors? Based on what I’ve seen, no. No, it is not. Its growth rate is relatively in line with its peers, but it trades for a higher multiple, I would rather invest in (TTE) or (SHEL) at these levels.
Thank You!
As always, thank you for reading.
I try to engage with all my readers, so if something has interested you, or if you have a question, please feel free to comment. I will do my best to get back to all of you with a response!
Which company do you think is the best oil major? Feel free to let me know.