Written by Nick Ackerman, co-produced by Stanford Chemist. This article was originally published to members of the CEF/ETF Income Laboratory on November 12th, 2022.
Eaton Vance Tax-Advantaged Dividend Income Fund (NYSE:EVT) continues to maintain the elevated trading level that it’s been showing now for the last five years. Before this, the fund traded at a wide and almost perpetual discount.
The latest shallow discount is quite surprising given the fact that they cut their distribution. For me, it doesn’t change my outlook on the fund, but it generally makes other investors lose interest. Therefore, I would have suspected the fund to drop to a deeper discount after the news.
Though going from a premium to a discount still brought down its 1-year z-score from an elevated level. With a negative z-score, it would suggest that based on the relatively short-term, it is a better deal now than it was previously. Also, being that equities across the board have come down through 2022 could add to its appeal at this time.
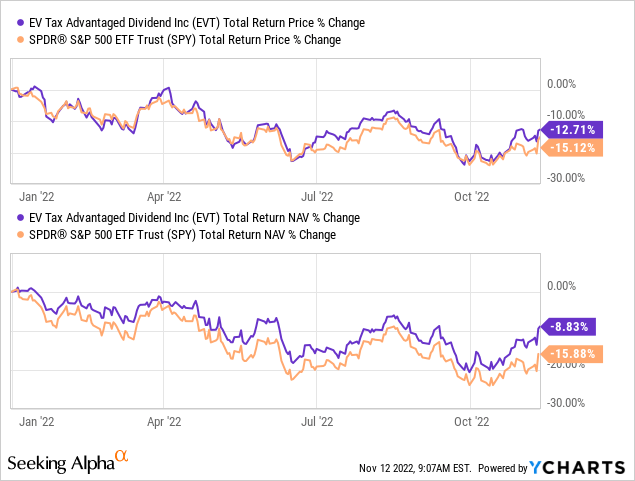
Since the update earlier in the summer, the fund has been performing similarly to the broader market. The latest inflation report showing a cooling propelled EVT and all investments up significantly in recent trading.
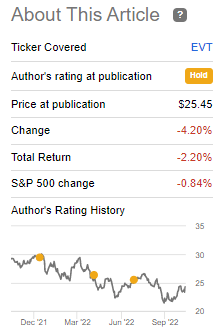
EVT Performance Since Previous Update (Eaton Vance)
The Basics
1-Year Z-score: -0.89
Discount: -1.42%
Distribution Yield: 7.32%
Expense Ratio: 1.10%
Leverage: 19.63%
Managed Assets: $2,277.4 billion
Structure: Perpetual
EVT focuses on “dividend-paying common and preferred stocks and seeks to distribute a high level of dividend income that qualifies for favorable federal income tax treatment.” They also include a “value investment style and seek to invest in dividend-paying common stocks that have the potential for meaningful dividend growth.” The investment objective is to “provide a high level of after-tax total return consisting primarily of tax-advantaged dividend income and capital appreciation.”
They mostly invest in the U.S. but have a small allocation to international positions, primarily in Europe. To meet this tax-advantaged objective, they will primarily use long-term capital gains and qualified dividend income to reduce the tax burden. This can make it more appropriate for a taxable account.
The fund is moderately leveraged, but this is still something to consider. In particular, the fund’s borrowings are based on a variable rate of 1-month LIBOR plus 0.50%. That means as interest rates are rising, the cost of their borrowings is also rising. That likely played a further role in the decision to make the distribution cut.
Performance – Maintaining Elevated Valuation
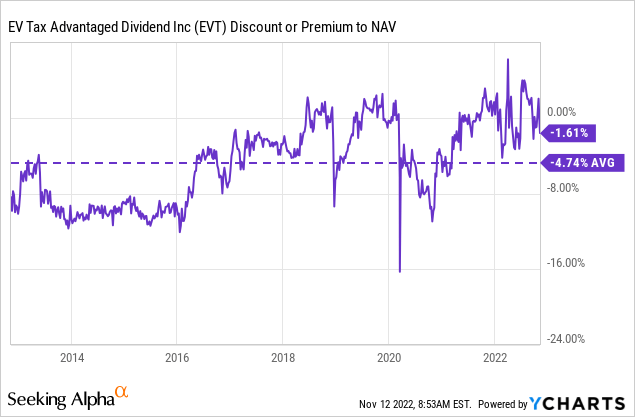
It hasn’t been since the COVID crash that EVT traded at a sustainable discount for an extended period of time over the last five or so years. Prior to that, we’d have to go to 2016 to see a similar 10% discount regularly. If we look at the longer-term average of the last ten years, we can see that the fund is still trading a bit elevated.
Ycharts
At the same time, the fund averaged a discount of only -1.84% in the last five years. Therefore, that could suggest that the latest decline is bringing it to a more interesting level. I originally initiated a position in EVT in 2020. I’ve even added to it a few times in 2022 in small increments.
While I wish it were a more substantial portion of my portfolio, I haven’t felt comfortable adding anything significant due to knowing the historical discount this fund had traded at. I would have presumed that the distribution cut would give a better opportunity, but the fund has remained resilient. Apparently, there are too many other investors that are thinking similarly to me that the distribution cut isn’t a reason to sell the position.
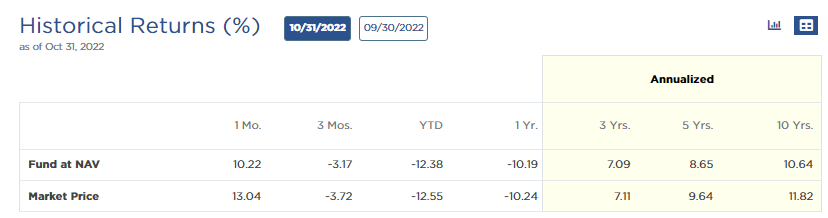
Looking back at the fund’s annualized returns over the long term, we see the fund has delivered some solid results. Of course, this has been helped considerably by a bull market that essentially went back from the GFC to the end of 2021. For 2022, the fund is struggling, just like most other investments.
EVT Historical Returns (Eaton Vance)
Distribution – Trim But Still Attractive
In my earlier update, I noted that the distribution could be at risk, but at around an 8% distribution yield, it was reasonable.
In my opinion, the ~8% level of the distribution also seems reasonable and sustainable. However, it is something we should monitor at this time. If the market continues going lower, that could put more pressure on the fund to maintain its distribution.
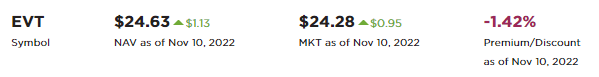
At the time of writing, EV hasn’t updated the NAV for EVT since November 10th.
EVT Discount/Premium (Eaton Vance)
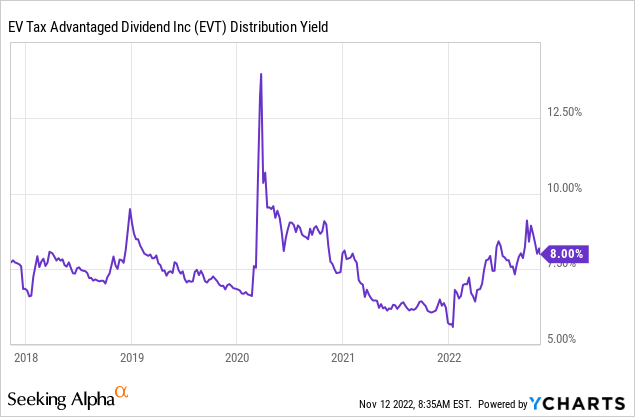
That means based on the new distribution of $0.1488, we would have a NAV distribution rate of 7.24%. We are at an attractive distribution yield of 7.35% on a market price basis. I would consider that reasonable and sustainable at this time. In fact, below, we can see that the distribution yield never became too elevated for that long.
In 2020, the COVID pandemic had the fund at a high yield for longer. However, that was also the last time the fund was at a significant discount for an extended period of time. Since that was the case, the NAV yield would have actually been lower during that period.
Ycharts
In my opinion, I think they cut EVT just because they were cutting most of their other equity funds. Since the declines haven’t been that substantial since my previous update, they could have been future-proofing cuts if they expected the market to remain weak. So they don’t have to go back and announce a distribution cut later. As mentioned above, the rising leverage costs are also likely to have played a role.
Still, I didn’t necessarily see EVT at a significant risk of a cut as I did with the other Eaton Vance funds. With the other EV funds, it made much more sense as they were getting near (and over) 10% distribution rates.
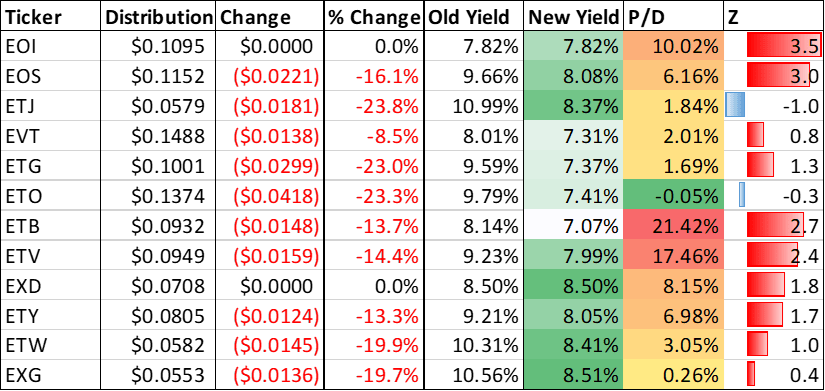
It was the smallest decrease at an 8.5% chop. That is if you don’t count Eaton Vance Enhanced Equity Income Fund (EOI) and Eaton Vance Tax-Managed Buy-Write Strategy Fund (EXD), that didn’t cut.
Here’s a great table that Stanford Chemist put together for comparison in his overview of the cuts.
Eaton Vance Distribution Changes (Stanford Chemist)
EOI’s yield never breached the 8% level. EXD’s distribution was at 8.5%, but they tend to run higher distribution yields on their option-based funds. Additionally, it was later announced that EXD would potentially be merged with Eaton Vance Tax-Managed Buy-Write Opportunities Fund (ETV).
For the distribution coverage, we don’t have a new annual report yet. That should be posted sometime near the end of December.
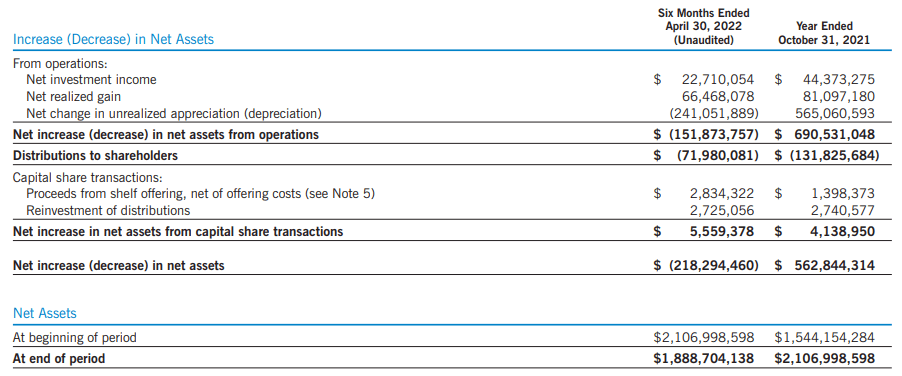
Seeing that they had covered the distribution is encouraging. NII coverage here is almost 32%, with the remainder being more than covered through the realized gains.
However, we shouldn’t ignore what we see going forward. It will still be challenging because we can clearly see the unrealized appreciation in the portfolio was significant.
EVT Semi-Annual Report (Eaton Vance)
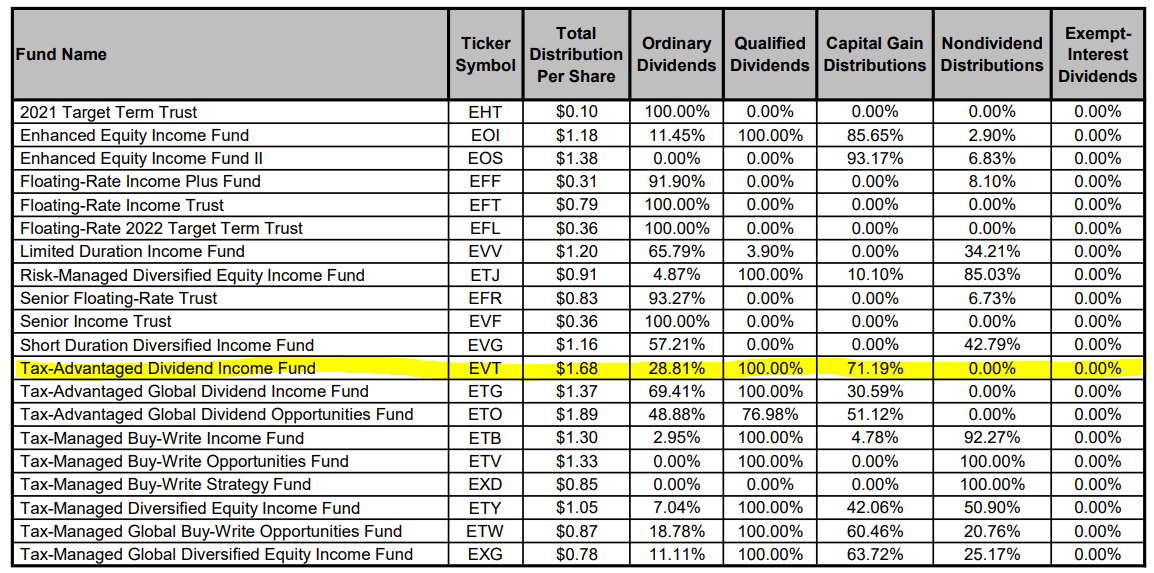
For tax purposes, the tax classifications reflect similar to the earnings with capital gains as a significant portion and a smaller amount of ordinary income. It is not exact, so it’s always good to still see the official tax breakdown. Here is a look at the 2021 distribution classifications. 100% of the ordinary dividends were considered qualified dividends, which is tax-friendly.
EVT Tax Classification (Eaton Vance)
With a new annual report at the end of December, we will get a better look at the distribution classification for 2022. It won’t be until later in 2023 that we will get a similar breakdown to what we have above. That will give us the official distribution classifications for the year.
Any other classifications one might be seeing for 2022 are simply estimates and may or may not reflect the final characterizations.
EVT’s Portfolio
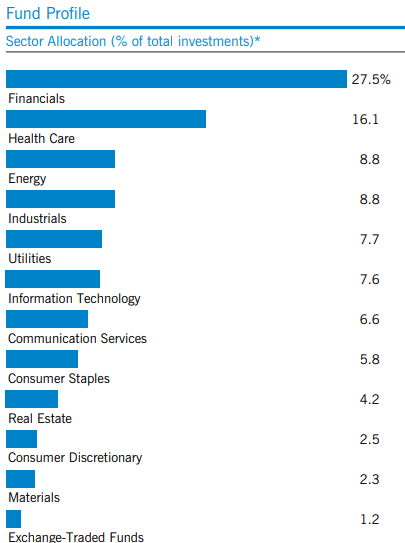
One of the main attractions for me in EVT is the overweight financial exposure and reduced exposure to tech. In fact, tech is a rather small allocation, relatively speaking. This helps balance out several of my other tech-heavy diversified funds and funds that I hold that are exclusively invested in tech exposure.
EVT Asset Allocation (Eaton Vance)
On a YTD basis, performance between EVT and the SPDR S&P 500 (SPY) shows us that EVT provided less of a decline on a total NAV return basis. The overweight tech exposure of SPY, which is still a hefty allocation even after substantial declines, has been a bit of a drag on this market barometer.
Ycharts
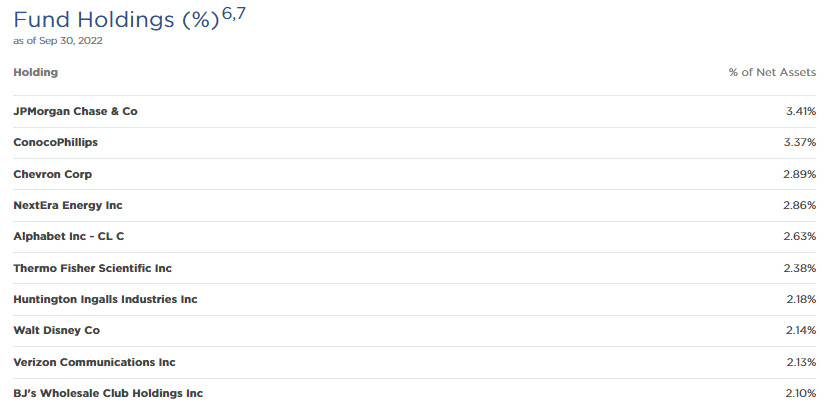
With the type of sector weightings we see above for EVT, it isn’t too surprising to see only very limited exposure to tech in the top ten. At the end of September, we only see Alphabet (GOOG) at a 2.63% weight. This was a position in the fund when we last looked at the fund too. In fact, at the end of May 2022, GOOG was exactly 2.63% weight at that time too.
EVT Top Ten (Eaton Vance)
JPMorgan (JPM) has remained the fund’s top allocation but has given up some of its weightings. It went from a 3.64% weighting to a 3.41% allocation. ConocoPhillips (COP) climbed up a spot replacing Johnson & Johnson (JNJ), which doesn’t appear in the top ten anymore. However, it remains in the portfolio at a smaller 1.86% weight.
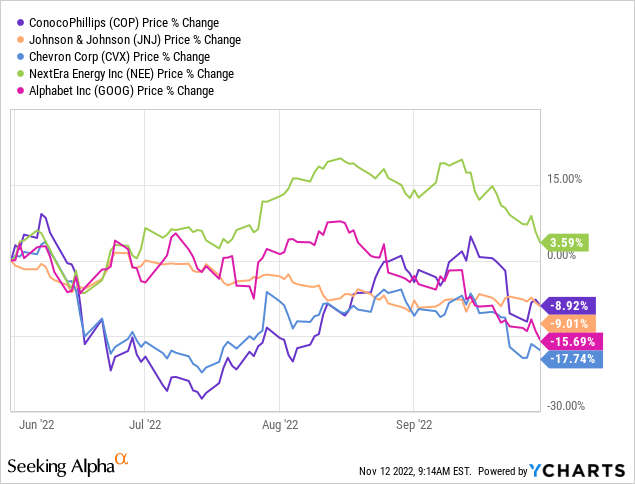
Chevron (CVX) has also climbed up a couple of spots, leapfrogging over NextEra Energy (NEE) and GOOG. Below is the price performance of these positions between the end of May and the end of September.
Ycharts
Despite NEE performing the best in this period, COP and CVX climbed to higher weightings. That could mean they added to these holdings and/or also reduced NEE exposure. JNJ falling off the list also suggests that they trimmed that position.
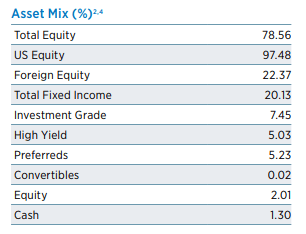
The fund has reduced its total equity exposure and added more fixed-income exposure since the previous update too. As interest rates rise, bonds become much more attractive as their yields also rise. They are also generally safer than equity positions. So this bit of transitioning makes some sense. In the last update, nearly 86% was in equity and 13% in fixed-income.
EVT Asset Mix (Eaton Vance)
Overall, the fund’s positioning doesn’t seem dramatically different. Leveraged EV funds are hybrid funds that aren’t necessarily restricted to investing in just equities. They hadn’t invested meaningfully in fixed income previously. Now that ‘TINA’ (there is no alternative) is seemingly over, it’ll be interesting to see how the managers play the shift. It is worth watching to see if they add more aggressively to fixed income.
Conclusion
EVT’s valuation has remained resilient after a distribution cut. The distribution cut was the smallest of those EV funds that did cut. I originally thought we would get more of an opportunity to add, as I’ve wanted to make it a larger portion of my portfolio. Still, looking back at a shorter period of time, it could suggest that there could be an opportunity to pick up some shares. If inflation continues to cool as the latest report suggests, that definitely bodes well for the overall market, which would take EVT up with it.