Written by Nick Ackerman, co-produced by Stanford Chemist. This article was originally published to members of the CEF/ETF Income Laboratory on October 13th, 2022.
Eaton Vance Risk-Managed Diversified Equity Income Fund (NYSE:ETJ) takes a different approach from many other option-writing funds. Instead, they implement a collar strategy where they write puts on the S&P 500 Index and then buy puts on the index as well. This is a very defensive strategy, which generally leads to ETJ holding up much better in turbulent markets.
Earlier this year, I mentioned how it “wasn’t being its usual self.” I had looked at the previous bear markets of the GFC and the COVID pandemic crash. At those times, ETJ had held up significantly better than its sister fund Eaton Vance Tax-Managed Buy-Write Income Fund (ETB) and the S&P 500 (SPY). ETB has the same focus of the S&P 500 Index that ETJ does but stops at just writing puts on the index.
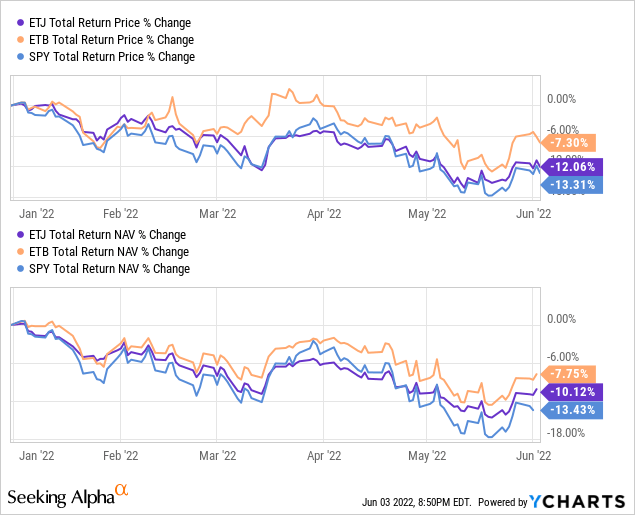
Here are the results that were seen earlier this year when we last took a look.
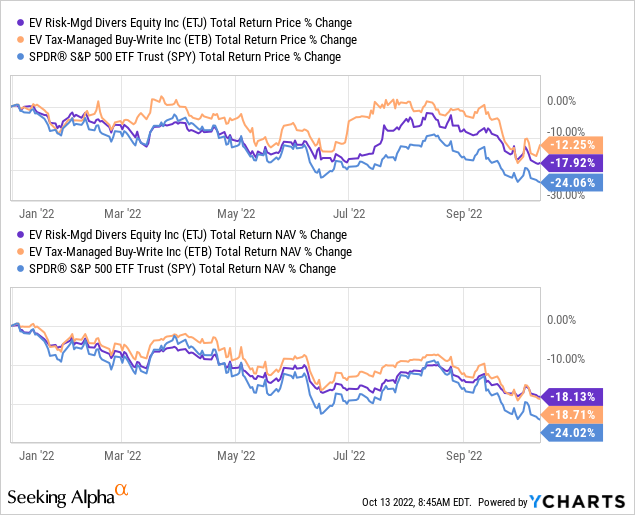
Finally, that leads us to 2022. So far, the protection just hasn’t been working out. Here is a YTD comparison of these three funds again. As we can see, ETB has been performing even better than ETJ – and they don’t even have that added layer of defensiveness of buying puts. To be fair, it is still outperforming SPY and providing some downside protection.
YCharts
One thing that stands out on why this could be happening is that while the portfolios might target the same index, they are seemingly holding quite different portfolios at this time. ETJ lists just 64 total positions, and ETB holds 181. On the surface, the broader sector weightings were fairly close, but the number of holdings clearly shows us there is quite a difference.
The picture has shifted a bit now that we are over three quarters into the year. It is the best performing of the three we showed above. It still isn’t holding up as well as it had historically, meaning it is still “not its usual self” for 2022. Now that we are winding down to the end of the year, it is unlikely to make up for the lost ground to change this outcome.
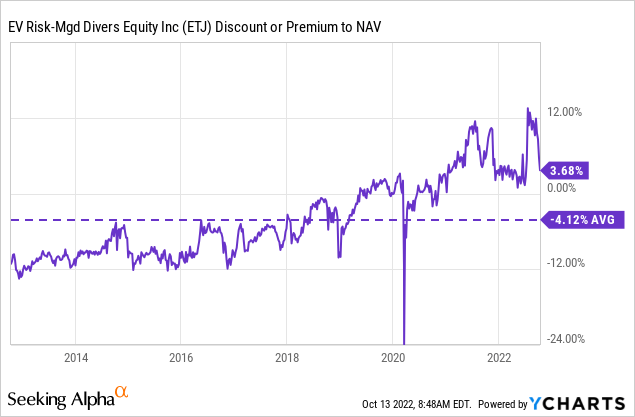
As the fund is still flirting with a premium, I don’t see it as a very attractive buy at this time, either. That is even though, more recently, a premium has been fairly common for this fund.
The Basics
1-Year Z-score: -0.52
Premium: 3.68%
Distribution Yield: 11.18%
Expense Ratio: 1.10%
Leverage: N/A
Managed Assets: $528 million
Structure: Perpetual
ETJ’s investment objective is “to provide current income and gains, with a secondary objective of capital appreciation.” They intend to do this through a “diversified portfolio of common stocks and purchase out-of-the-money, short-dated S&P 500 Index put options and sells out-of-the-money S&P 500 Index call options of the same term as the put options with roll dates that are staggered across the options portfolio.”
The fund’s expense ratio is relatively low for the closed-end fund space, a common theme amongst the Eaton Vance funds. The total managed assets here aren’t necessarily the highest of its Eaton Vance peers but still generate a fairly respectable average daily trading volume of around 145.7k shares. With no leverage on the fund, it can be seen as relatively more conservative than other leveraged equity funds.
Performance – Still Unimpressive, Relative To Its History
Past performance is no guarantee of future results. That appears to be the most applicable statement that is happening with ETJ. On a total NAV return basis, it is still only holding up relatively similar to its sister ETB.
YCharts
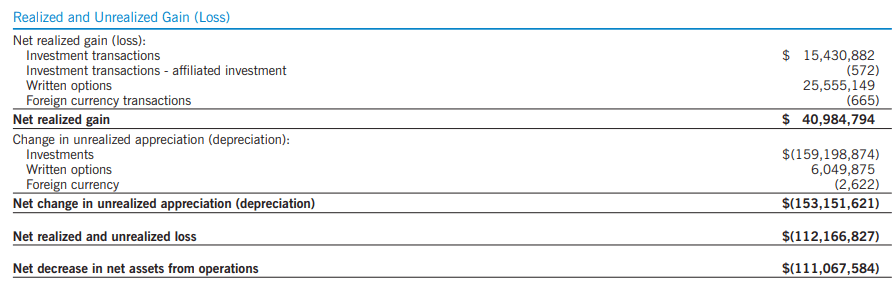
ETB doesn’t buy puts, which should be making some big profits for ETJ this year. To be fair, they realize sizeable gains, and their written options are generating even more gains for their portfolio. However, it hasn’t been enough to offset the unrealized losses from the underlying portfolio.
ETJ Semi-Annual Report (Eaton Vance)
When looking at the valuation of ETJ, the fund is still running hot. There has been a trend towards higher levels of trading for the fund, but historically, the fund has tended to trade at a discount.
YCharts
Distribution – Covered For Now
The fund shows an attractive 11.18% distribution yield. On a NAV basis, it is slightly higher at 11.59%. Any distribution over 10% sends up a red flag for me, especially for equity funds these days. I mentioned this previously too.
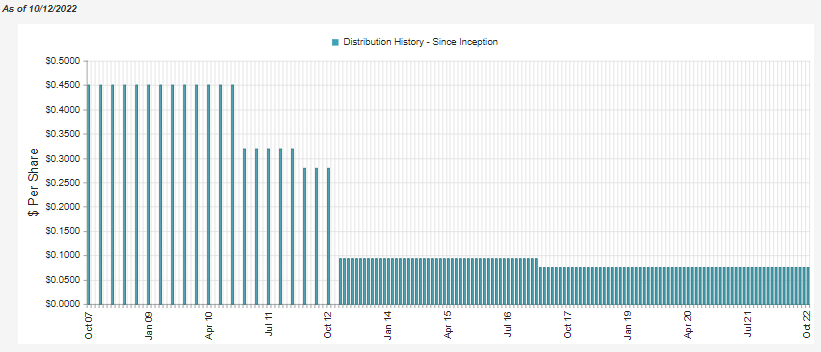
As a side note, for fixed-income funds, with yields surging, 10% isn’t actually too much of a concern anymore. Anyway, ETJ has paid a fairly steady monthly amount for years now. We see only one cut in the last decade.
ETJ Distribution History (CEFConnect)
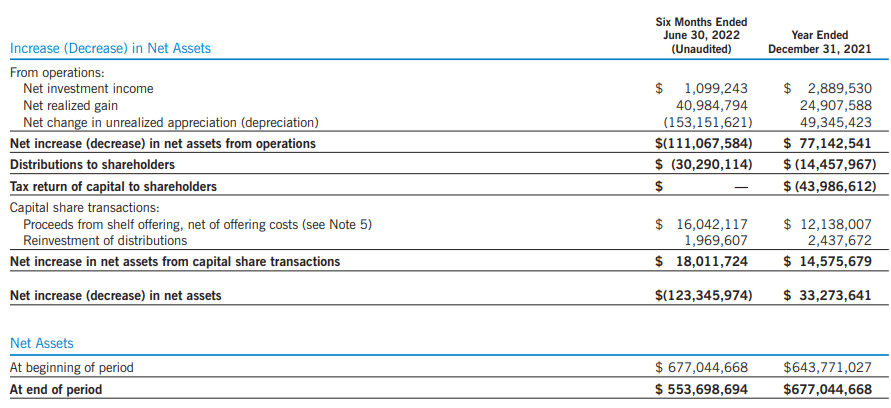
It is even comforting that the last semi-annual report they posted showed that the fund had covered its distribution with realized capital gains. The net investment income was even a bonus on top of this.
ETJ Semi-Annual Report (Eaton Vance)
However, capital gains can be harder to come by in a bear market when capital gains are required to cover equity fund distributions. For ETJ, they still benefit from written options contributing a significant source of capital gains and the puts they bought.
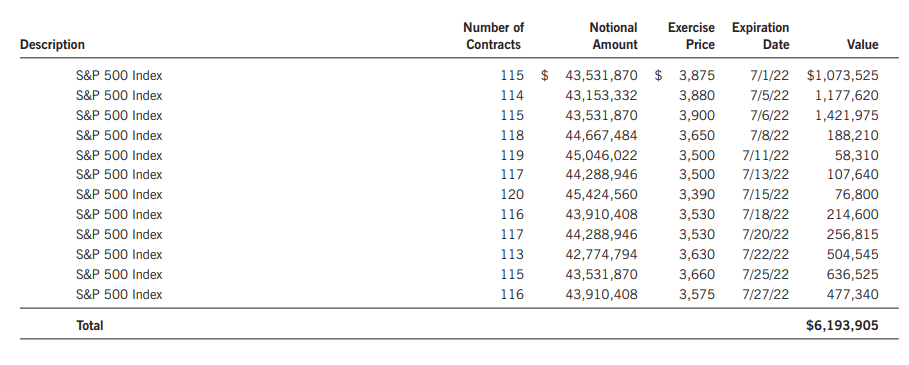
If we look at the last report, the value of the put contracts they had bought stood at nearly $6.2 million. These would have all been expired by now but gives us a glimpse at how the fund can be positioned at any given time.
ETJ Long Put Positions (Eaton Vance)
The continued losses in the index have helped ETJ so that these contracts would create more gains for the fund.
This is all encouraging, considering the options strategy has covered the payout for the first half of the year. Unfortunately, the decline still means losing value in the underlying portfolio for ETJ. Reduced assets overall will still impact the number of assets that can generate gains in the portfolio going forward. That would mean that distribution cuts could still be in the future, absent a recovery in the equity markets.
ETJ’s Portfolio
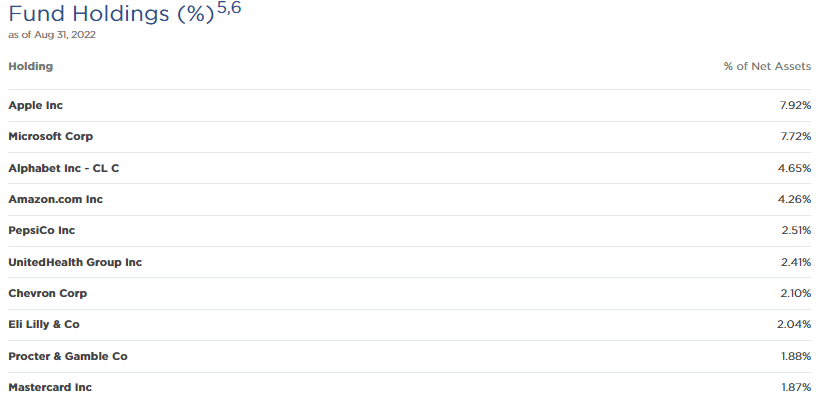
We highlighted mostly their options exposure through this article. However, their underlying portfolio is still important too. They run a fairly narrow portfolio, with just 65 holdings reported at the end of Q2. They focus heavily on the mega-cap MAMAA names – excluding Meta Platforms (META).
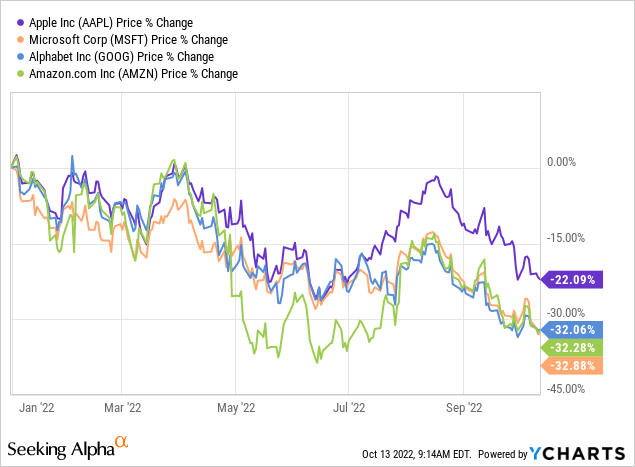
Microsoft (MSFT), Apple (AAPL), Alphabet (GOOG) and Amazon (AMZN) make up 24.55% of the portfolio. They are the four top holdings of the fund. In the S&P 500, these companies carry a 19.57% weighting when including the Alphabet Class A (GOOGL) shares.
This exposure is needed for their overall strategy of generating a return of capital, as we also discussed more in-depth in the previous article. Essentially, their portfolio is quite similar to the S&P 500, at least in the top holdings, as we highlighted with the mega-cap tech name weighting. Of course, with only 65 holdings, roughly 435 positions are missing.
ETJ Top Ten Holdings (Eaton Vance)
These mega-cap tech names haven’t been immune to the losses we see everywhere else. Considering their significant weighting in the “market,” this makes sense. AAPL has held up relatively better but has still fallen over 22% YTD.
YCharts
Conclusion
ETJ has now eclipsed the performance of ETB and SPY on a YTD basis. This was a change from earlier this year, when the fund was underperforming its less defensive sister fund, ETB. Of course, this still has meant strong losses on a YTD basis. Their option strategy has meant they held up better than SPY but not materially. This is especially true of ETJ, where historically, this fund had reduced losses meaningfully. This year has been a divergence from that historical trend.
This isn’t an article meant to bash ETJ, but just simply highlighting how the rather lackluster performance relative to its own history. Along with the fund’s slight premium, I don’t see it as a buy at this time.