DON: A 2.73% Yielding Mid-Cap ETF With Solid Fundamentals
Ayman-Alakhras
Investment Thesis
The WisdomTree MidCap Dividend ETF (NYSEARCA:DON) is the most established and diversified mid-cap dividend ETF available, currently featuring a 2.73% yield with a 0.38% expense ratio. In my view, the ETF is in reasonably good shape today, sporting a cheap 13.90x forward earnings valuation, an impressive 16.03% earnings growth rate, and stronger earnings momentum than other mid-cap value ETFs like VOE and IMCV. This article will present DON’s fundamentals alongside them and makes the case that it’s a solid choice compared to these cheaper alternatives.
ETF Overview
Strategy Discussion
According to company presentations, WisdomTree’s investment philosophy centers around the concept that the market-cap-weighting method is flawed and that fundamentals matter. I don’t entirely disagree, but I would add the word “sometimes” to that statement. For the better part of the last decade, most market-cap-weighted Indexes outperformed, and there were plenty of years when fundamentals mattered less (i.e., 2009, 2020-21). In my view, it does investors no good to ignore market sentiment. Generally, fundamentals are ignored in risk-on environments but valued in risk-off environments like today. That’s why rules-based funds like DON are outperforming market-cap-weighted ones like the Vanguard Mid-Cap Value ETF, VOE, this year.
Portfolio Visualizer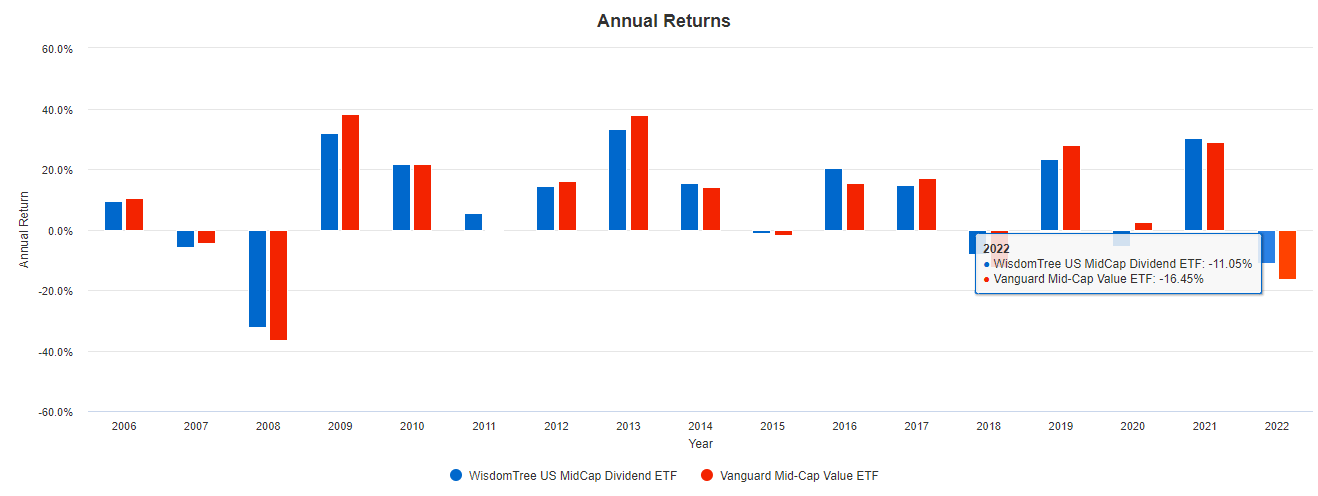
DON tracks the WisdomTree U.S. MidCap Dividend Index, selecting the top 75% of U.S. dividend-paying companies after removing the largest 300 by market capitalization. The approach is to calculate a Composite Risk Score (CRS) which evaluates stocks by quality and momentum. Quality is measured by one- and three-year ROA, ROE, GPOA, and CFOA. Six- and twelve-month risk-adjusted returns measure momentum. The Index is dividend-dollar weighted, but the riskiest stocks in the bottom 10% by CRS are excluded, as are the top 5% by dividend yield if they fall in the bottom half by CRS. Stocks in the top two deciles have their weights increased by 50%.
In my view, the selection approach is reasonable. My independent research confirms that high-quality stocks are less volatile and more profitable in the long run, and the highest-yielding stocks often produce the worst returns in any given year. I prefer a more aggressive approach to eliminate possible yield traps. VIG, for example, eliminates the top 25% by yield (15% for new constituents). However, WisdomTree wants to attract income investors, and assuming reducing the expense ratio is off the table, there’s only so much you can do before diversification becomes an issue.
Performance Analysis
There are only three other mid-cap dividend ETF alternatives: REGL, RNMC, and SDVY, which is technically a small- and mid-cap fund. However, other mid-cap value ETFs provide competitive yields. Here is how they’ve performed historically through September, alongside their expense ratios, AUM, and trailing dividend yields.
The Sunday Investor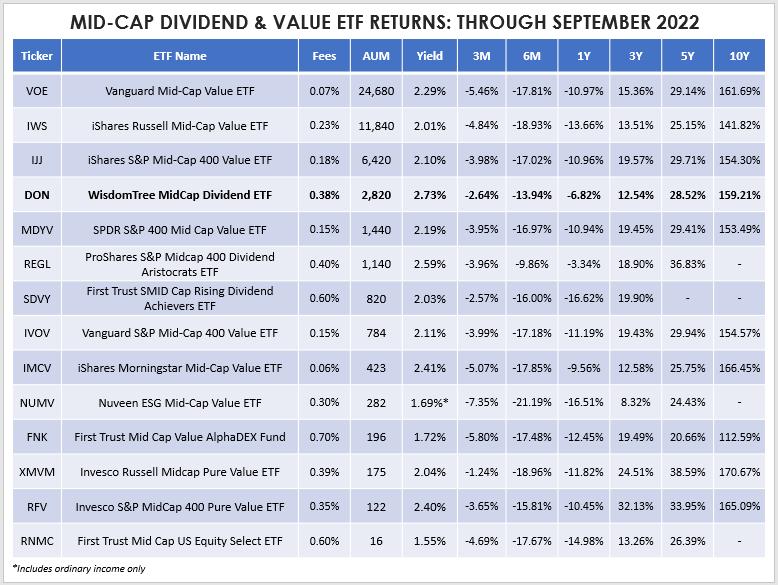
DON is the fourth-largest by AUM behind VOE, IWS, and IJJ, and its 2.73% trailing dividend yield is the highest. Last quarter, DON lost 2.64%, slightly behind SDVY and XMVM, but its returns were less impressive over the last decade. DON’s 159.21% ten-year gain is only average, and investors may be tempted to stick with cheaper alternatives like VOE and IMCV. However, the last decade may not best represent the current environment. Results before 2012 were more favorable.
The following graph highlights how DON gained an annualized 8.10% since September 2006, outperforming VOE and IMCV despite the higher fees. These results lend support to DON’s strategy working. Looking at the results by year, I noticed that DON’s best years were in three negative years for the market (2008, 2018, 2022), outperforming by 3.88%, 3.44%, and 4.70% on average. It also outperformed by 6.84% in 2011 when VOE effectively broke even. In contrast, DON underperformed by 4.89%, 6.50%, and 4.52% in 2009, 2013, and 2020. These are the types of results you can expect with DON. It seems best built for flat or declining markets and should still deliver an above-average income stream while investors wait for a recovery.
Portfolio Visualizer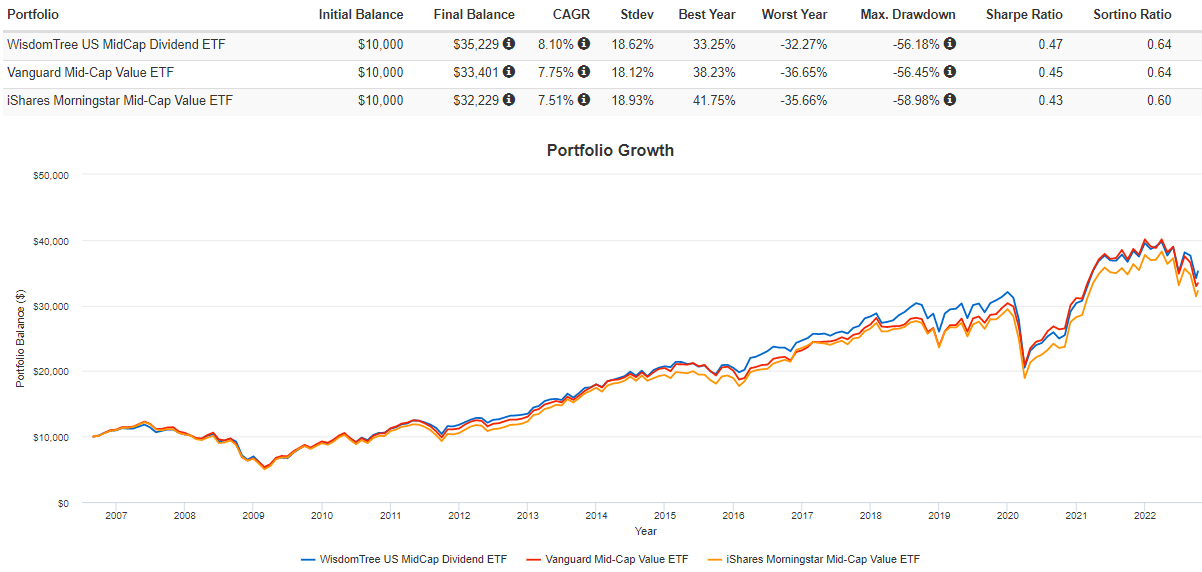
ETF Composition And Fundamentals
Sector Exposures And Top Holdings
The following table highlights DON’s sector exposures alongside MDYV, VOE, and IMCV. What stands out is a 10.05% exposure to Energy stocks, likely due to high scores on the momentum and last year’s quality factors. DON also overweights Financials (23.84%) and Materials (9.33%), evidently at the expense of Technology (2.76%). Technology companies, especially mid-cap ones, aren’t known for their high dividends, and the negative six- and twelve-month momentum trends only make the total exposure to this sector smaller.
Morningstar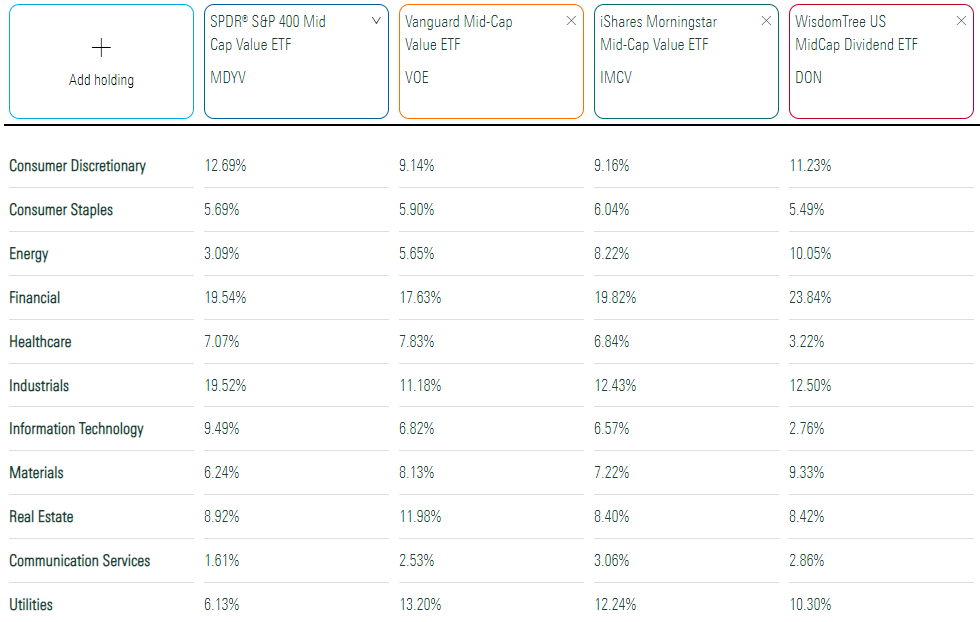
WisdomTree lists DON’s top ten holdings below, totaling 12.30% of the ETF. It’s well-diversified, as are most mid-cap funds because outliers are limited. For example, the WisdomTree U.S. Dividend Growth ETF (DGRW), reviewed here, also follows a dividend-dollar weighting scheme but has over one-third of assets in the top ten.
WisdomTree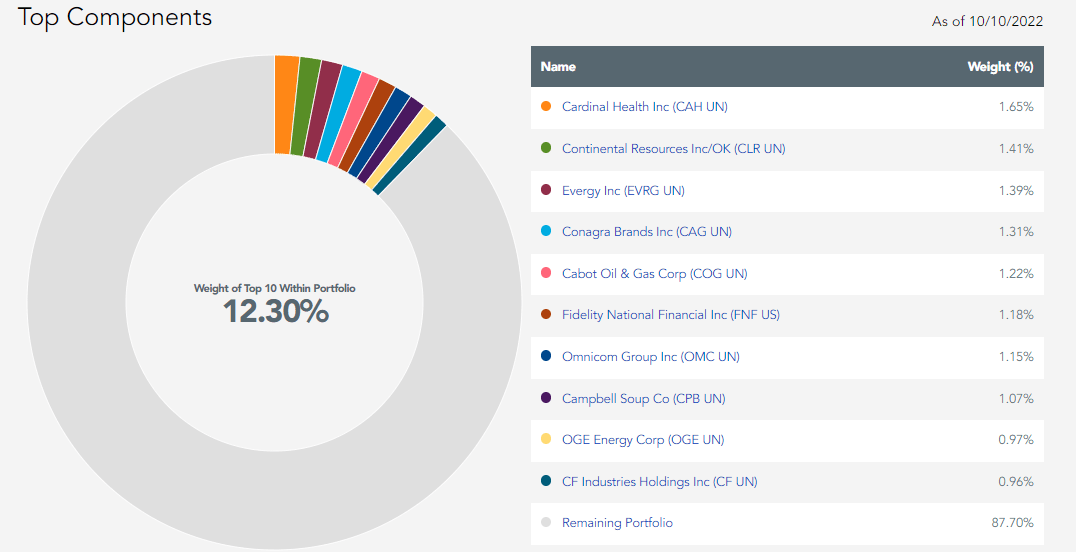
Industry Fundamentals vs. VOE & IMCV
The following table highlights selected fundamental metrics for DON’s top 25 industries, which total 65.37%. You can see it’s slightly less diversified than VOE and IMCV, but not by much. It’s also the most volatile of the three, with a 1.09 five-year beta.
The Sunday Investor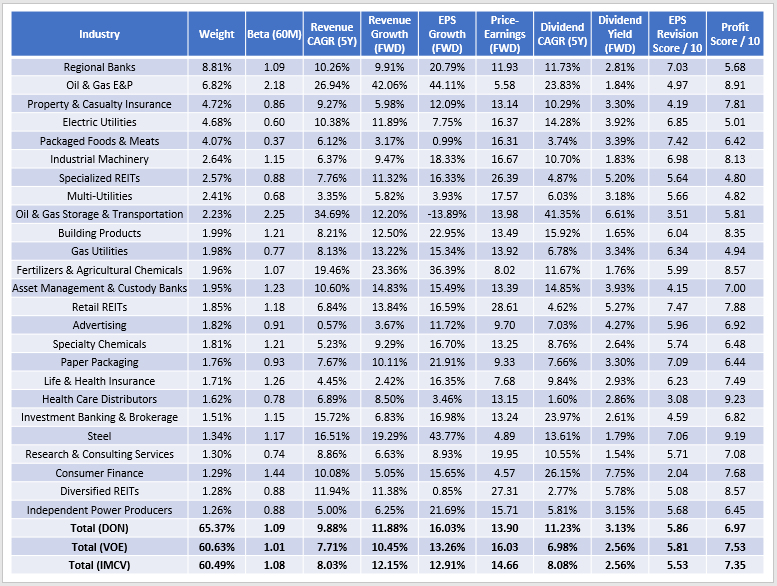
DON scores well on virtually all metrics except for profitability. Based on Seeking Alpha’s grading system, I have calculated a normalized score of 6.97 vs. 7.53 and 7.35 for VOE and IMCV. One key reason is that mid-sized Regional Banks are prominent in DON, accounting for 8.81% of the portfolio. These fast-growing, generally cheap stocks have a profitability score of just 5.68 / 10; notably, none of the 28 stocks are in VOE. DON’s weighted-average market capitalization is just $9.71 compared to $22.69 billion and $20.52 billion for VOE and IMCV, so I think the size factor largely explains the differences in profitability.
Nevertheless, DON scores well in most other areas. Its constituents are faster growing both in sales and earnings. DON’s 9.88% five-year sales growth rate trumps the 7.71% and 8.03% figures for VOE and IMCV. Regional Banks are part of this, but so are the higher allocations to Energy stocks. Estimated sales growth is also solid at 11.88%, and DON’s estimated 16.03% earnings growth rate is terrific for any dividend or value ETF.
DON also trades at an attractive 13.90x forward earnings valuation. It’s at least in part because of higher exposure to Regional Banks. However, analysts favor that industry now. DON’s top six Regional Banks have a C+ EPS Revisions Score at minimum, which is good considering that the median score for mid-cap value stocks is between C and C-. All stocks in this industry are scheduled to report over the next three weeks.
Seeking Alpha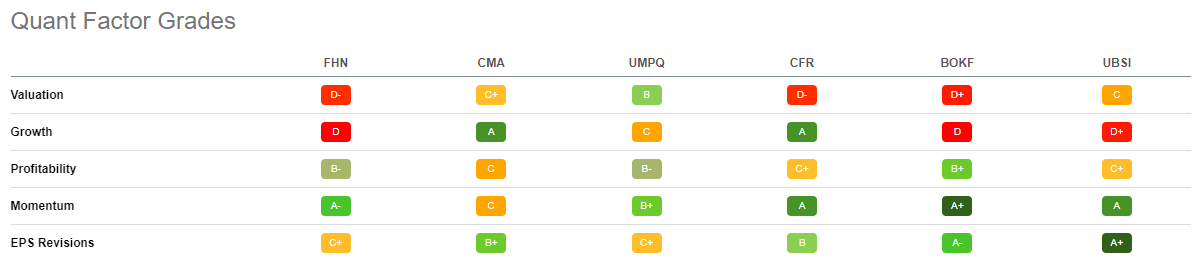
Dividends
Finally, I want to add more color to DON’s dividend features. As mentioned, I don’t think the 2.73% yield is a big draw, and if the expense ratio were slightly lower, it would have a chance at hitting a more palatable 3.00%. Its constituents currently yield 3.13%, which should translate into about 2.75% after expenses. VOE and IMCV each have 2.56% gross yields, but with expense ratios of just 0.07% and 0.06%, the yield gap will probably only be around a quarter of a percentage point from now on.
Seeking Alpha gives DON a B+ overall Dividend Grade, and notably, its five-year dividend growth rate of 5.78% is relatively low. My fundamental analysis above, which looks at current constituents rather than historical results, puts that figure much higher at 11.23%. Several factors influence an ETF’s distributions and growth over time, including portfolio turnover, but my view is that DON’s current composition lends itself to more substantial growth as we advance. Its Energy holdings are much more profitable than they were over the last five years. DON’s top three industries have median payout ratios below 65%. If analyst estimates for future sales and earnings growth are remotely accurate, constituents should be able to grow dividends quickly. Investors have the opportunity to accelerate this growth, too, given how DON is the only mid-cap dividend or value ETF that pays monthly.
Seeking Alpha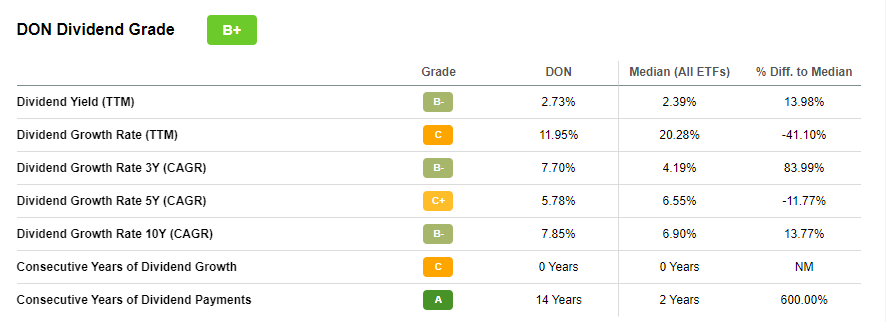
The Bottom Line
DON’s primary weaknesses are a high 0.38% expense ratio, an uninspiring 2.73% dividend yield, and a weak profitability score of 6.97 / 10. However, its long-term track record is positive relative to broad-based mid-cap value ETFs like VOE and IMCV. I think it deserves the benefit of the doubt, especially considering how positive its fundamentals look today. DON has better sales and earnings growth than its competitors, trades at only 13.90x forward earnings, and enjoys a reasonably positive rating on Wall Street. As we enter the Q3 earnings season, I think this will matter, and if not, DON seems to be in good shape otherwise. I’m rating it a buy today and look forward to providing an update later this year.