DIA: The Perfect Storm (Technical Analysis)
Ryan McVay/DigitalVision via Getty Images

The bear growled because the employment numbers poked it in the belly and that aborted a very short bounce in this bear market. With employment running hot, the Fed will continue raising rates at a 75-basis point clip.
Investors are hurting, but consumers are still, blissfully, fully employed and spending, even though polls show they know the perfect storm is coming. That consists of high interest rates, high inflation, high unemployment, and poor earnings reports in 2023. In other words, we are headed into a recession, the market (NYSEARCA:DIA) is a leading indicator for that and that is why it is going down right now looking for a bottom. Where is the bottom?
As the chart below shows, a very short bounce in this bear market was abruptly aborted by the bad news of employment still remaining overheated. That forces the Fed to continue raising interest rates and bringing on a recession to cool inflation.
Here is the chart showing the aborted, brief bounce and the next support target of $280 for the DIA. We don’t know the bottom, but we think the bottom is still lower. The only signs of a weakening economy so far are in the sales bubbles for housing and cars. However, bursting a bubble is just bringing prices back down to normal, without creating a recession yet. The recession hits later.
Red Os Reversal Sell Signal (StockCharts.com)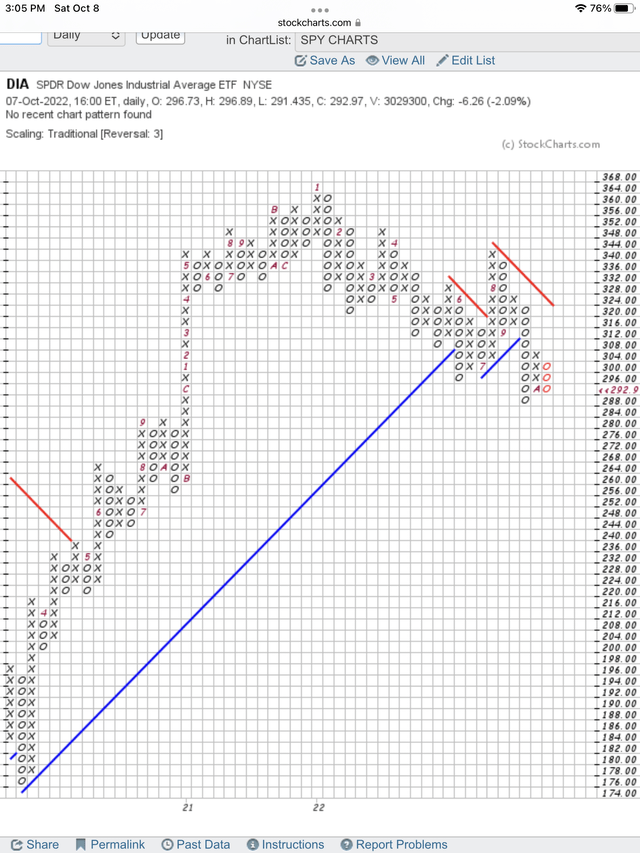
In the above chart, notice the red “Os” identifying the reversal drop in price and a sell signal. This reverses the previous column of “Xs” rising to identify price going up, during a very brief bounce in this bear market. The “A” in the “X” column identifies the beginning of the month of October. On the left side of this chart, you can see that previous columns of “Xs” were stopped at $280 resistance. On the way down, $280 becomes the next support level. The support level after that is $264.
Here is what our Buy, Hold and Sell signals look like for each individual stock in the Dow Index. Analyzing these signals tell us where the Dow is going short term and longer term. The signals are weak and getting weaker. This indicates to us that the DIA price is going lower both short term and longer term. The best scoring stocks are shown at the top of the list. The Sell signal stocks are shown at the bottom of the list.
Dow 30 Has 12 Stocks With OK Scores (StocksInDemand.com)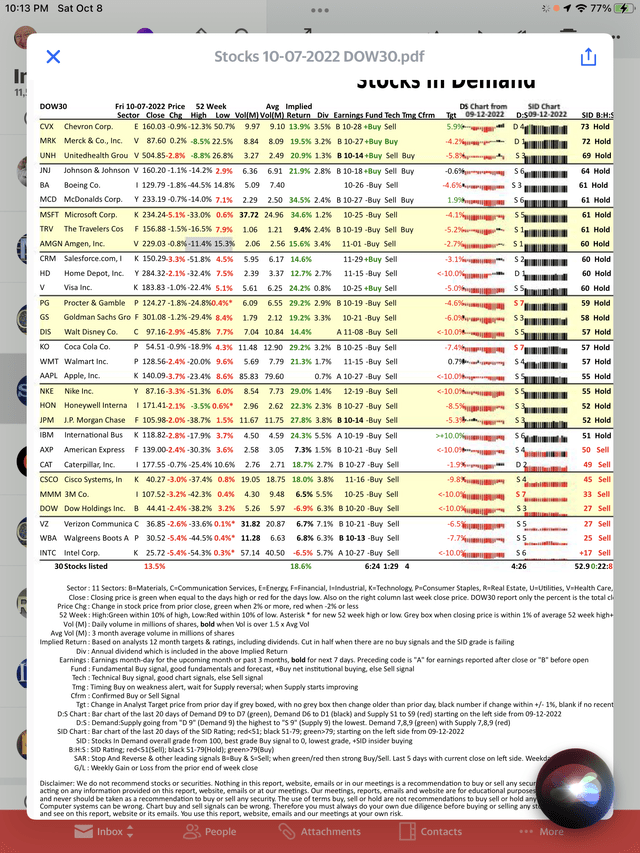
Our most important, fundamental and technical, Buy/Hold/Sell signal is shown on the far-right column of the above report. Only 12 stocks have an OK Hold signal above 59 out of 100. We expect this number to go lower before the DIA hits bottom.
Chevron (CVX) is at the top of the list with a score of 73, a strong Hold signal. An 80 to 100 score triggers our Buy Signal, and requires both good fundamentals and good technicals.
Only 6 stocks have a green colored, +Buy signal in the Fund column, indicating to us that portfolio managers were buyers on balance. These stocks are CVX, Merck (MRK), UnitedHealth (UNH), Johnson & Johnson (JNJ), Salesforce (CRM) and Visa (V). It is bearish that the PMs are only chasing 6 of the 30 Dow stocks. Notice Apple (AAPL) did not make the list and only has a score of 55 in our SID column. When the market bottoms we will see the number of stocks with a +Buy signal improving.
Conclusion
We don’t think DIA has hit the bottom yet. Next, we are looking for a test of $280 support, with the next bear market bounce. After that, we think a test of $264 for another bear market bounce.