DBJP ETF: Buy On Pullbacks
StockByM
Everyone seems to love investing in Japan, as we recently saw the Oracle of Omaha, Warren Buffett, shun the U.S. and increase his holdings in Japanese trading houses. Reportedly, investors followed suit by buying almost $8 billion in Japanese equities in the days following Mr. Buffett’s Japan visit.
Fundamentally, there are several reasons to be bullish Japan. Japanese equities are ‘cheaper’ than global markets with a forward P/E ratio of only 13.4x compared to 16.5x for the World and 18.4x for the U.S. Furthermore, the Bank of Japan is maintaining loose monetary policies that spur growth while the rest of the world’s central banks are trying to throttle growth to fight inflation.
However, you and I are not Warren Buffett (as if that wasn’t clear), and we do not get access to the same deals or hedges that Mr. Buffett does. Institutional investors like Berkshire Hathaway (BRK.A)(BRK.B) usually have the option to hedge their currency exposures when they invest in foreign stocks. Foreign investors buying local currency stocks do not.
One vehicle that retail investors can use to gain exposure to Japanese equities while hedging their currency exposure is the Xtrackers MSCI Japan Hedged Equity ETF (NYSEARCA:DBJP).
I am bullish on DBJP and would look to accumulate shares on any pullback towards the $52 breakout level.
Fund Overview
The Xtrackers MSCI Japan Hedged Equity ETF provides currency hedged exposure to Japanese equities by tracking the MSCI Japan US Dollar Hedged Index (“Index”). The fund fully replicates the underlying MSCI Japan Index while using derivative contracts to hedge the fund’s currency exposure.
The DBJP ETF has $292 million in assets and charges a 0.45% net expense ratio.
Portfolio Holdings
The DBJP ETF holds stocks in the same proportion as the MSCI Japan Index, which contain some of the largest publicly traded Japanese companies like Toyota and Sony (Figure 1).
Figure 1 – DBJP sector allocation and top 10 holdings (etf.dws.com)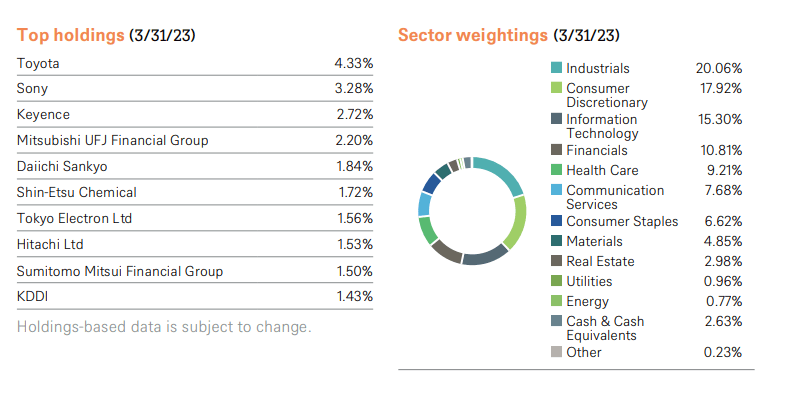
The DBJP ETF has large sector weights in Industrials (20.1%), Consumer Discretionary (17.9%), Information Technology (15.3%), Financials (10.8%), and Health Care (9.2%).
The fund also holds a large currency derivative position used the hedge the currency risk of the portfolio (Figure 2).
Figure 2 – DBJP currency hedge (etf.dws.com)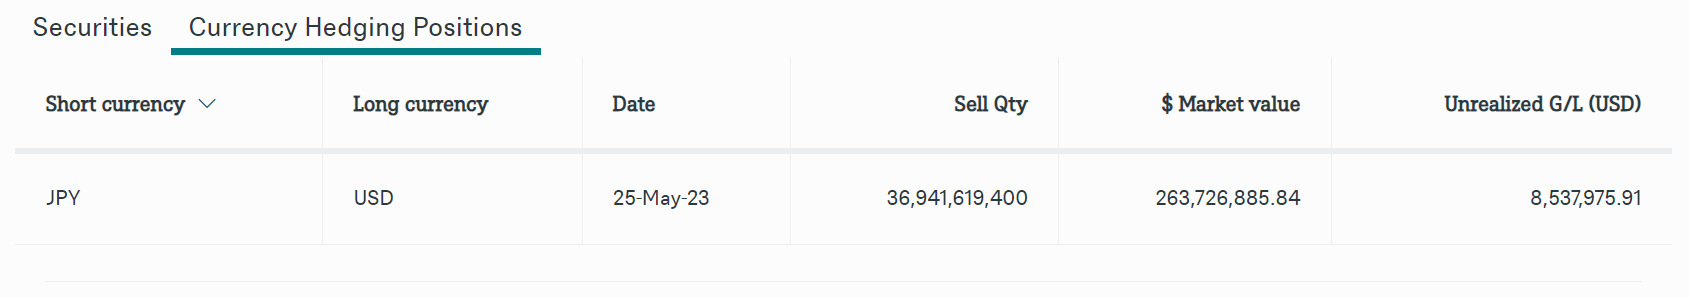
Distribution & Yield
The DBJP ETF pays a semi-annual distribution with trailing 12 month distribution of $0.39 / share or 0.7% yield.
Return
Figure 3 shows the historical returns of the DBJP ETF. The DBJP ETF has delivered solid returns, with 1/3/5/10Yr average annual returns of 13.5%/15.8%/7.1%/8.1% to April 30, 2023. DBJP has lagged its benchmark by approximately 50 bps / yr due to the fund’s 0.45% net expense ratio and slippage.
Figure 3 – DBJP historical returns (etf.dws.com)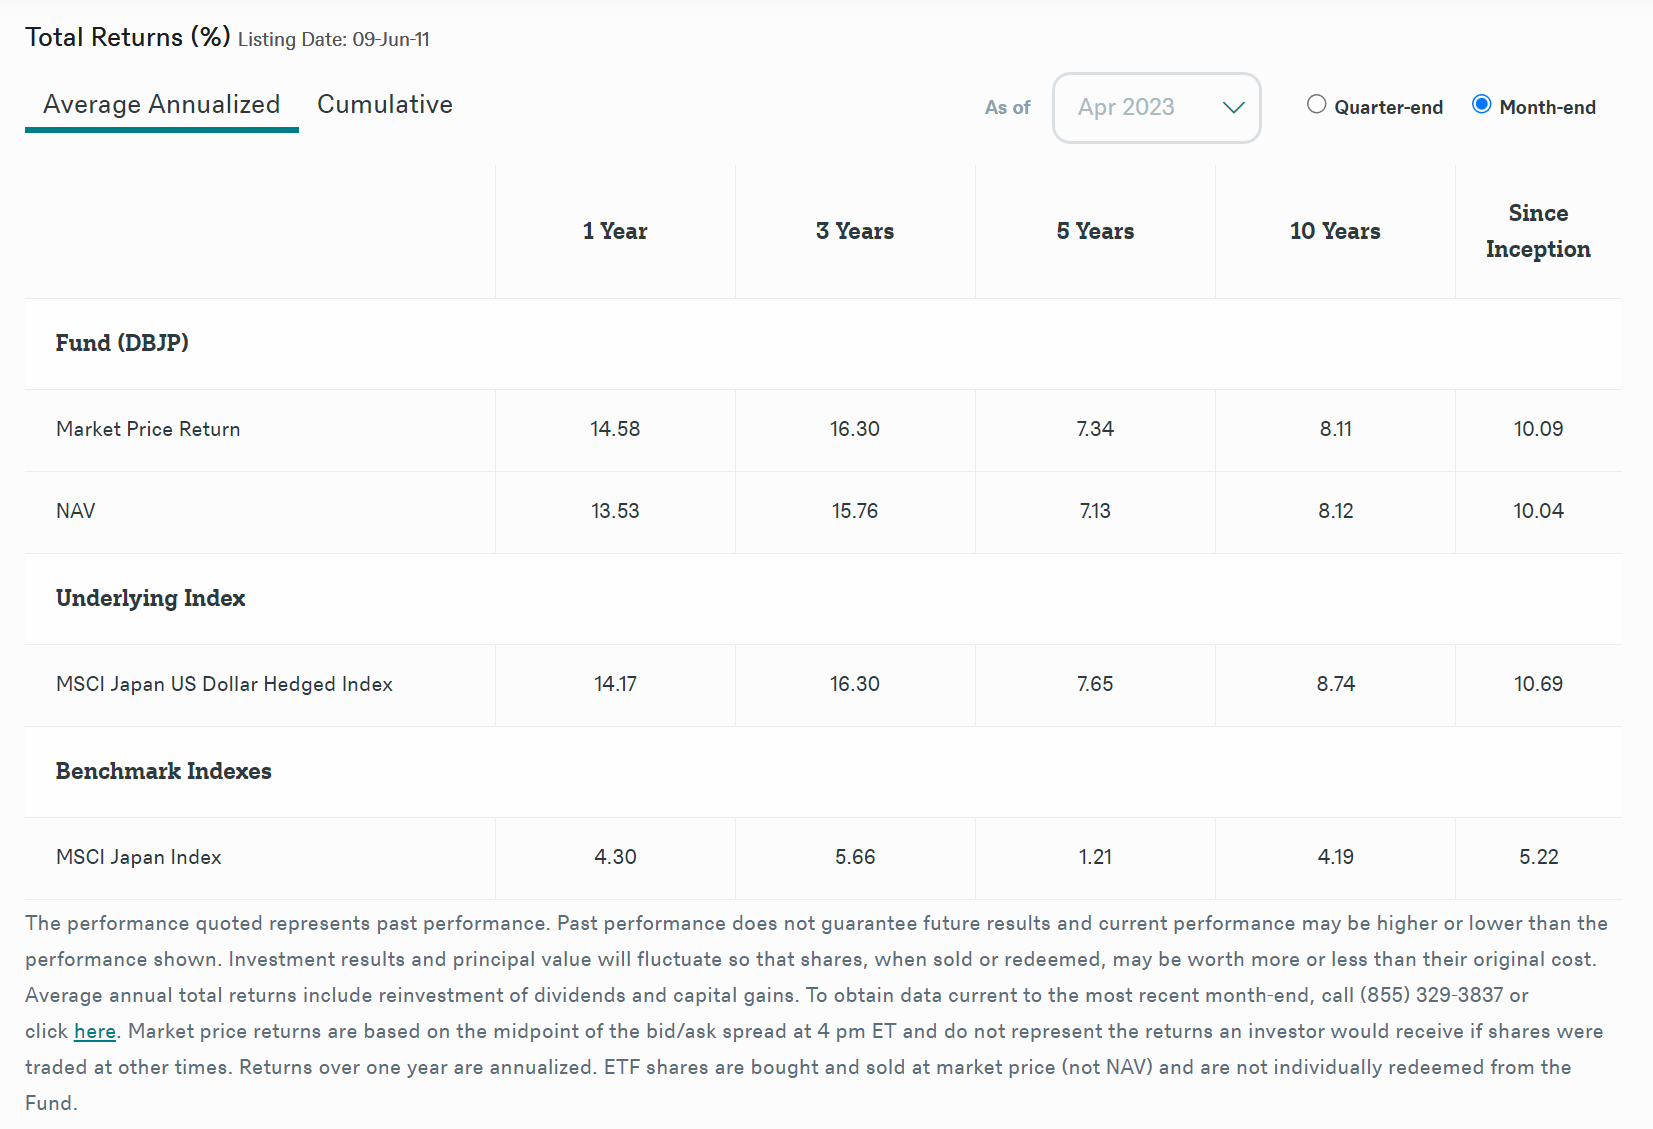
The key thing to notice from figure 3 is that the underlying MSCI Japan Index has only returned 4.3%/5.7%/1.2%/4.2% in the same timeframe, an unimpressive result. However, the DBJP has been able to achieve its solid performance through the addition of its long-term currency hedge against the Japanese Yen.
Yen Has Been In A Long-Term Downtrend
The main reason for the Yen’s poor performance is because of the Bank of Japan’s dovish monetary policies. Since 2011, the USDJPY exchange rate has weakened from roughly 75 Yen per 1 US dollar to ~140 Yen currently, or an 87% depreciation (Figure 4). This has turbocharged DBJP’s returns.
Figure 4 – UPY has depreciated from 75 to 140 (stockcharts.com)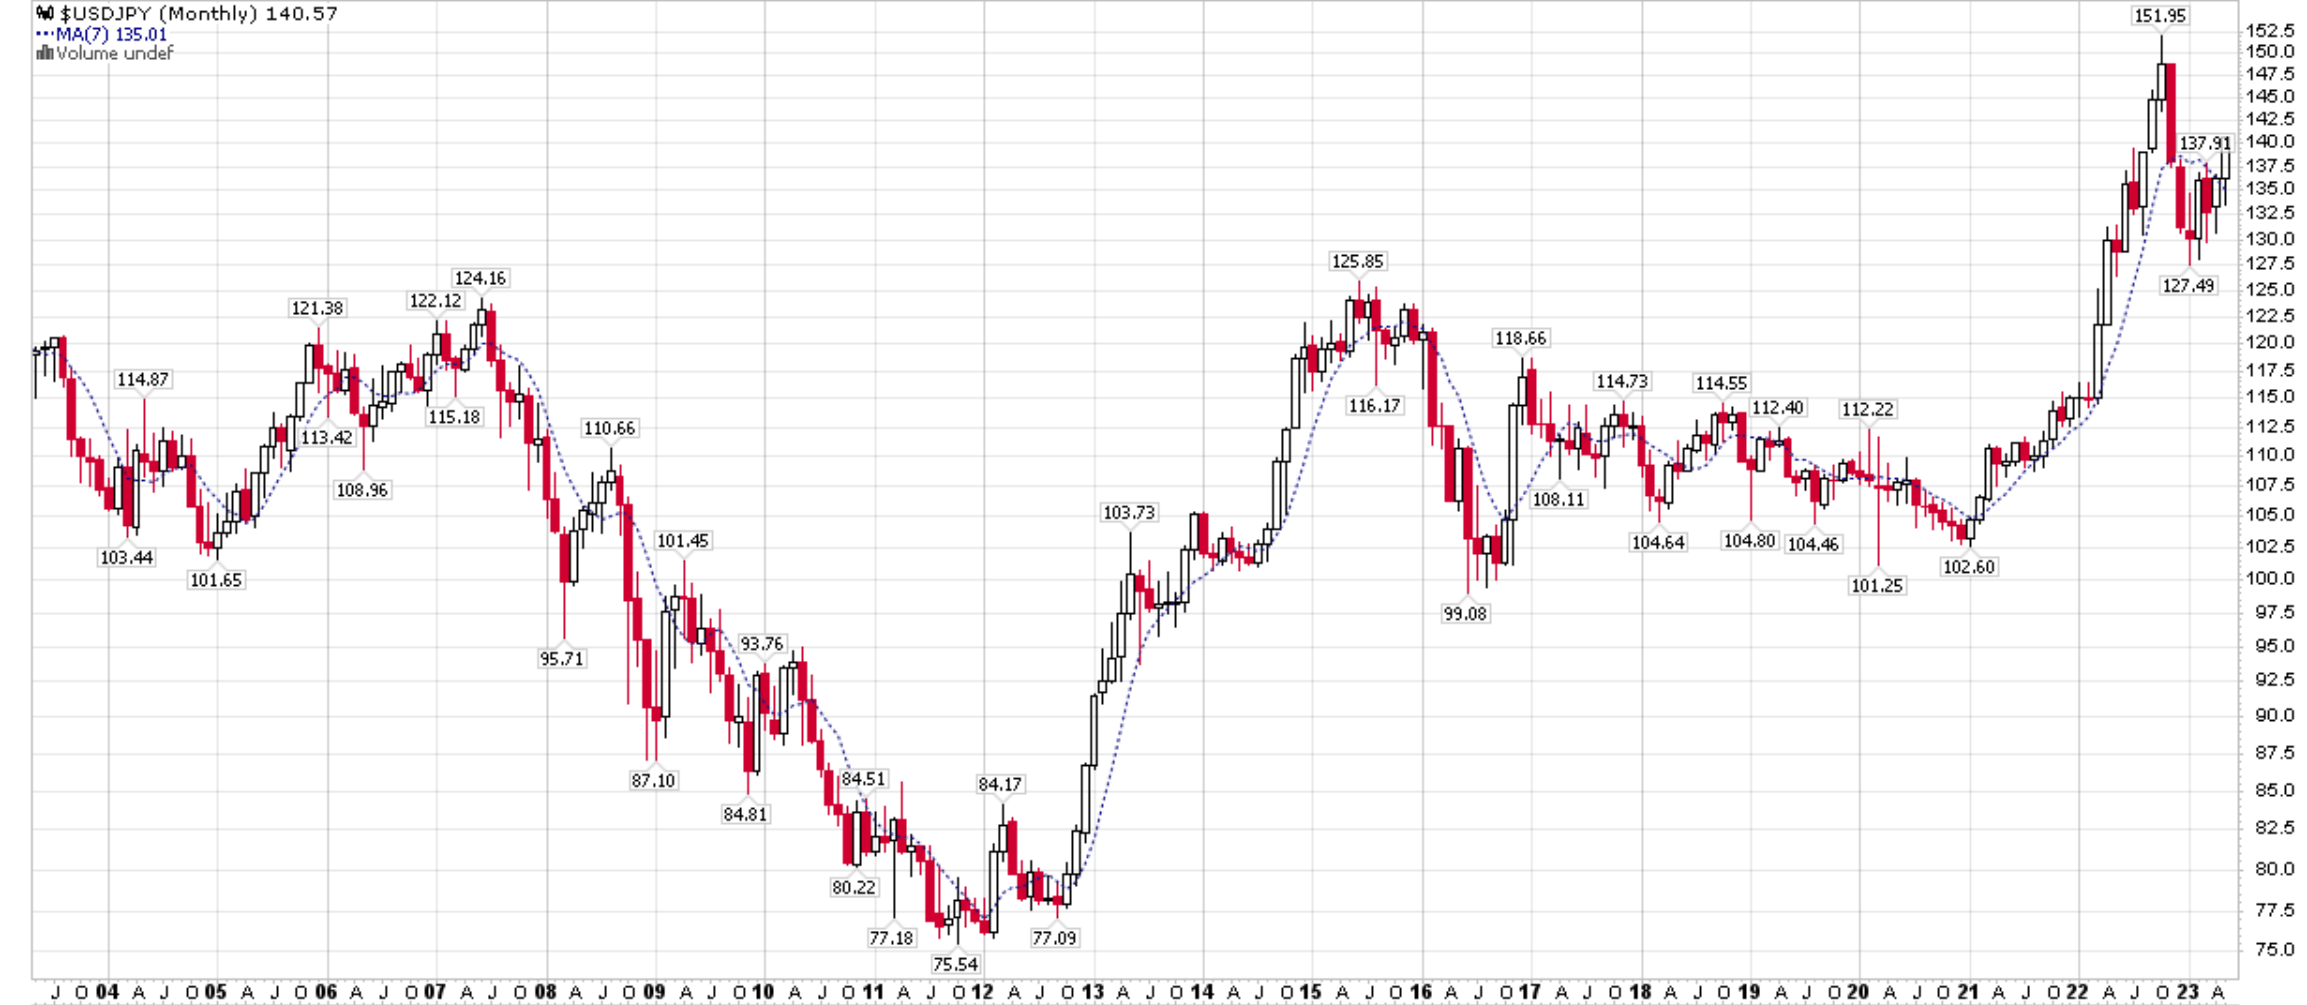
The Japanese yen weakening really began with the appointment of the late Shinzo Abe as prime minister and his ‘Abenomics’ policy that combined aggressive monetary easing with fiscal stimulus and structural reforms.
According to the Mundell-Fleming trilemma, policymakers in any economy can only control 2 of 3 possible things at any given time: autonomous interest rate policy, fixed exchange rates, or free flow of capital (Figure 5).
Figure 5 – Mundell-Fleming Trilemma (investopedia.com)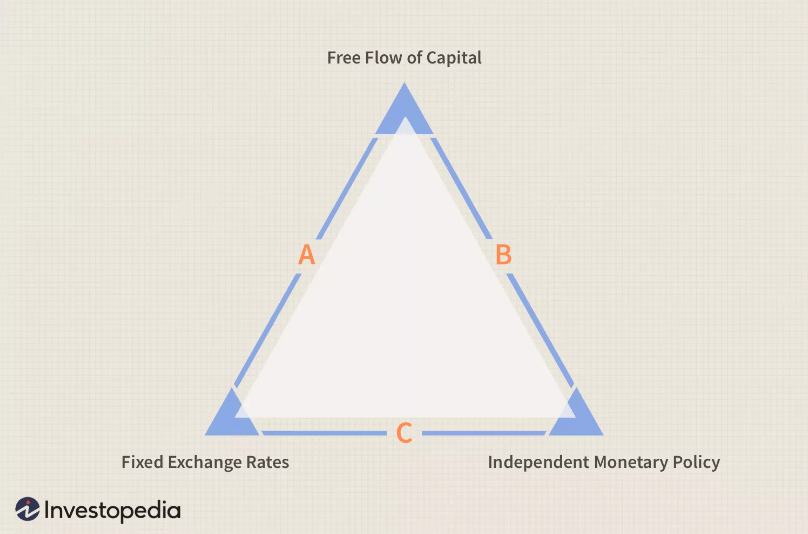
Since the BOJ allows free flow of capital and has been engaged in aggressive monetary policies (Japan has been in quantitative easing mode and has fixed its interest rates at zero since 2016), therefore, the exchange rate of the Japanese Yen was the variable that has to fluctuate to compensate.
Inflation Turbo-Charged Yen Decline
As inflation surged in the U.S. beginning in 2021 and the Fed began tightening monetary policy in response, the USDJPY exchange rate rose rapidly (rising USDJPY means weakening Yen), breaking out of a multi-year downtrend.
In fact, the Yen fell precipitously by over 30% from the end of 2021 to September 2022, as the large interest rate differential between the BOJ and the Fed created huge depreciation pressure on the Yen. However, the weak yen trade took a pause at the end of last year, as the BOJ intervened in the currency markets to stabilize its currency and investors started to price in an end to Fed interest rate increases.
However, recently, the USDJPY exchange rate began to reaccelerate to the upside, as the newly appointed BOJ Governor Ueda announced plans to maintain Japan’s ultra-low interest rates and stressed that the BOJ needed “to wait for more evidence to conclude inflation would sustainably achieve the BOJ’s 2% target.” With Japanese inflation currently running at a 3.5% YoY rate after surging to a multi-decade high of 4.3% YoY in January, it is farcical that the BOJ still has not concluded that inflation reached its 2% target (Figure 6).
Figure 6 – Japanese inflation far above target (tradingeconomics.com)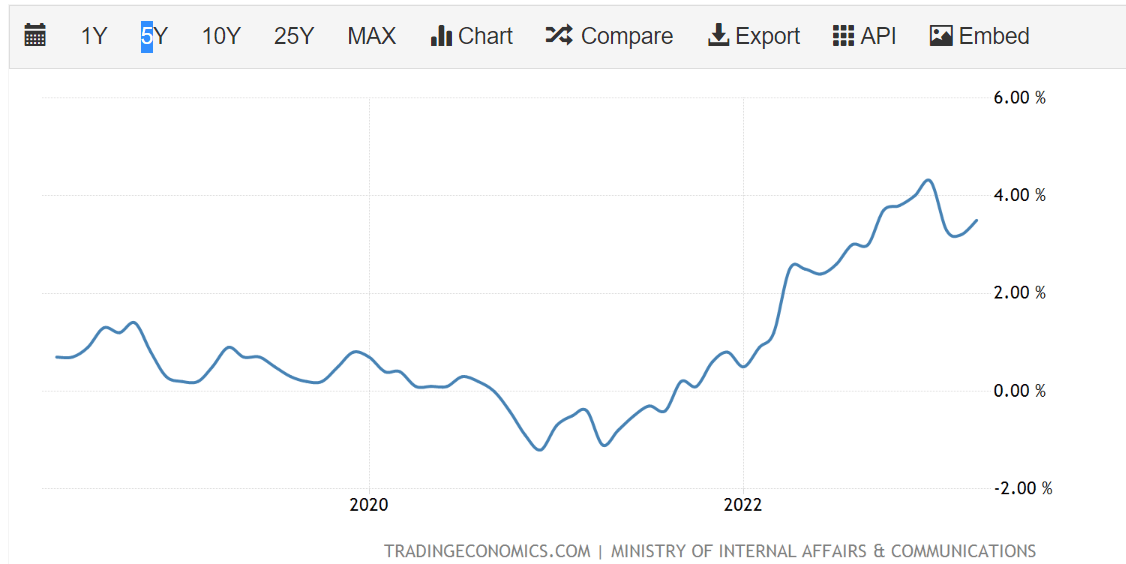
In any event, a dovish BOJ meant that traders had the green light to re-engage in shorting the Yen, and the currency has declined by roughly 5% since Governor Ueda’s speech on April 27.
Japanese Markets Are ‘Cheap’
One of the primary reasons Warren Buffett and other macro investors are bullish on Japanese equities is because they are ‘cheap’ relative to the ‘expensive’ global markets. On a forward basis, the MSCI Japan Index has a P/E ratio of 13.4x, compared to 16.5x for the MSCI World Index and 18.4x for the S&P 500 (Figure 7).
Figure 7 – Japan is cheap relative to the world (MSCI.com)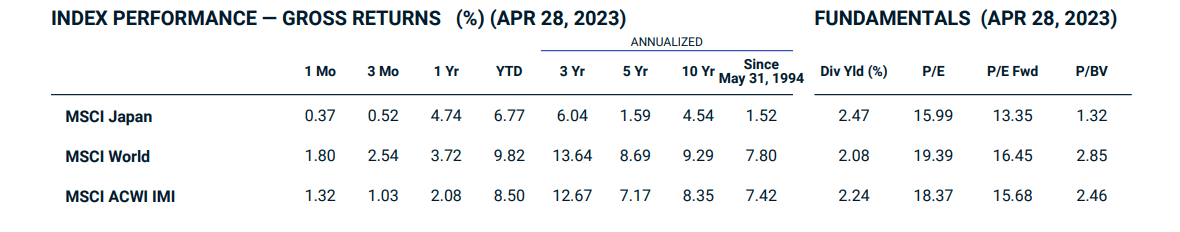
While one generally cannot predict future stock market returns, having a low valuation starting point makes it easier to achieve above average returns.
Furthermore, while global central banks in the western world are all in tightening mode trying to fight inflation, the BOJ is actively fanning inflation flames as it believes domestic inflation is not ‘high enough’. This means monetary policy in Japan is actively promoting growth.
Technicals Suggest More Upside
Technical, Japanese equities have done nothing for more than 30 years, as the Nikkei Index is still below its all-time highs of 38,900 in 1990. Recently, the Nikkei is just breaking out of a two-year consolidation range, suggesting more upside within a wide multi-year uptrend sparked by ‘Abenomics’ in 2012 (Figure 8).
Figure 8 – Nikkei is in a multi-year uptrend (Author created from stockcharts.com)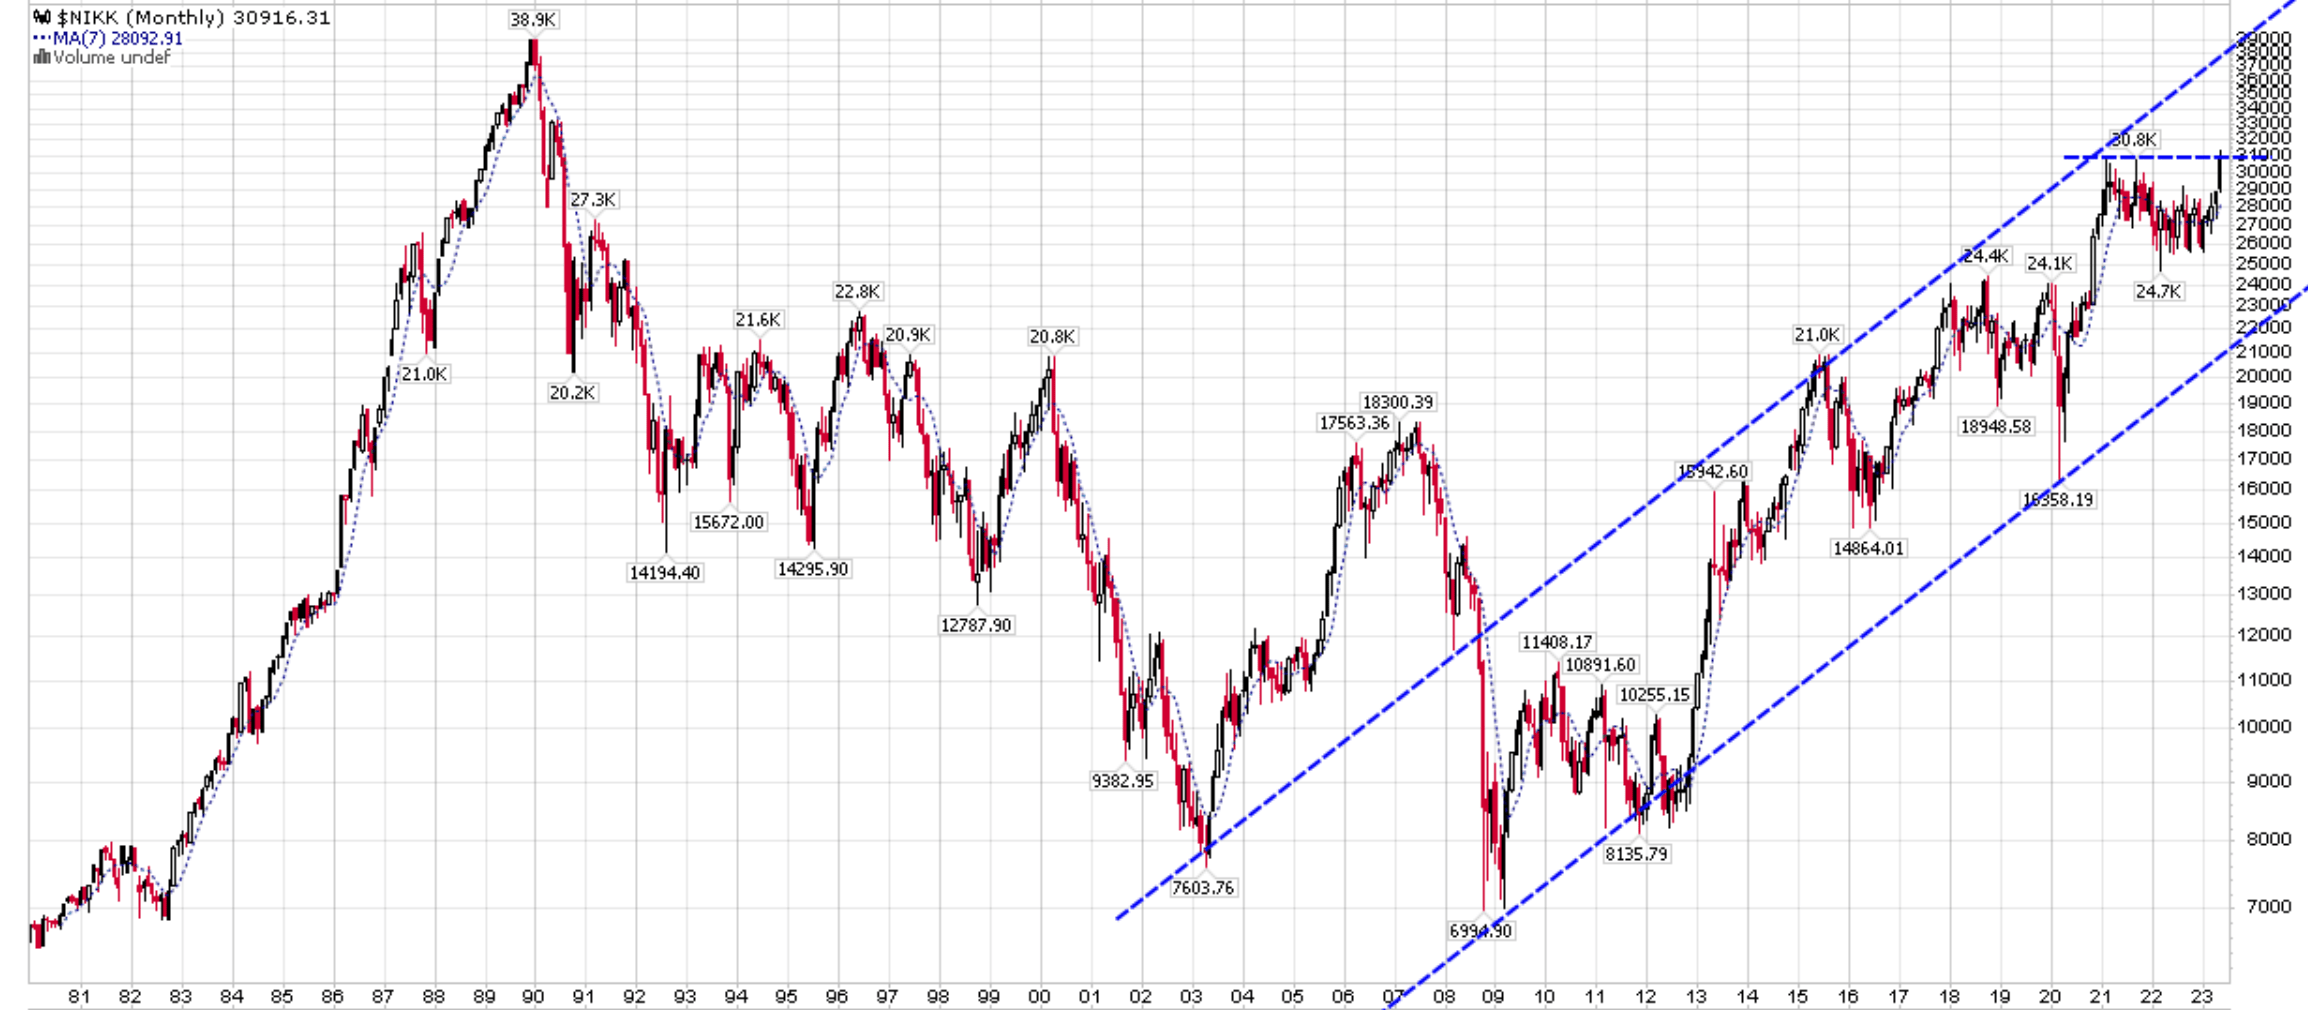
In the short-term, the DBJP ETF is up more than 20% YTD and is quite overbought on the PPO indicator, suggesting a pullback may be necessary to reset momentum. I would look to accumulate shares near the $52 breakout level if a pullback develops (Figure 9).
Figure 9 – DBJP is overbought; buy on pullback (Author created from stockcharts.com)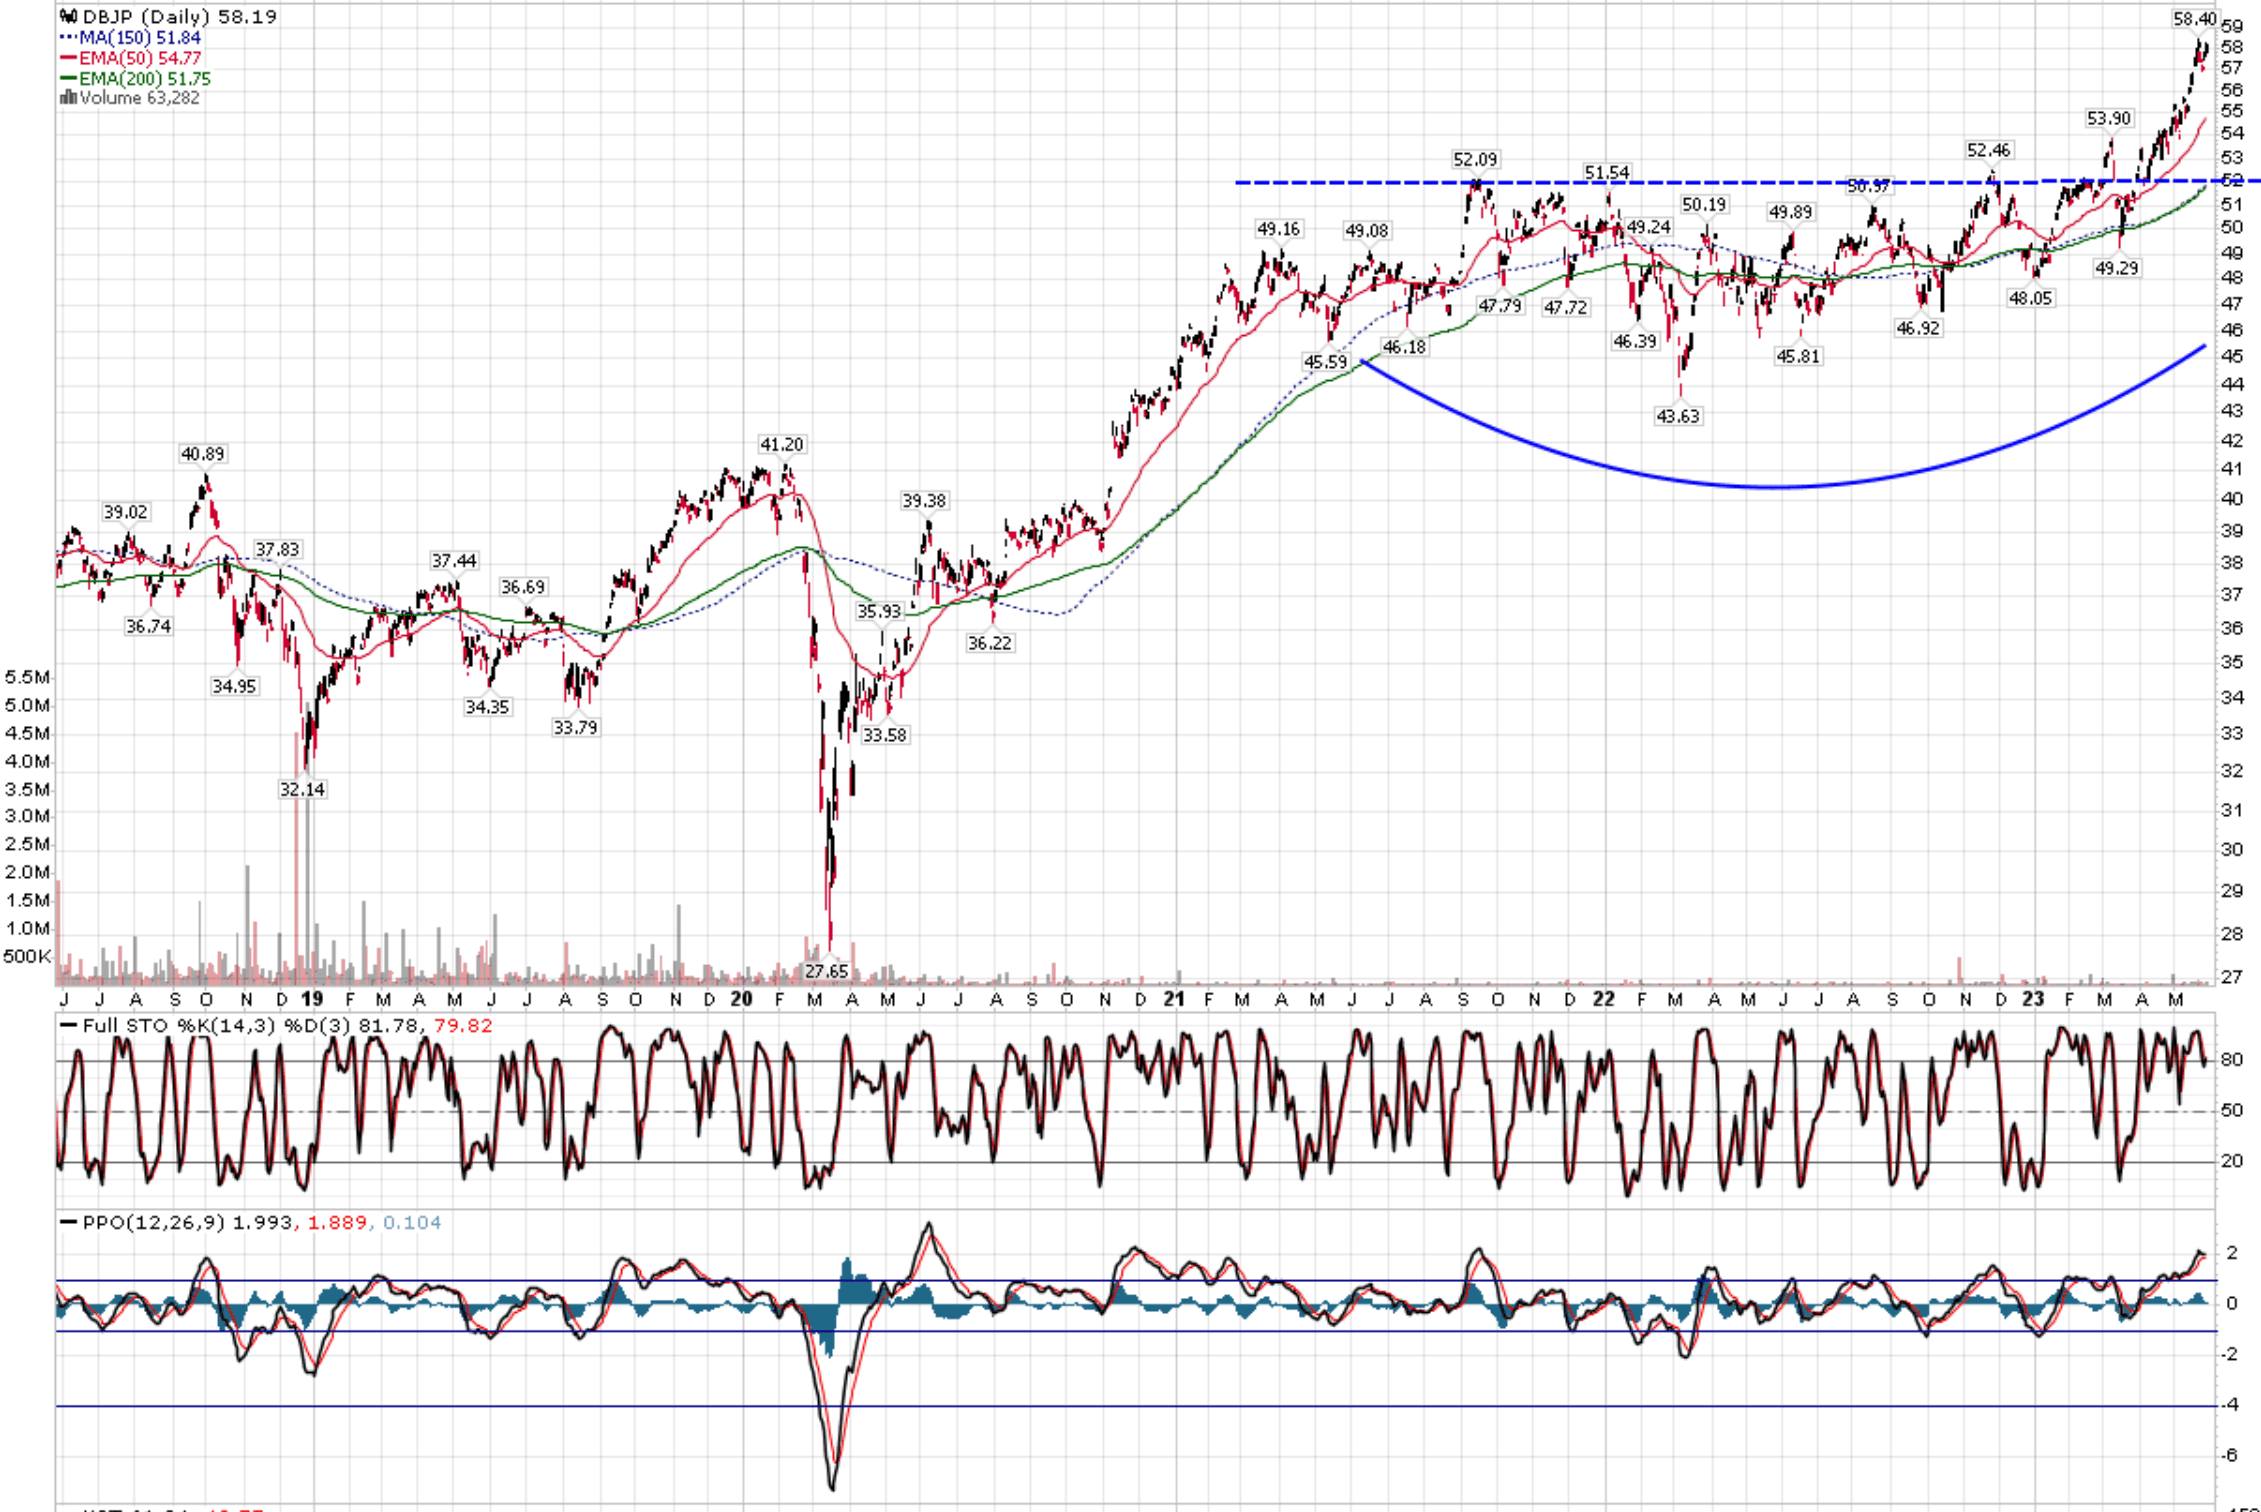
Conclusion
While everyone is looking to follow the Oracle of Omaha into Japanese equities because they are cheap, investors are often looking at the wrong vehicle, investing in local currency denominated stocks and ETFs. The main issue with local currency denominated stocks is that the Bank of Japan is actively trying to stoke growth with easy monetary policies. So, while Japanese stocks may rally in local currency terms, for American investors, they are penalized by a weakening Yen.
In contrast, the DBJP ETF provides currency hedged exposure to the MSCI Japan ETF. I recommend investors look to accumulate the DBJP ETF on pullbacks near $52.