Corning Stock: Don’t Rush In To Buy (NYSE:GLW)

onimate
Corning (NYSE:GLW) is a great American success story. Its products serve multiple industries, from telecommunications to healthcare and semiconductors. The company faced short-term headwinds to its revenue and profitability. The stock is not going anywhere anytime soon, so an investor can be patient in acquiring it if it drops below $30.
Corning Faces Headwinds in Revenue Growth and Profitability
As with many consumer discretionary companies, the heady growth days of 2021 are over for Corning. The Display Technologies division continued to see lower sales. Total sales declined by 3.6% year-over-year in 2022 compared to the same period in 2021. In Q3 2022, the company reported that many end-markets, such as smartphone sales and automotive production, in which it sells its products, were down.
For the nine months ending September 2022, the company’s Display Products revenue was down nearly 20%, and its Specialty Glass Products business barely grew its revenues [Exhibit 1]. Both its Environmental Substrate and Life Sciences products had a down year in terms of revenue growth. The Telecommunications products category was a rare bright spot for the company, growing by an astounding 21.7%. Due to the strength in its Telecommunications Products category, the company was able to scrape up overall revenue growth of 3.5%. The company thinks Telecommunications products are on a multi-year growth cycle, but its sales can be lumpy and, at times, unpredictable.
Exhibit 1:
![Corning's Revenue by Product Category [Nine Months Ended September 30]](https://static.seekingalpha.com/uploads/2022/11/30/saupload_XS9pTHlDvTTdNrGhxHBxKDR0SAF9CBkRcuFIEk5AyjMmsJDdIlFsOYI--Hc9hkogRVWpoCvyXQLSZZsQjfpOzsjgsOG0cj21XnaL2NLAHXprSs5kM_UEPz9dSfDwNx3ViK3nHqWZGX7ouJqKnqLKd_sBPAWbxVo32rKzNyoc4pZJnYKsG-HVCyYBZx-peA_thumb1.png)
Corning’s Revenue by Product Category [Nine Months Ended September 30] (SEC.GOV, Author Formatting)
As the company’s revenue growth has stalled, its margins have taken a hit. The gross profit margin has dropped to 30.4%, and its operating margin has dropped below 10%. Its gross profit margins are back to the same level it achieved in March 2020, when the pandemic took hold [Exhibit 2]. The company hopes the erosion of its sales in the Display category will bottom in Q4 2022. The company will struggle to book profits in its Display products segment if volumes continue to slide, given the high fixed costs of its manufacturing facilities.
Consumer Confidence continues to fall in the US, reaching its lowest level since July 2022. Globally, consumers are battling high inflation and interest rates, and until they see a reprieve from both, it may be tough for consumer discretionary products. COVID lockdowns in China continue to disrupt production in China. These headwinds will weigh on Corning in Q4, and the weakness may continue into Q1 as consumers deplete more of their savings during the Q4 2022 holidays. The first calendar-year quarter is also seasonally weak for consumer discretionary spending.
Exhibit 2:
![Corning's Quarterly Y/Y Revenue Growth, Gross Profit, Operating, and Net Income Margins [March 2020 - September 2022]](https://static.seekingalpha.com/uploads/2022/11/30/saupload_BOKGrgT2F7jfLvpzgMTRRw2EcqGgvdxZiTkDOWAwRqtW8S8xRr6dq5am8tebGwUEEUWHt5nrba8Q5kDgCSlLJi5e922kGhvEu5gHd4PqR8lCxL43gIJ2k0sjwDM4NKdEadFXTWq2zG1yyickVBE0hciOxAg_vzusdgdwaUYlOXiWcNBSJW02I0-VMF3miw_thumb1.png)
Corning’s Quarterly Y/Y Revenue Growth, Gross Profit, Operating, and Net Income Margins [March 2020 – September 2022] (Seeking Alpha, Author Compilation)
Corning’s Sub-par Monthly Price Returns
Between June 2019 and October 2022, Corning had an average monthly return of 0.65% [Exhibit 3]. This return compares poorly against the average monthly return of 0.99% of the Vanguard S&P 500 index ETF (VOO) [Exhibit 4]. Corning also suffers a higher standard deviation [another measure of volatility] than the Vanguard ETF, 8.9% for Corning versus 5.7% for the Vanguard ETF. In short, Corning offers poor monthly returns with higher volatility. These poor monthly returns may explain why Corning has underperformed the market over a prolonged period. Corning outperformed the S&P 500 Index in 2017 and 2018 but has since lagged behind it in subsequent years [Exhibit 5].
Exhibit 3:
![Corning's Monthly Investment Return Statistics [June 2019 - October 2022]](https://static.seekingalpha.com/uploads/2022/11/30/saupload_2UU1xpdSv1i19_up4uSlTKrZjbasKBUW7orvEnHQ2hkLQ5EFMu0dhN_EixuaUZAbwixyDmIn7kugjR9wbrQ0TXrw-0xtw38wAMsA0vekrfWV3HoGnpk_C29LJiVrVyGn6aC5wGLaXX5iS3egsBON1Yb4oJY4-5VdJz81JnNgXpwka9VEfD2j3cGQRCklkw.png)
Corning’s Monthly Investment Return Statistics [June 2019 – October 2022] (Data Provided by IEX Cloud, Author Calculations)
Exhibit 4:
![Vanguard S&P 500 Index ETF Monthly Investment Return Statistics [June 2019 - October 2022]](https://static.seekingalpha.com/uploads/2022/11/30/saupload_vrIZs2LT7PDgngYtDS2ohMH7c9ekBMd7wwFELrjrNAYzXfB-y-t2U5RmyC4ourDNxkNC11toN_chTJJZFkHzuaPMYjqVB2vX5Rq1xak2HZvI1K7hdzDjjt6L4BqKXHf9Iltb2uLub2VV_nJorpPwIaJ0hDVZG3nkNYjayrTQ2qVBuai7435nUCWMZJJV0Q.png)
Vanguard S&P 500 Index ETF Monthly Investment Return Statistics [June 2019 – October 2022] (Data Provided by IEX Cloud, Author Calculations)
Corning’s monthly returns have a high positive correlation of 0.66 with the Vanguard S&P 500 Index ETF. Corning’s beta of 1.03, as measured using a linear regression model, shows the degree of correlation with the Vanguard S&P 500 Index ETF. Corning’s monthly return will change by an average of 1.03% for every 1% change in the monthly return of the Vanguard ETF. Corning should be reasonably expected to move in line with the market. This argument is valid for 2022, given that Corning’s stock has returned a negative 13.9%, while the Vanguard S&P 500 Index ETF has returned a negative 13.7% as of close on November 28, 2022. Corning will not protect a portfolio from the market’s volatility.
Corning’s highest monthly return of 19.6% was achieved in July 2020 during the peak of the Fed-driven rally at the height of the Pandemic. The stock’s lowest return of a negative 15.4% was achieved in September 2022 when Corning fell in tandem with the Vanguard S&P 500 index ETF [loss of 9.6%]. For the most part, correlation and beta are good tools which allow the investor to assess and predict the performance of their portfolio holdings under various market conditions.
Exhibit 5:
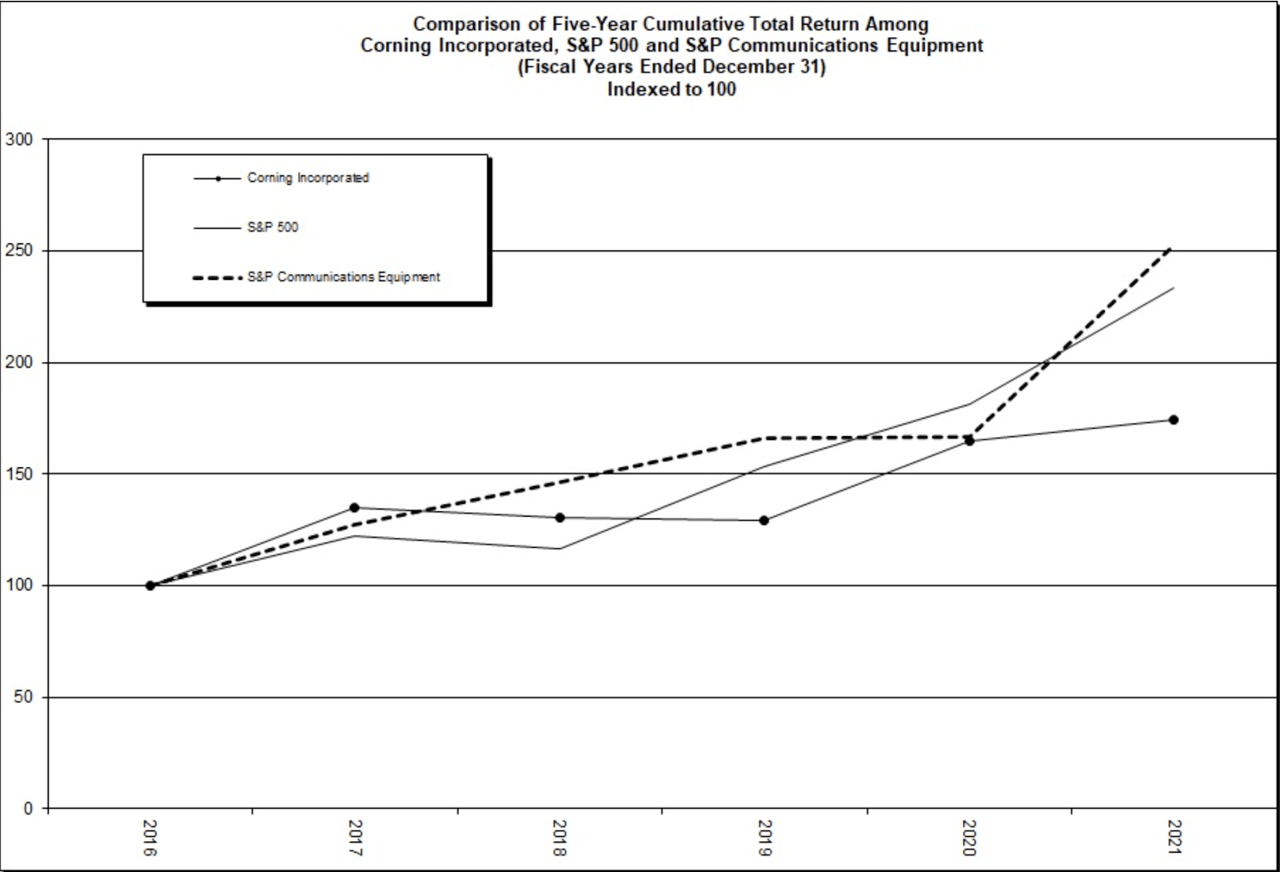
Comparison of Five-Year Cumulative Total Return Among Corning, S&P 500, and S&P Communications Equipment (SEC.GOV)
Corning’s Fading Momentum in its Stock Price
The stock’s price momentum may also be fading, another indication of weakness to come in the stock. The Relative Strength Index and the Money Flow Index may have peaked and are trending lower [Exhibit 6]. The stock has failed to rally beyond $34 and may retest its 52-week low of around $29 in the coming months, giving investors a good entry point into this stock. Technical traders would argue that the fundamentals of a stock are ingrained in the technical indicator. In that case, the short-term fundamentals are not suitable for the stock, with the company carrying high inventory levels while demand slows across the globe.
Exhibit 6:
![Weakening RSI and MFI Readings for Corning [1-Year]](https://static.seekingalpha.com/uploads/2022/11/30/saupload_xiQW442CY6p30ofh6vtKy0dInmcCxFL-lbQ0hiTi_tGgaLMRUordfV6qLrlOig-QTsKKNag_qIFIe7OkCUPOBVm2PS48_rz9dpu7_yzvm4CdPaiBULATs8YFhaqWI0qwQfpCZTzbunDjHdMu3Cy8ogDBSomv736a4Jc1GktMj4Gprhje5NMQggkBGTzRXg_thumb1.png)
Weakening RSI and MFI Readings for Corning [1-Year] (Seeking Alpha)
Dividend and Buybacks
Dividends are one of the reasons to own Corning for the long term. The company has grown its dividend for 12 straight years and has a five-year dividend growth rate of 11.74%. Corning now offers a dividend yield of 3.2%. The US Treasury Notes yield more than Corning’s dividend yield, giving investors a safe place to invest without the single-stock risk. The company paid $908 million in total dividends in the trailing twelve months and had operating cash flows of over $3 billion [TTM]. Its operating cash flows will cover the company’s dividends.
Between 2012 and 2021, Corning spent $18.29 billion on share buybacks, which has helped reduce its share count by 662 million, for an effective buyback price of $27.63. At the end of 2021, the company had 844 million diluted shares outstanding. The buyback program has not created much shareholder value since shares are trading just 20% higher than the effective per-share buyback price.
Buyback programs are marketed as “returning cash” to shareholders but are mainly used to boost earnings per share. Shareholders may have been better off getting the $18.29 billion as dividends. Most shareholders, I suspect, own stocks in tax-deferred Individual Retirement Accounts [IRA] or no-tax Roth accounts and would not be subject to immediate double-taxation of dividend payments. Given its revenue growth and profitability uncertainty, the company has substantially slowed down its share repurchases. The company has spent $265 million buying back shares in the first nine months of 2022. This buyback slowdown may further impact earnings per share growth in the coming years.
Corning is Fully Valued
Corning may be fully valued at this time. The company is trading at a trailing GAAP P/E of 15.4x and a forward P/E of 17x compared to its five-year average forward P/E of 27.8x. But, five-year average P/E may not be meaningful in the current high inflation, interest rate environment. The US Federal Reserve is targeting an inflation target of 2%, and they may not be done increasing the rates until they are satisfied that inflation will get to their target or there is substantial demand destruction that takes the globe into a recession. The price of oil is another uncertainty for the inflation rate in 2023. The oil release from the U.S. Strategic Petroleum Reserve and the demand destruction in China due to the COVID lockdowns may have done the job of lowering oil prices in the short term.
Conclusion
Given the headwinds that Corning is facing and a lack of prominent demand drivers that could grow revenue and profitability, the company may be fully valued today. Corning’s stock may not produce any upside soon, and there is substantial downside risk if inflation is persistent. Investors who own Corning may be better off holding on to the stock for the long term. Corning’s stock may be a good purchase if it retests its 52-week low of approximately $29. Investors can afford to be patient when looking to buy Corning and may need even more patience to see good returns on this stock.