Bear Market Rally Enters A Pivotal Week Of Trading
MediaProduction
It was yet another volatile week of trading for markets. While the S&P 500 (SP500, SPX) rallied on Friday, it took the support of a news article from the Wall Street Journal and, more importantly, Japan intervening in the currency market to defend the yen vs. the dollar to save the day.
Stocks were positioned sharply lower Friday morning, with yields higher and the dollar screaming to its highest levels in decades. Then around 9 AM, a news article from the Wall Street Journal suggested the Fed may begin to debate the pace of future rate hikes.
TradingView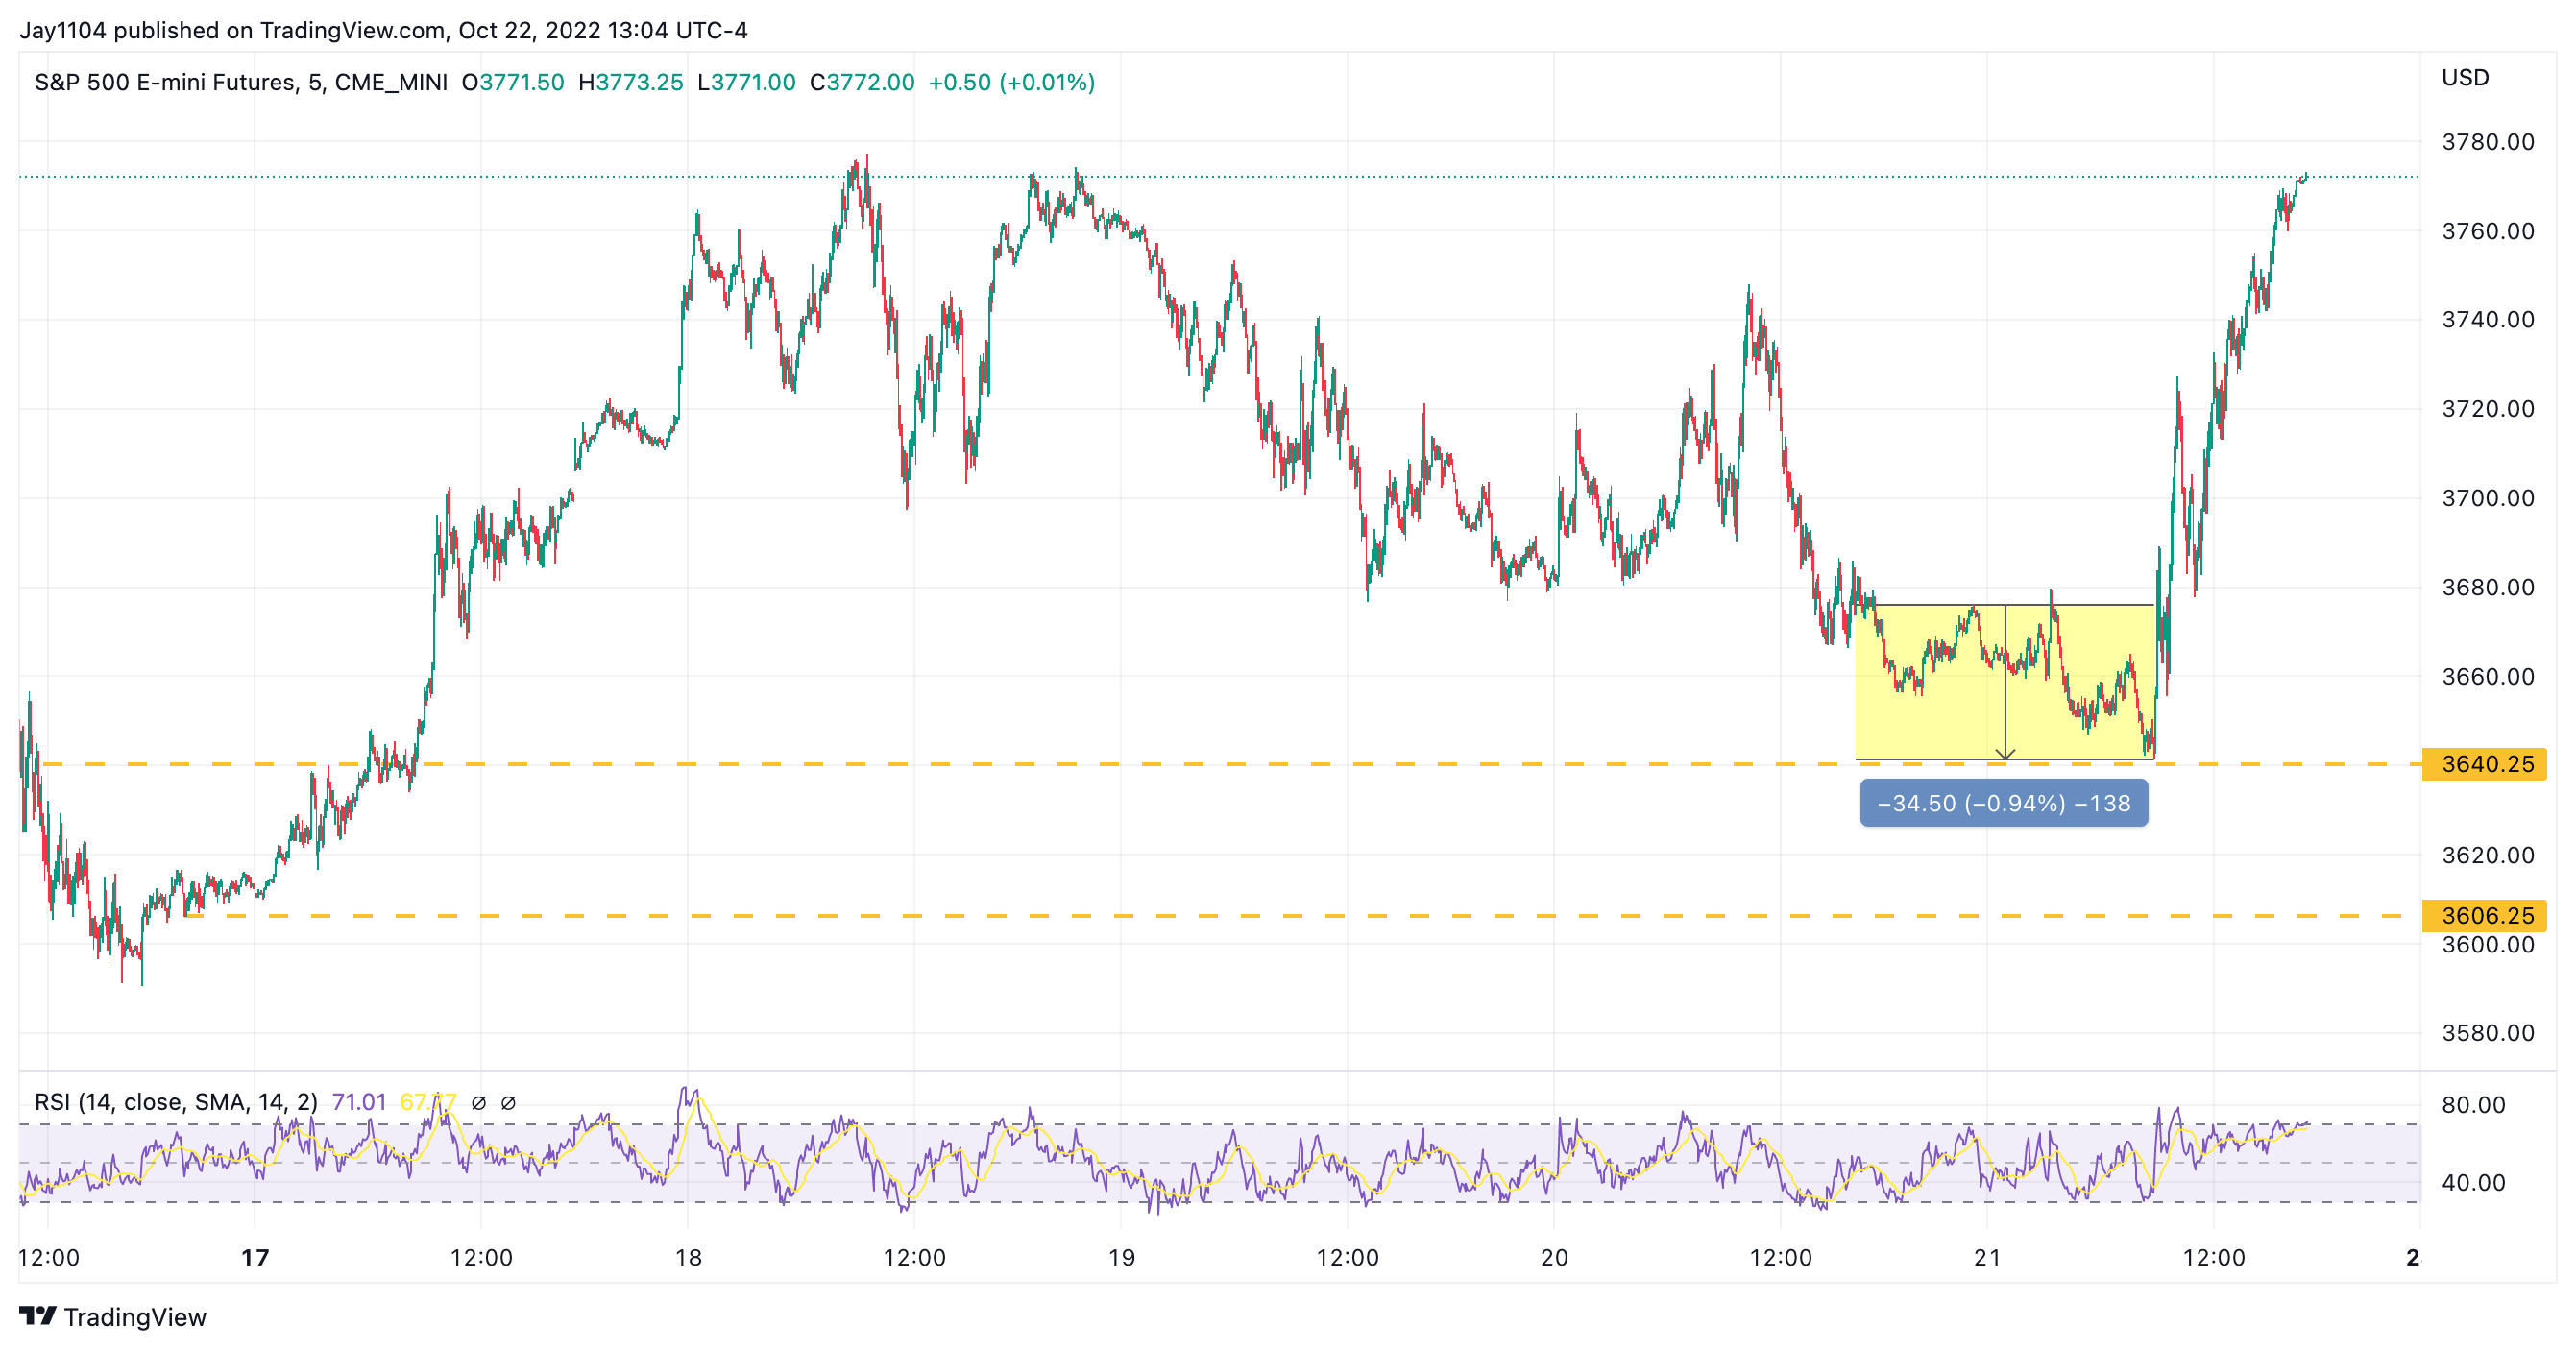
At that point, the S&P 500 futures were down nearly 1% and were sitting at a critical level of support. If that support had been broken, it would have probably sent the S&P 500 futures down to around 3,600. But then, at 8:52 AM, everything reversed hard on the WSJ headline.
Beyond the headline, the article stated nothing new, even noting comments made by Fed officials nearly a month ago. Anyone that had listened to Fed officials over the past month shouldn’t have been surprised.
On top of that, big news came at 10:30 AM when Japan intervened to strengthen the yen against the dollar, which sent the dollar-yen pair to trade sharply from around 152 to 146. That ignited a risk-on rally in stocks. The monthly options expiration date led to the sharp decay in put values coupled with the newfound trend of traders buying out-of-the-money call options with zero days till maturity, and we got a solid rally.
TradingView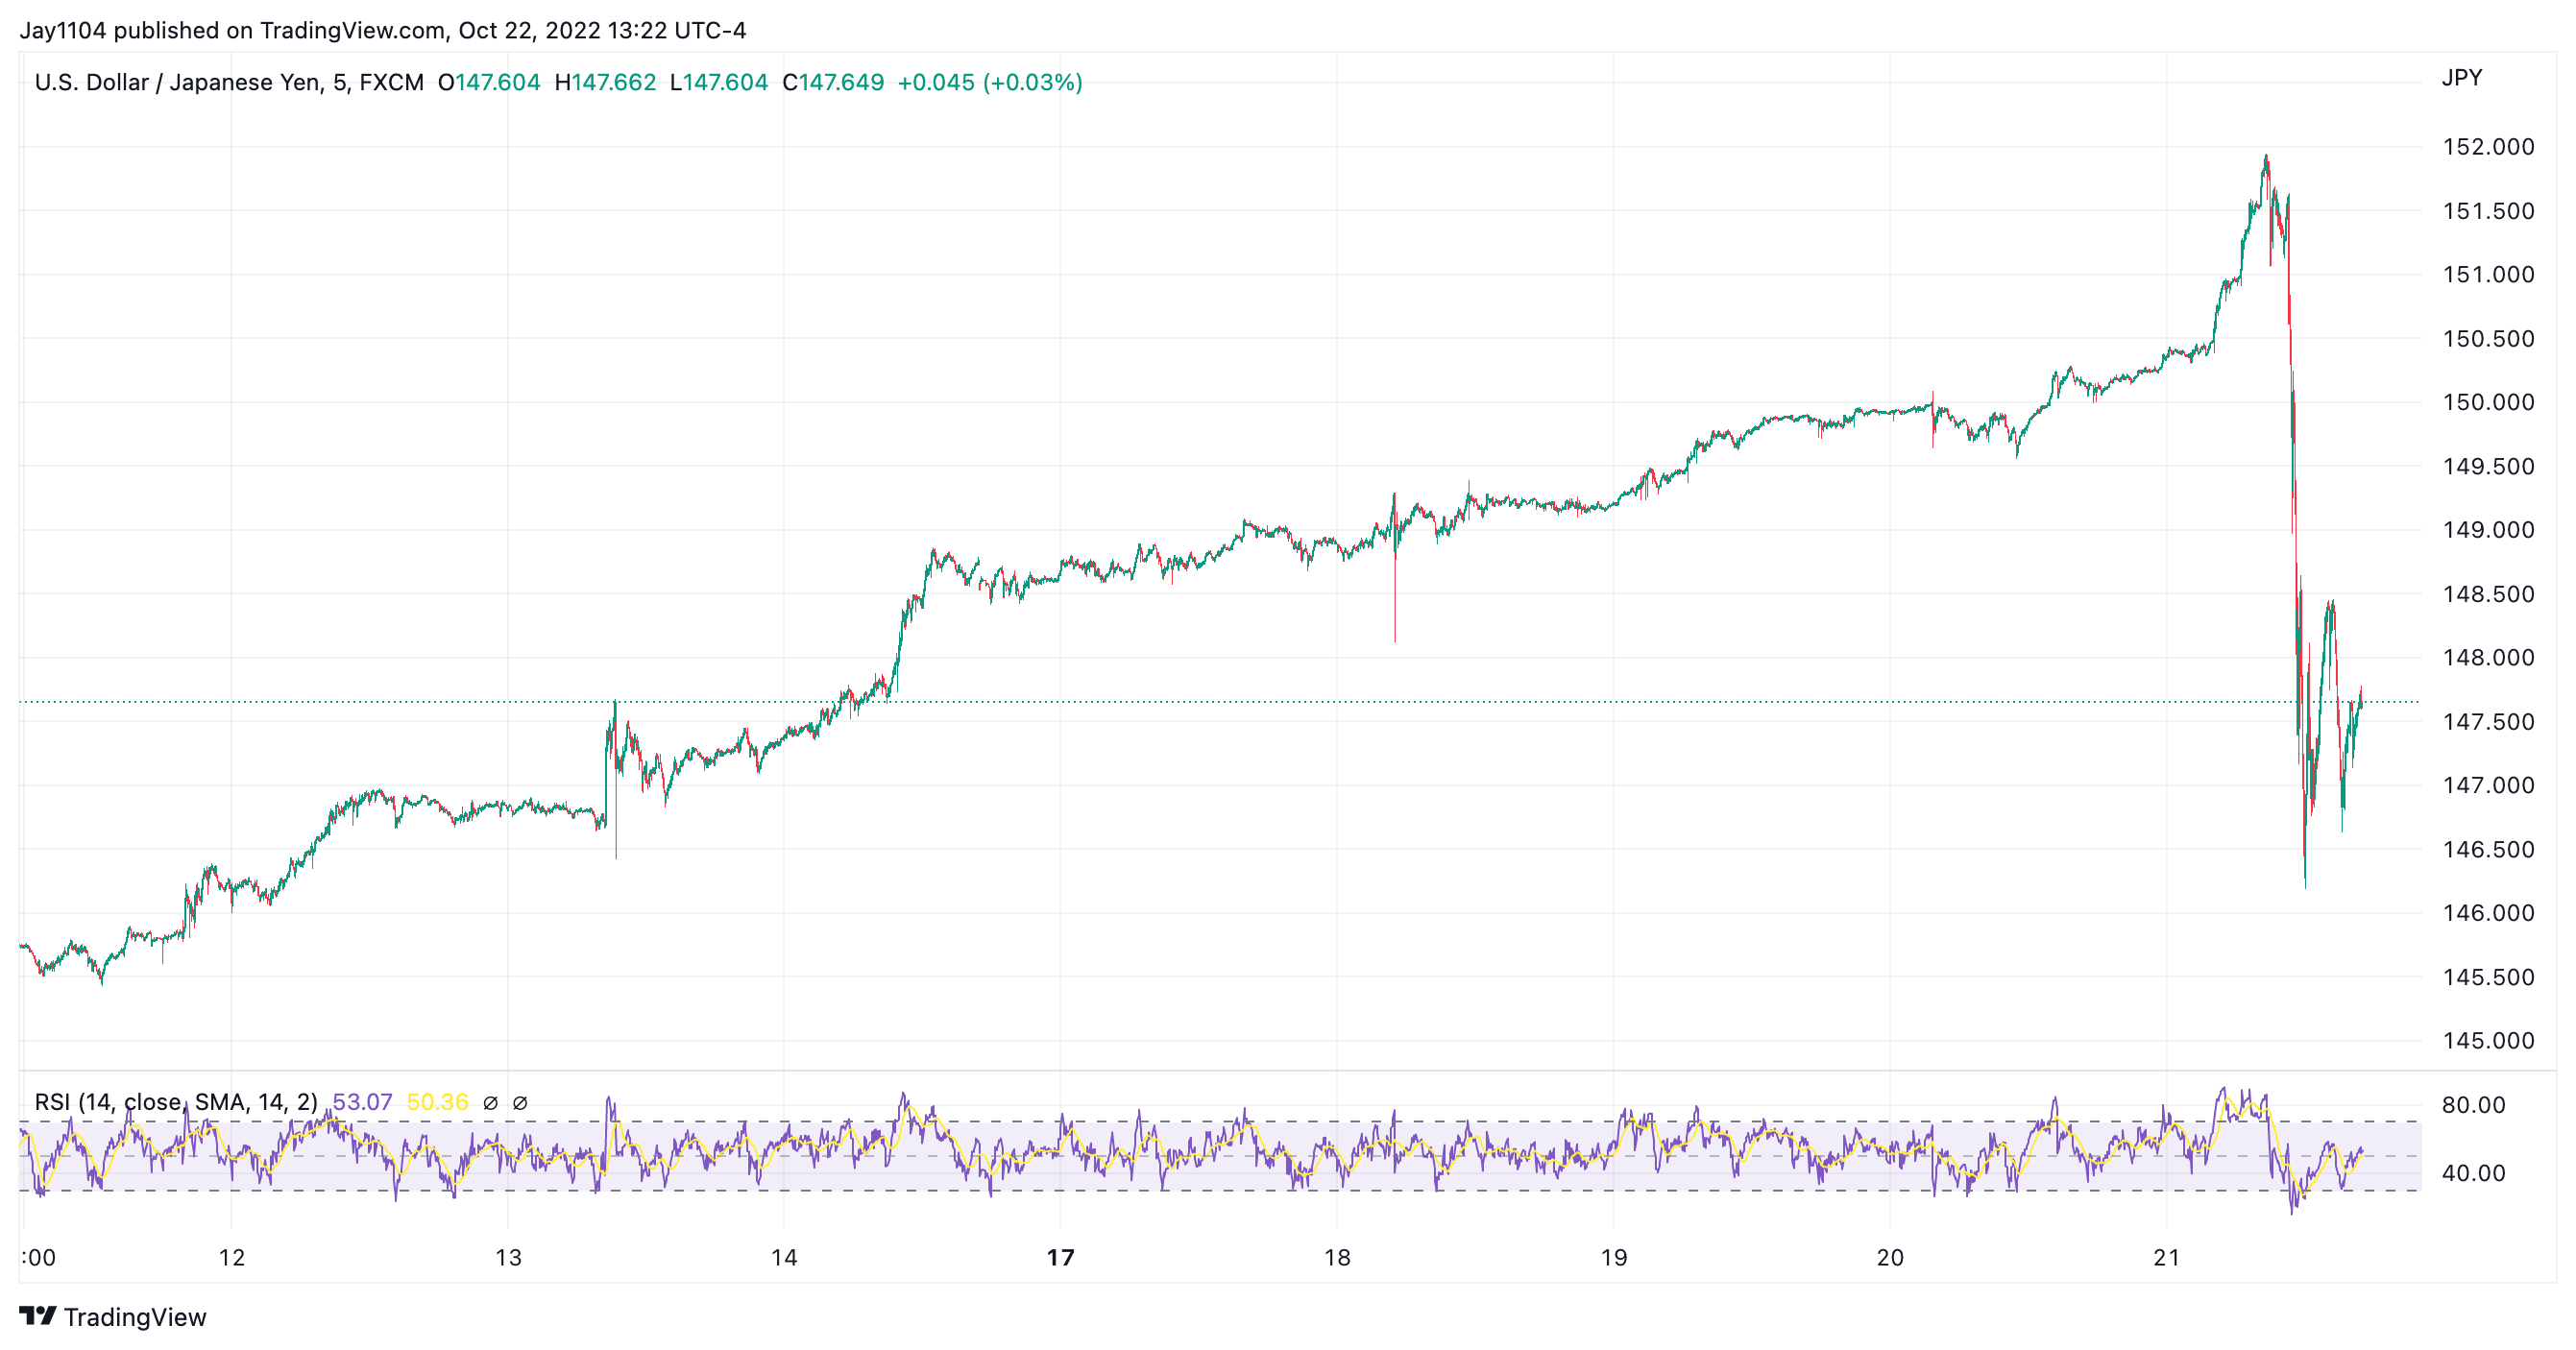
Bond Yields Race Higher
It is clear that bond yields have risen sharply since the CPI report, and the bond market has significantly repriced the Fed’s terminal rates, and more importantly, the time it takes to get to that peak, stocks have not repriced in the same manner. For example, since October 12, the 10-yr rate has risen from 3.89% to 4.22%. Meanwhile, the S&P 500 has increased from around 3,575 to 3,754, while the dividend yield for the S&P 500 has fallen from 1.84% to 1.74%.
Bloomberg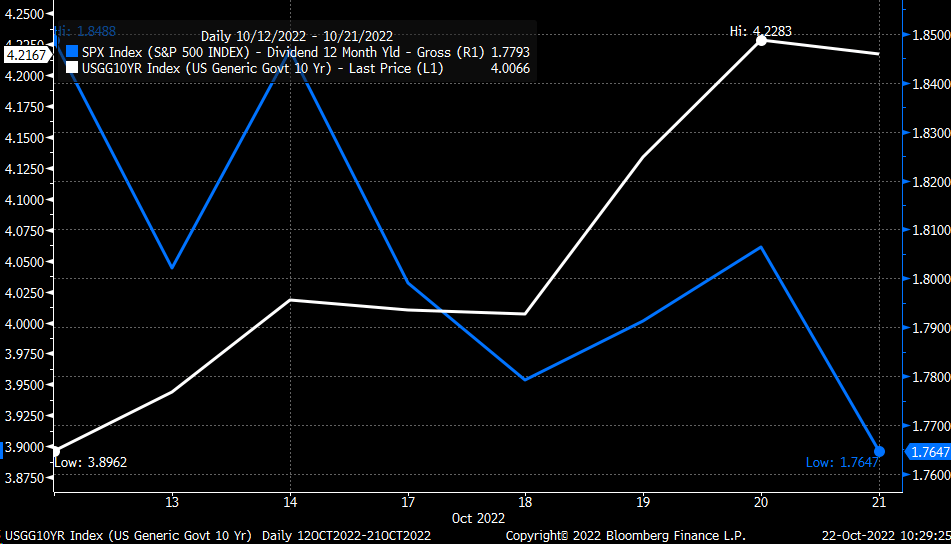
That has allowed the spread between the 10-Yr yield and the S&P 500 dividend yield to rise to 2.45%. That is the highest the spread has been since 2010, and more importantly, it appears to be at an inflection point. Historically, when the spread has gotten to this point, it has acted as support or resistance. Is it possible that the market is resetting to some higher spread, where bonds and stocks revert to pre-financial crisis levels? Sure. But like any technical formation or pattern, when the market hits resistance, it pauses or retraces for a time as it decides what it wants to do.
Bloomberg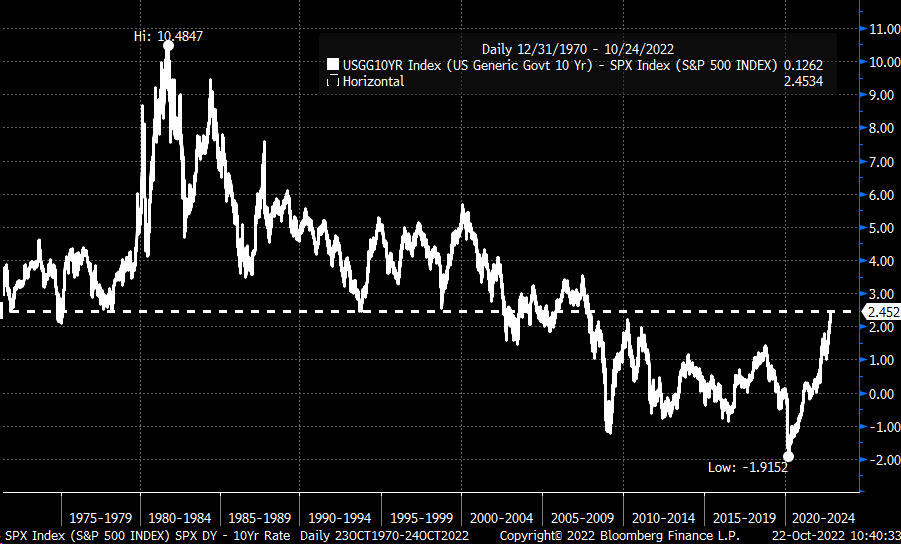
Draining
Additionally, there has been no added liquidity entering the market. This past week, liquidity was drained from the market, with reserve balances falling by around $50 billion to $3.05 trillion as usage of the reverse repo facility increased. Reserve balances have been a strong indicator of where the S&P 500 has gone, with balances typically leading the index by between 5 to 15 days. More recently, the decline would suggest that the stock rally on Friday does not last.
Bloomberg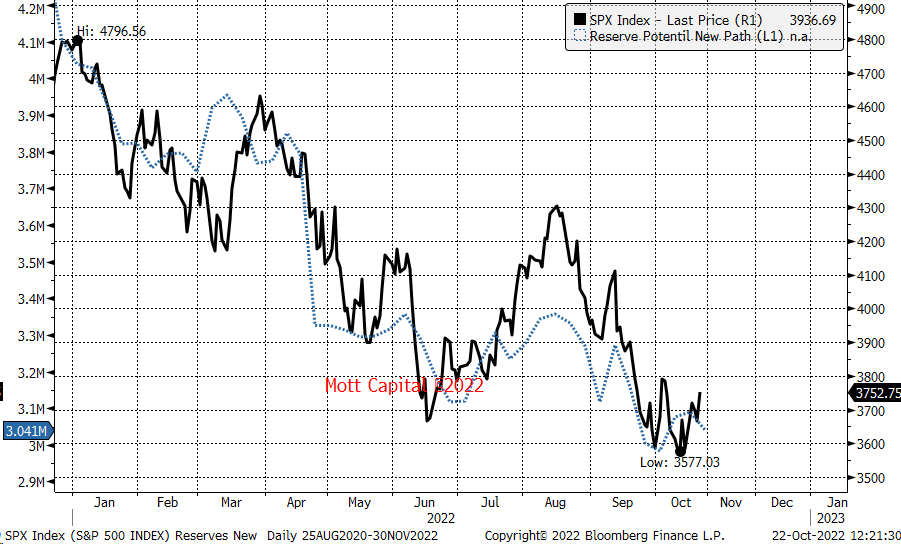
Stronger Dollar
Additionally, there are signs the dollar index can climb from here, with the potential of a bullish continuation triangle forming. The dollar index has been consolidating around the 110 to 114 region since the end of September. Additionally, the RSI has been steadily rising, suggesting the next significant move in the dollar could be higher.
If the dollar breaks down and pushes lower, that would be a risk-on sign suggesting that the equity could run higher. If the dollar index breaks out as the chart indicates and goes higher, that would be negative for stocks, with a sharp decline to follow.
TradingView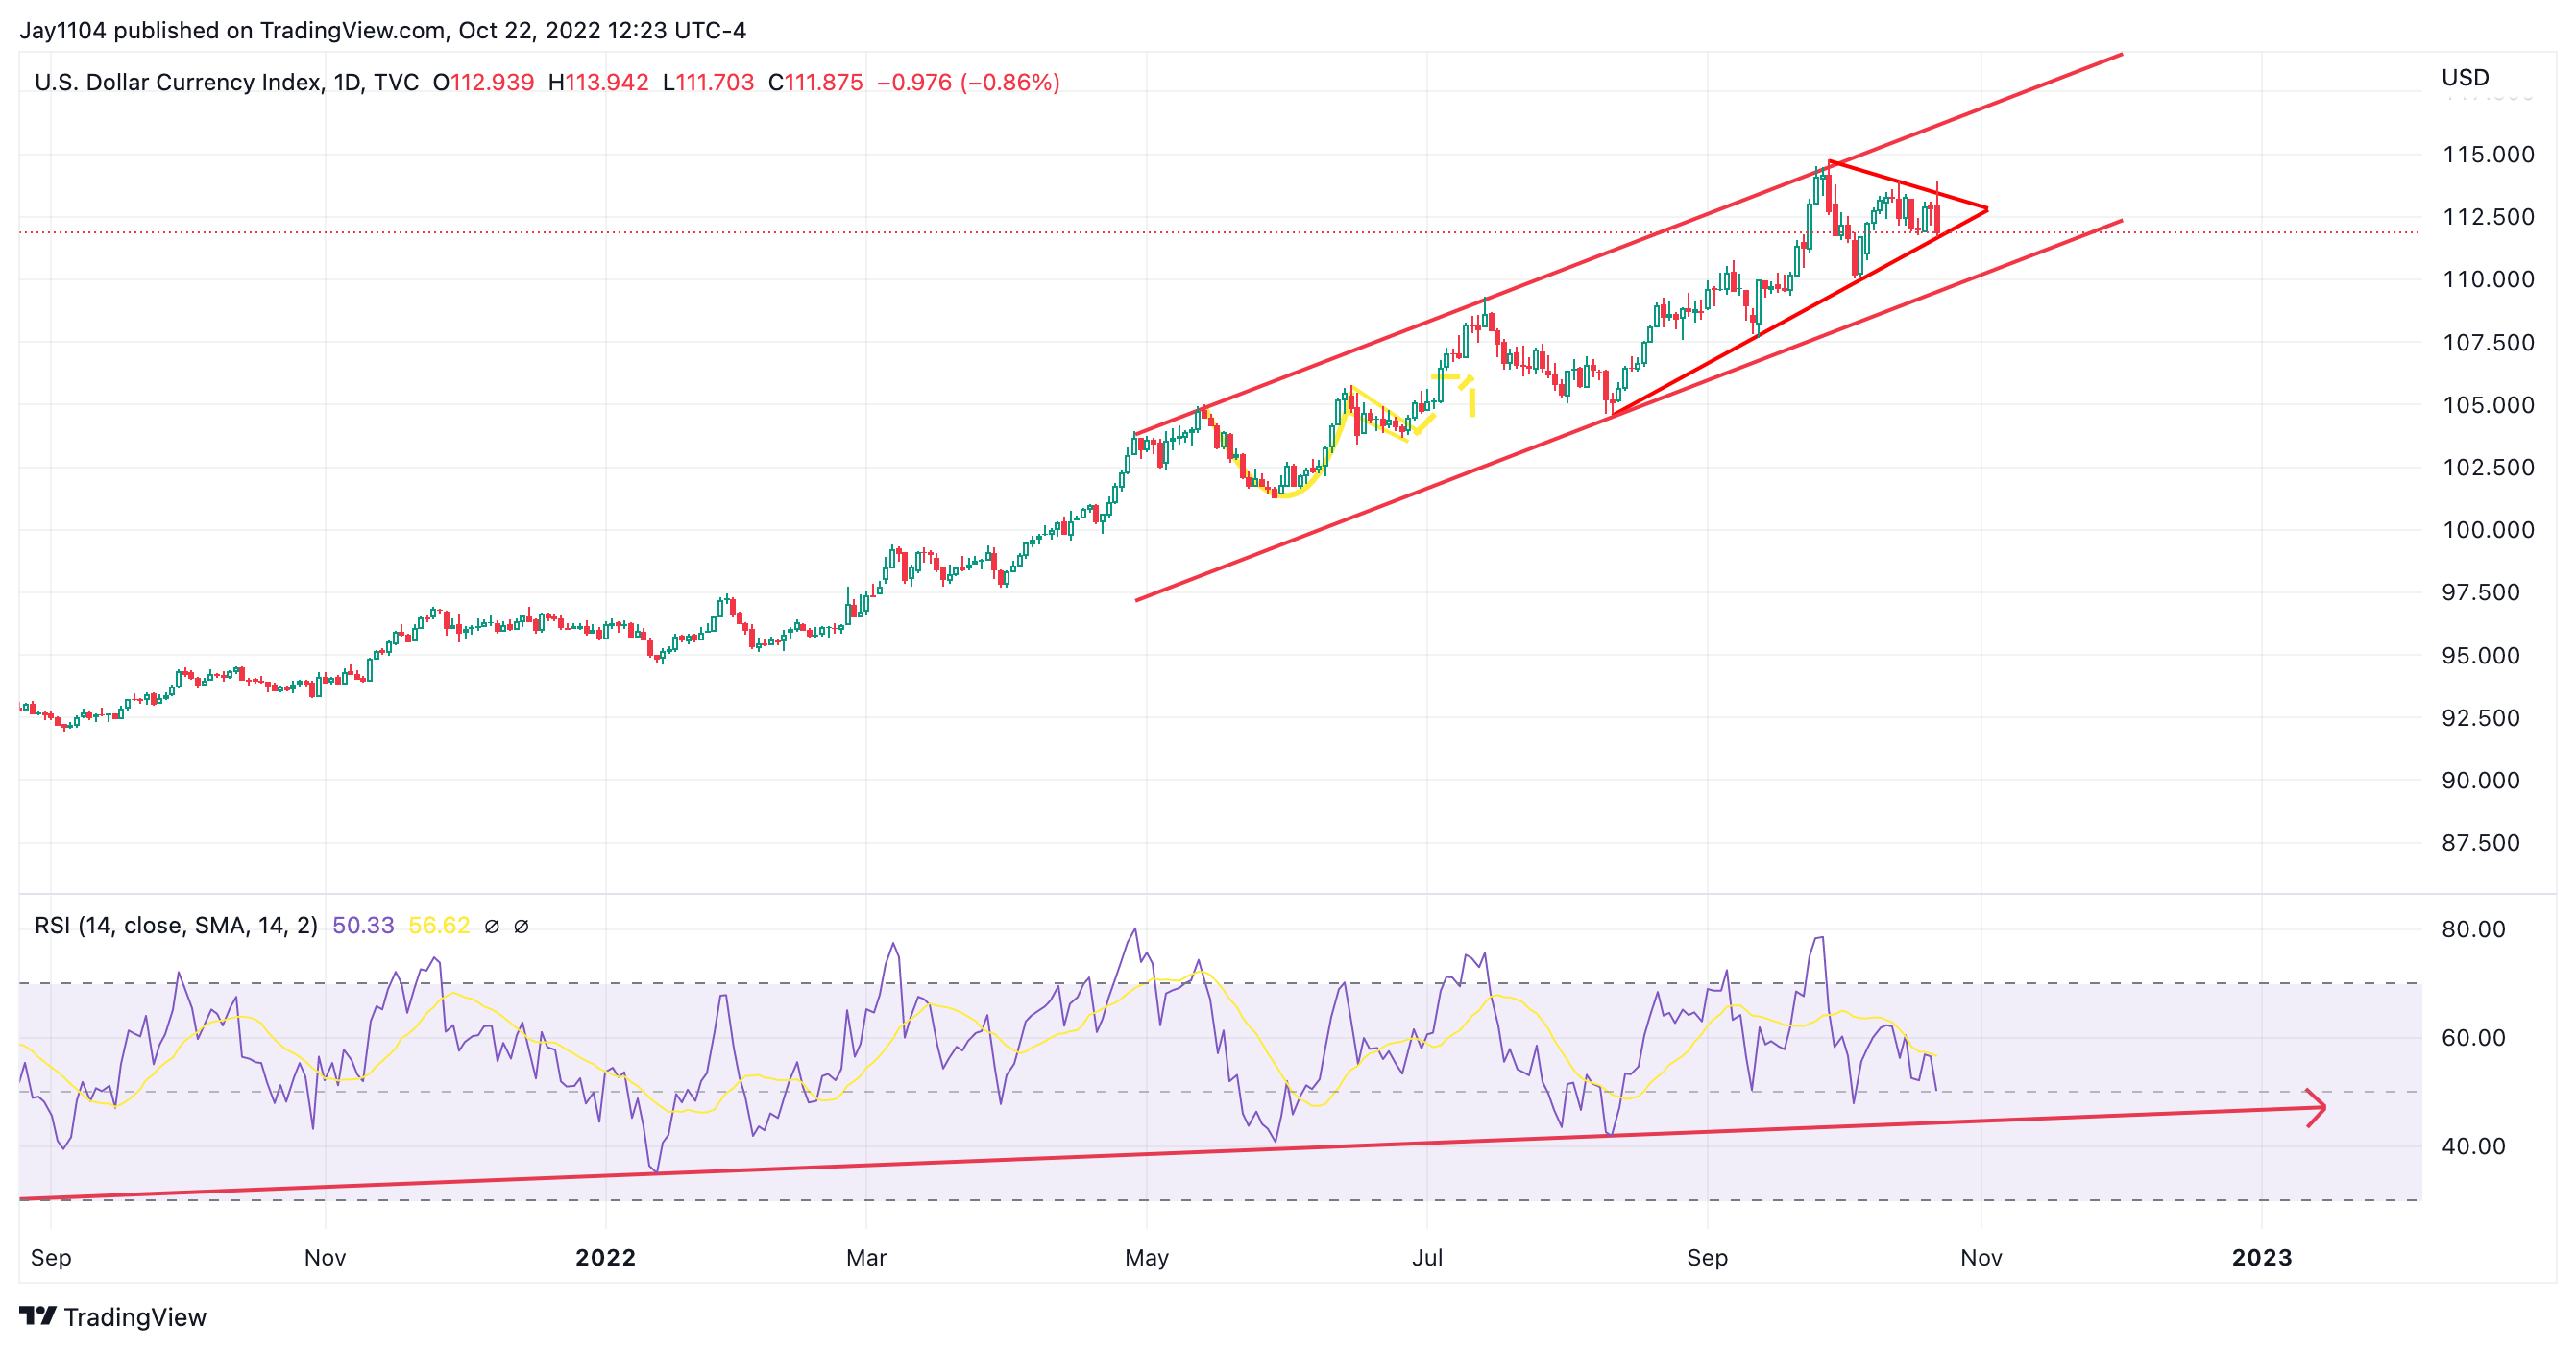
Strong Technical Resistance
Additionally, despite rising on Friday, the S&P 500 could not surpass significant resistance. The 3,750 region is essential because that was around the July lows, and we have seen prior lows act as effective resistance on past rally attempts. For example, in early June, we saw the 4,165 level act as a significant resistance level equal to the March lows.
If the S&P 500 can close beyond the highs seen on October 4, there could be a further run higher of 3,900 and perhaps as high as a gap at 4,108. However, failure to push beyond or close above 3,800 is likely to result in a decline, if not back to the lows, but through them.
TradingView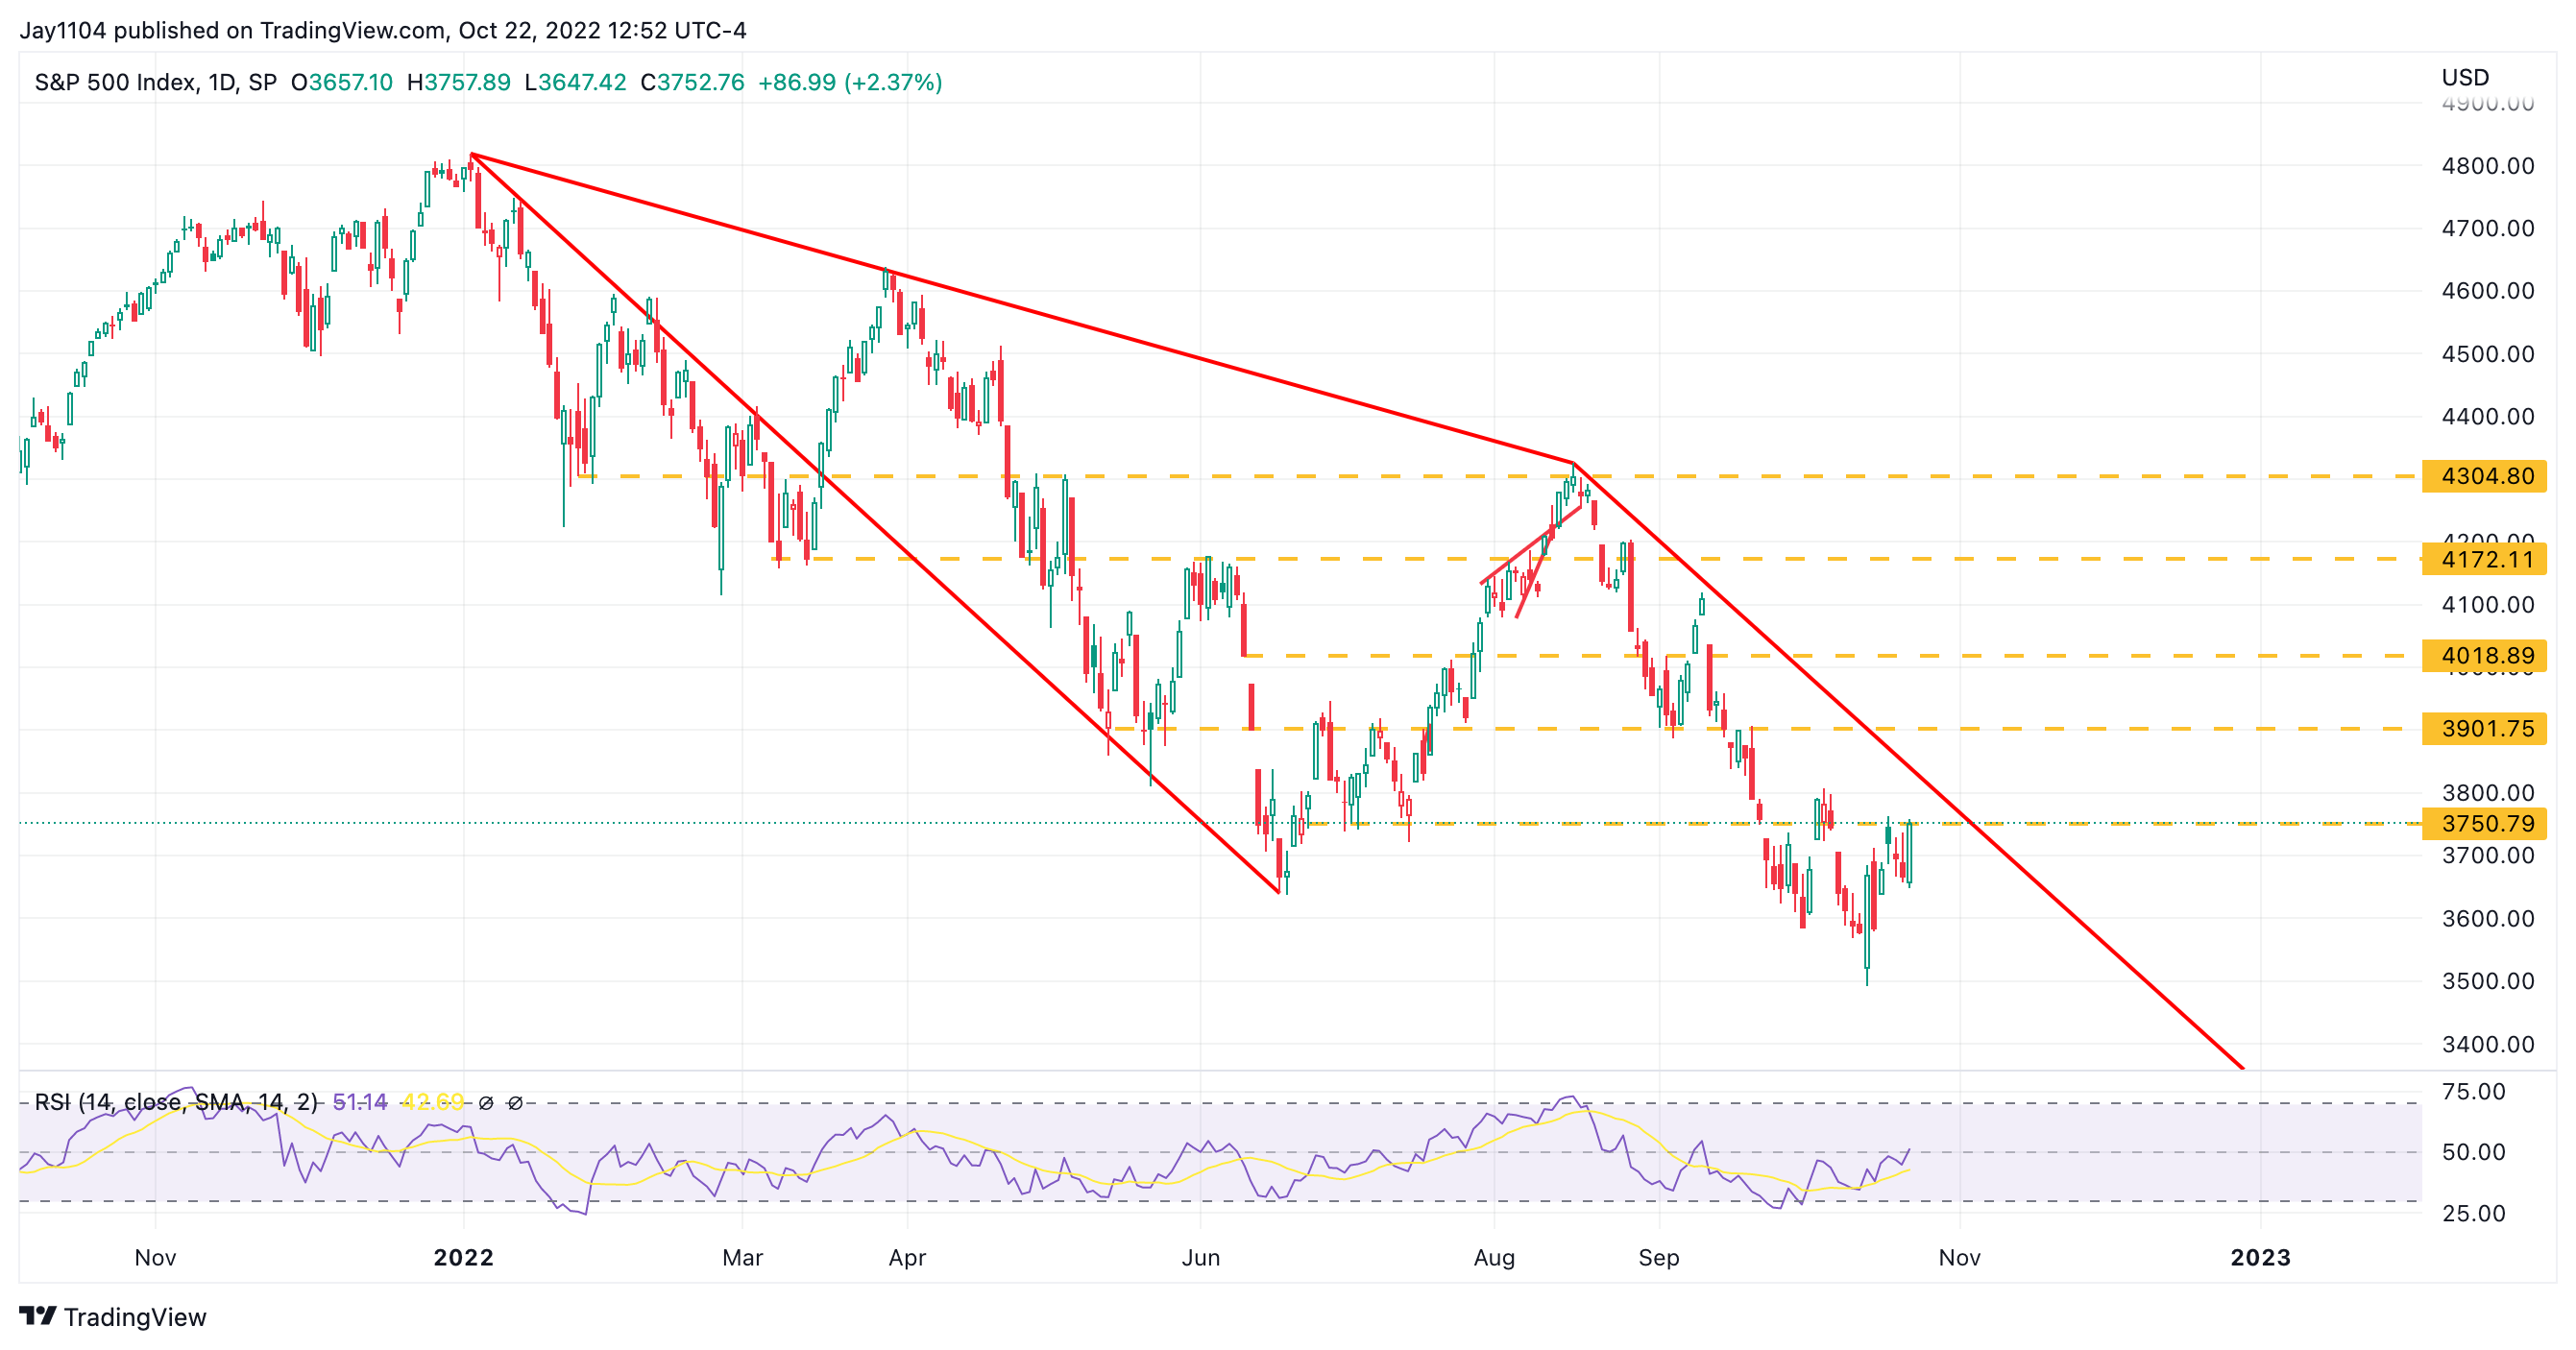
At least for now, there isn’t enough to suggest the equity market rally from last week is the real thing, and there hasn’t been enough stock repricing to reflect the recent move higher in rates.
This coming week will prove to be a pivotal one.