AngloGold Ashanti Stock: Inflationary Pressures Are Biting (NYSE:AU)
bodnarchuk/iStock via Getty Images
Part I – Introduction
1 – First quarter of 2022 results and commentary
On May 9, 2022, Johannesburg-based AngloGold Ashanti (NYSE:AU) released its first quarter of 2022 results ending on March 31, 2022. This release is considered a market update report since the company reports its full results every six months.
AU 1Q22 highlights Presentation (AngloGold Ashanti)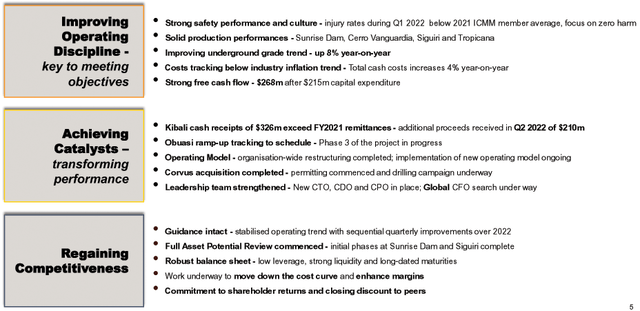
The company indicated solid production during the first quarter of 2022 and completed the Corvus acquisition I have covered here.
Corvus Gold currently holds 100% interest in Nevada’s two mineral properties, the North Bullfrog Project NBP and the Mother Lode Project MLP, both in Nevada. The two projects are in the exploration stage.
One crucial financial element is that the company finally received $326 million from Kibali in DRC and another $210 million after quarter-end.
Note: This article is an update of my preceding article published on April 6, 2022. I have been following AngloGold Ashanti since 2020 and have published four articles.
The company owns producing assets and projects in three continents with advanced projects in Nevada, USA.
1.1 – Africa
Operations produced 330K Oz at a total cash cost of $1,017/oz for the quarter ended 31 March 2022, compared to 352K Oz at a total cash cost of $948/oz for the quarter ended 31 March 2021. The company owns Iduapriem and Obuasi mines in Ghana, Siguiri mine in Guinea, Geita mine in Tanzania, and Kibali in DRC.
1.2 – Latin America
The Americas operations produced 131K Oz at a total cash cost of $986/oz for 31 March 2022. The company owns AngloGold Ashanti Mineração and Serra Grande mines in Brazil; Cerro Vanguardia mine in Argentina.
1.3 – Australia
The Australia operations produced 127K Oz at a total cash cost of $1,160/oz for 31 March 2022. The company owns Sunrise Dam and Tropicana.
1.4 – Nevada USA
AngloGold Ashanti completed its $365 million cash acquisition of Corvus on 18 January 2022.
It allows AngloGold Ashanti to create a low-cost and long-life production base in a premier mining jurisdiction.
AU: Corvus map of the Bullfrog and Mother lode projects (Corvus presentation)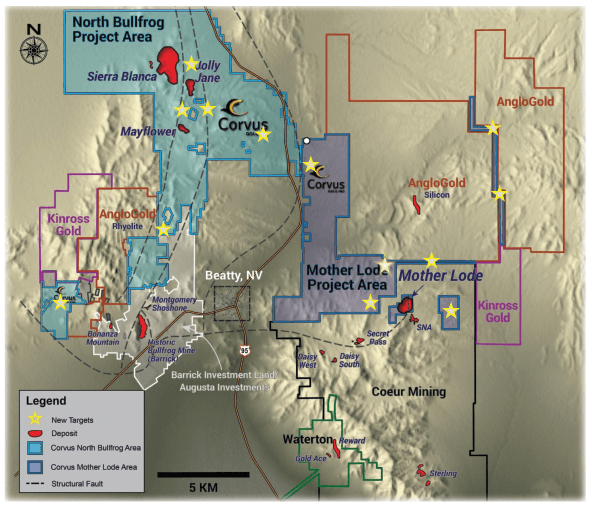
2 – Stock performance
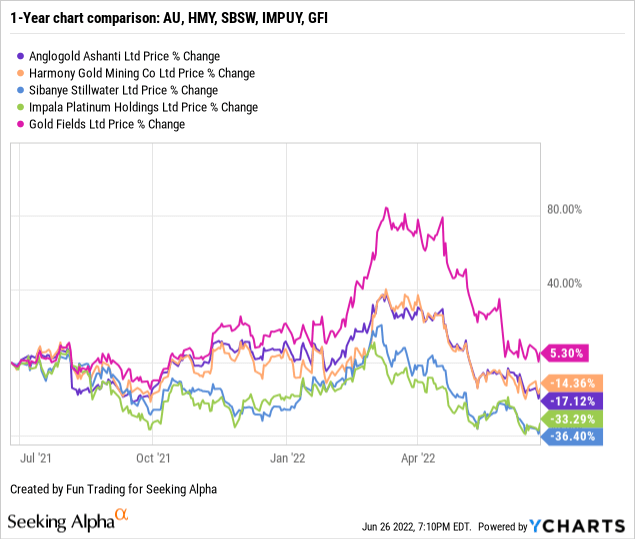
I am covering four other companies located in South Africa: Sibanye Stillwater (SBSW), Harmony Gold (HMY), Impala Platinum (OTCQX:IMPUY), and Gold Fields Ltd. (GFI).
AngloGold Ashanti has dropped significantly since its peak in March 2022. AU is now down 17% on a one-year basis.
Part II – Global Presentation and Gold Production
1 – Quarterly Gold production
1.1 – Quarterly Production
AngloGold Ashanti sold 597K Au Oz in 1Q22. The company indicated that it produced 588K Au Oz in 1Q22 (continued and discontinued), unchanged from a year ago. First-quarter production was flat year-on-year with solid contributions from Sunrise Dam, Cerro Vanguardia, Siguiri, and Tropicana.
AU Quarterly Gold Production 1Q22 4Q21 1Q21 (Fun Trading)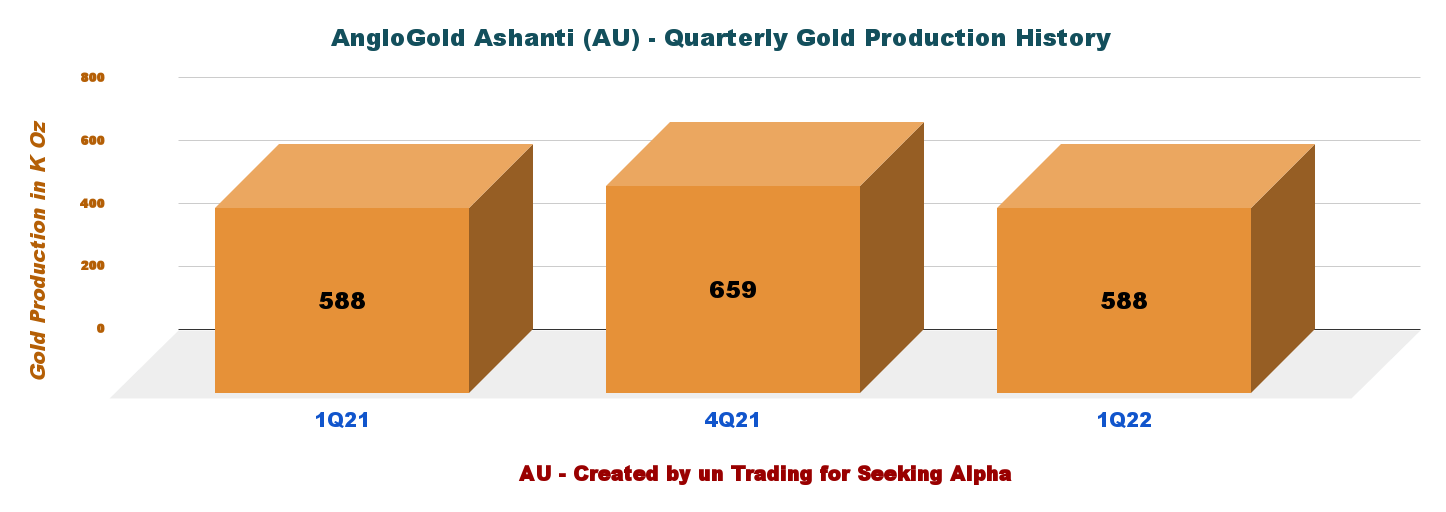
1.2 – Quarterly production per mine
The company produced gold from ten different mines:
AU Quarterly gold production comparison per mine – 1Q21 versus 1Q22 (Fun Trading)
Obuasi mine is on track to achieve a full mining rate of 4,000 TPD by June 2022.
2 – All-in Sustaining Costs and Gold price realized
All-in sustaining cost (AISC) was $1,405 per ounce in 1Q22. An increase of 9.2% from the last year-quarter mainly due to planned higher sustaining CapEx and increased total cash costs. Inflationary pressures are getting more robust, and the company said in the press release:
AU Quarterly gold price and AISC – 1Q21, 4Q21 and 1Q22 (Fun Trading)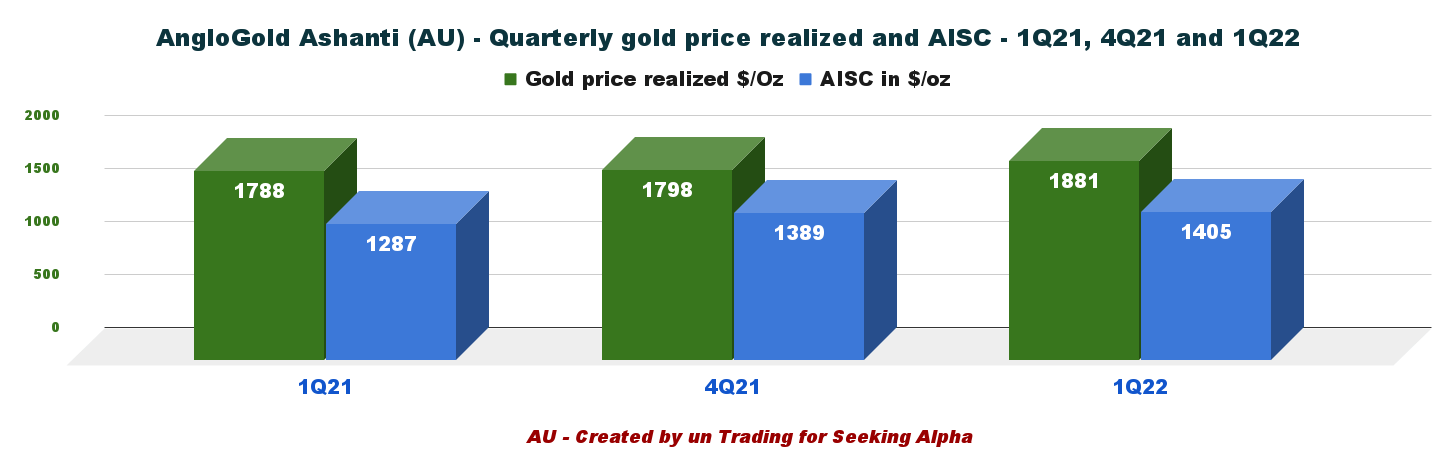
Part III – AngloGold Ashanti – Balance Sheet and Production for 1Q22: The Raw Numbers
Note: Like most South African gold and PGM miners, full results are posted every six months, complicating the analysis.
| AU | 1Q21 | 4Q21 | 1Q22 |
| Total Revenues in $ Million | 956 | 1,039 | 1,016 |
| Gross profit in $ Million | 279 | 274 | 259 |
| Adjusted EBITDA $ Million | 449 | 478 | 438 |
| Cash from operating activities in $ Million | 149 | 460 | 533 |
| Capital Expenditure in $ Million | 241 | 348 | 265 |
| Free Cash Flow in $ Million | -92 | 112 | 268 |
| Total Cash $ Million | 1,081 | 1,154 | 1,045 |
| Adjusted Net debt in $ Million | 908 | 755 | 917 |
| Shares outstanding (diluted) in Million | 419.30 | 420.06 | 420.25* |
| Gold Production | 1Q21 | 4Q21 | 1Q22 |
| Total Gold production in K Oz | 588 | 659 | 588 |
| Gold production sold in K Oz | – | – | 597 |
| Gold price realized $/Oz | 1,788 | 1,798 | 1,881 |
| AISC in $/Oz | 1,287 | 1,389 | 1,405 |
Source: Company filings
* Estimated by Fun Trading
AngloGold Ashanti: Balance sheet details
1 – Revenues and Trends. Revenues were $1,016 million in 1Q22
AU: Quarterly revenue history 1Q22 4Q21 1Q21 (Fun Trading)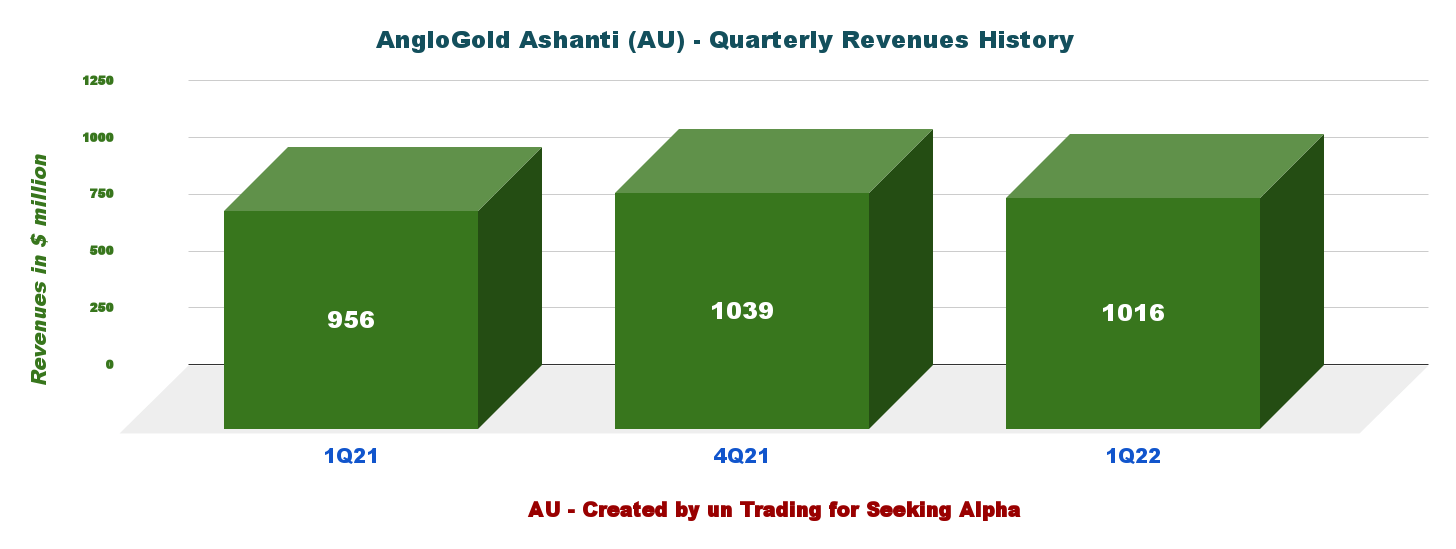
The revenues for 1Q22 were $1.016 billion, or $60 million above the first quarter of 2021. Higher gold price this quarter helped.
The company said in the press release:
AngloGold Ashanti is embedding a new Operating Model after completing the implementation of an organisation-wide restructuring. The Company has introduced new leadership and removed duplicate roles and unnecessary expenditure to reduce costs and improve operating results
2 – Free cash flow was $268 million in 1Q22
AU Quarterly Free Cash flow history (Fun Trading)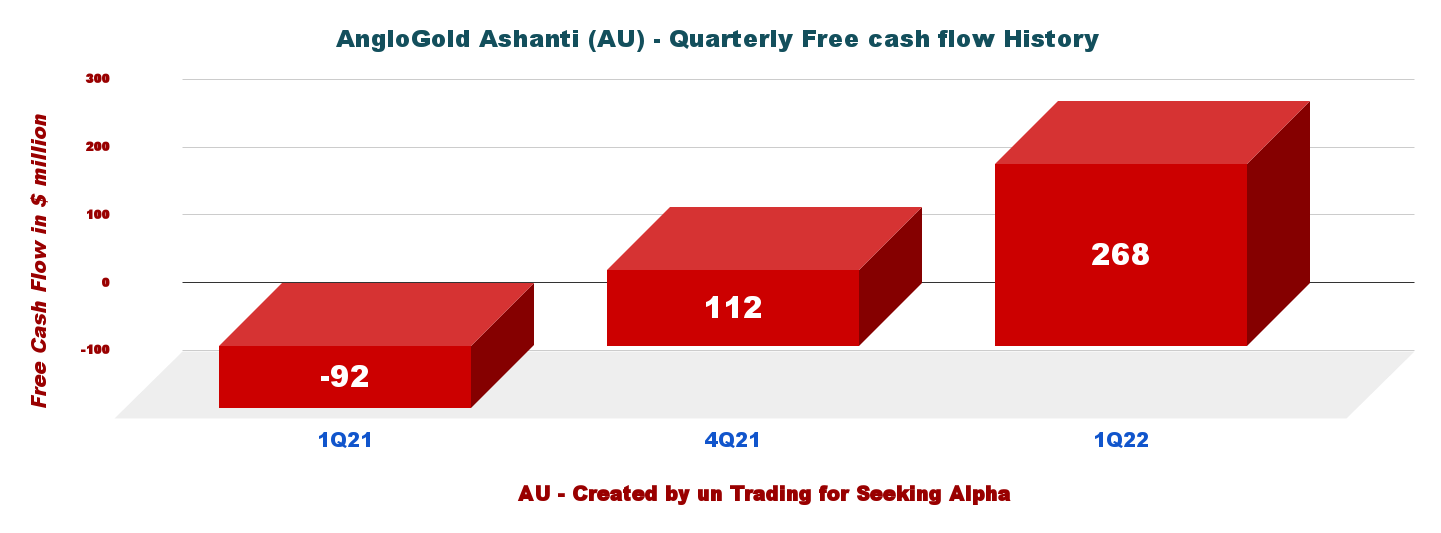
Note: Generic free cash flow is the cash from operations minus CapEx. AngloGold Ashanti’s Free Cash Flow was $268 million in the first quarter of 2022 compared to a loss of $92 million in 1Q22.
This quarter’s increased free cash flow was boosted by the $326 million received from the Kibali gold mine in the Democratic Republic of the Congo. The company has cash locked up in DRC, Tanzania, and Argentina.
In 1Q22, the situation improved significantly with a balance of $232 million.
Note: An additional $210 million from Kibali DRC was received after quarter-end.
AU Cash Lock ups improvement Presentation (AngloGold Ashanti)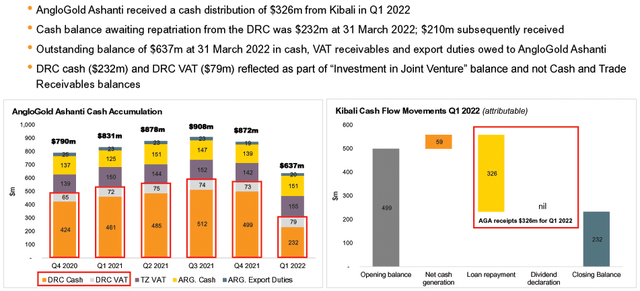
3 – AngloGold Ashanti’s debt situation is excellent
AU Quarterly Cash versus Adjusted Net Debt history (Fun Trading) AU: Balance sheet and liquidity (AngloGold Ashanti)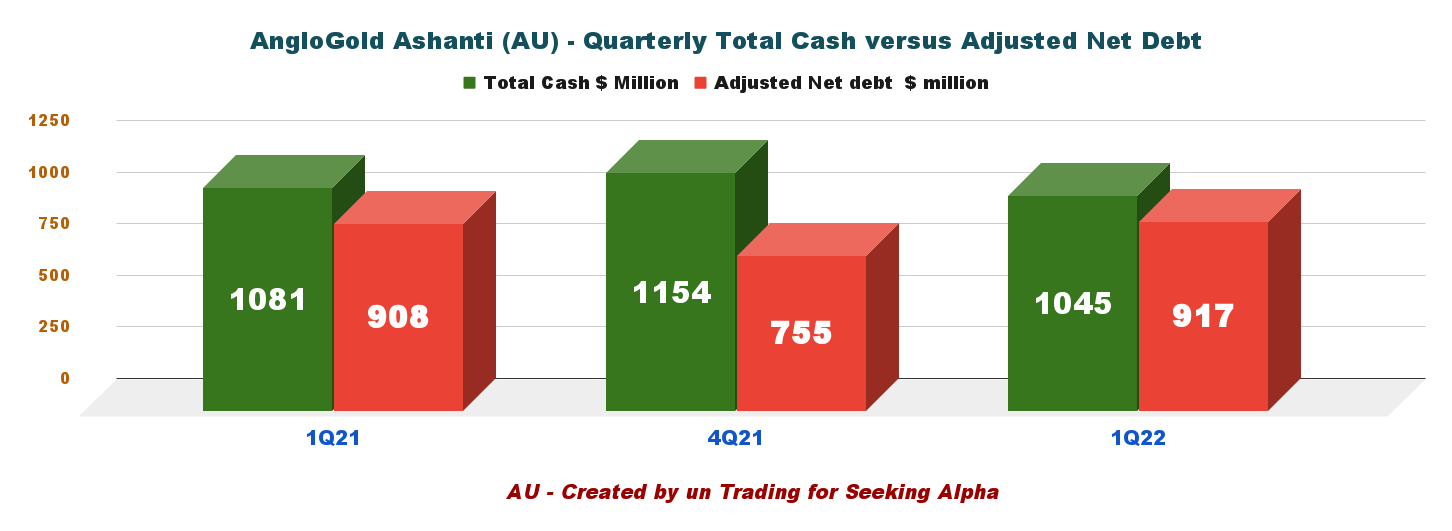
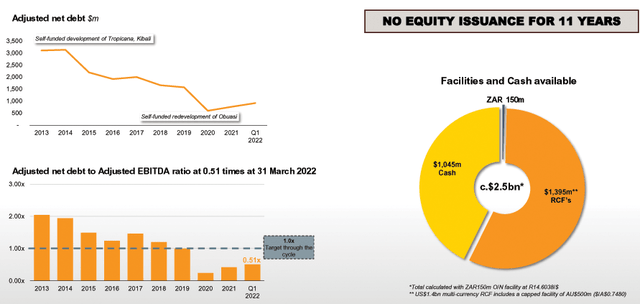
It is a solid debt profile that encourages investors to bet for the long term.
4 – 2022 Guidance still on track
2022 gold production is expected to be 2.55 Moz to 2.80 Moz, and AISC is seen between $1,295 and $1,425 per ounce ($1,360 midpoint). The guidance has not changed since my preceding article.
CapEx will be between $1.05 billion and $1.15 billion.
AU 2021 Guidance Presentation (AngloGold Ashanti)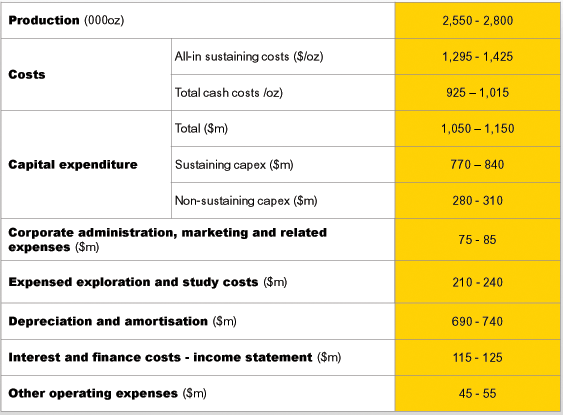
The Company’s production is expected to be second half weighted, with unit costs expected to decline into the second half of 2022. Against the current global landscape, we expect inflationary pressures to persist for the remainder of the year. The business is working proactively to mitigate this impact though the implementation of the new Operating Model, which is aimed at improving operating efficiencies, the continuous Operational Excellence programme already in place, and the Full Asset Potential Review. In addition, the continued prevalence of COVID-19 remains a risk to guidance.
Part IV – Technical Analysis and Commentary
AU TA chart short -term (Fun Trading)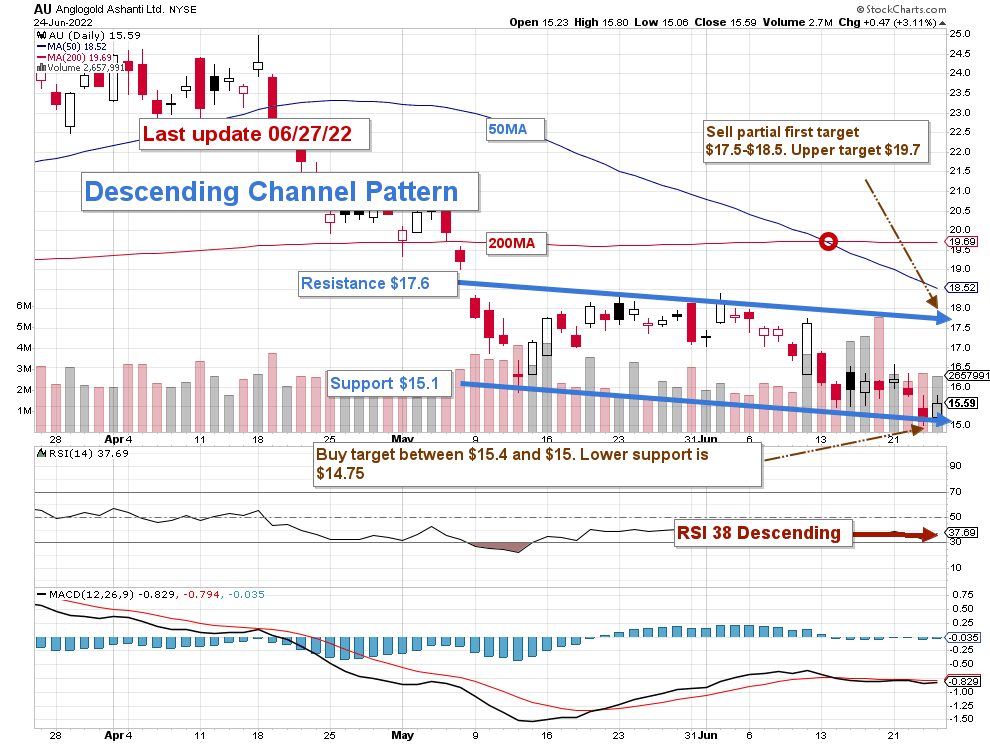
AU forms a descending channel pattern with resistance at $17.6 and support at $15.1.
The Fed acted firmly against inflation and raised the interest rate by 75 points early in June. Moreover, it has repeatedly revealed that it will hike interest even more in 2022 and potentially another 75 points the next meeting in July. While inflation is a significant plus for gold, any attempt by the Fed to fight it by hiking interest will weaken the gold price.
Thus, the general strategy has not changed for AngloGold Ashanti. I recommend trading short-term LIFO about 40%-60% and keeping a core long-term position for a final target of $28. It is the basic strategy that I support in my marketplace, “The Gold and Oil corner.”
For this week, I recommend trading the channel by selling about 40%-60% of your position between $17.5 and $18.5 and accumulating between $15.4 and $15 with potential lower support at $14.75.
Note: The LIFO method is prohibited under International Financial Reporting Standards (IFRS), though it is permitted in the United States by Generally Accepted Accounting Principles (GAAP). Therefore, only US traders can apply this method. Those who cannot trade LIFO can use an alternative by setting two different accounts for the same stock, one for the long-term and one for short-term trading.
Warning: The TA chart must be updated frequently to be relevant. It is what I am doing in my stock tracker. The chart above has a possible validity of about a week. Remember, the TA chart is a tool only to help you adopt the right strategy. It is not a way to foresee the future. No one and nothing can.
Author’s note: If you find value in this article and would like to encourage such continued efforts, please click the “Like” button below to vote for support. Thanks.