Addus HomeCare: Reaffirm Buy On Valuation, Future Value Creation (NASDAQ:ADUS)
andresr/E+ via Getty Images
Investment Summary
Since our last publication on Addus HomeCare Corporation (NASDAQ:ADUS) we remained bullish on the stock, and have been pleased to see it take out our price objectives of $96 and $103. It recently booked $240mm in Q3 revenues and brought this down to $0.94 in EPS, solid numbers in our opinion.
As a reminder, our previous note on ADUS extracted the below findings:
- Presented with resiliency and defensibility characteristics investors are paying a premium for in H2 FY22.
- Valuations are supportive of this resiliency premium and corporate value stands up well even with necessary adjustments.
We recommend you check out our last note on ADUS:
- Addus HomeCare: Ideal For Those Looking To Step Up In The Quality, Resiliency Spectrum
ADUS now trades above this range, and following its Q3 results earlier this month, we’re back today to reinstate our buy thesis on ADUS. In summary, we’ve revised our price target to $138, rating a buy on valuation and future value creation.
Q3 earnings breakdown – growth across key segments
Turning to ADUS’ quarter, we note the strengths exhibited across the company’s portfolio. It reported earnings on November 1st. Labor [shortages, expenditure] remains an issue within the broader health care spectrum. To this point, ADUS notes it made good headway in Q3, evidenced by the ~300bps sequential increase in hours per day in its personal care segment from Q2 FY22.
Compare this to the same time last year, ADUS’ hours per business day is up 14%. Management also made good reference to its M&A strategy looking down the line. It believes its capital structure and sub-1x net leverage [from adjusted EBITDA] are key levers in pointing the company to its next acquisition target.
Switching to ADUS’ numbers, we observed several operational highlights worth mentioning. To name a few:
1. Revenue growth of 11% YoY pulled into $240.5mm. This was underscored by a healthy growth route across the portfolio. We suspect ADUS’ top line growth results from its same-store growth trends across the quarter, along with a supportive end-market, with patient trends normalizing toward pre-pandemic values. Per CEO Dirk Allison on the Q3 call:
While we had similar admissions to what we saw in the second quarter of this year, starting in late August, we did experience a higher than normal discharge rate. During October, we started to see higher admissions volumes likes while our discharges started to return to a more normal level, which we believe should grow our [average daily census] ADC.
2. Revenue disaggregation points to upsides in the company’s personal care segment. Respectively, personal care contributed 74.5% or $179.2mm to the top, hospice 21.4% or $51.4mm and home health revenues of $10mm or a ~410bps revenue share. Noteworthy, the hospice division booked first revenues from the Armada and JourneyCare [hospice] acquisitions, deals finalized in August 2021 and February 2022 respectively. Noteworthy is that it also completed the acquisition of Apple Home Healthcare on October 1st, 2022. A backward look of ADUS’ quarterly operating performance to date is seen in Exhibit 1.
Exhibit 1. ADUS continues to stretch up revenue, EBITDA growth on a sequential basis. Meanwhile, it’s held a c.500bps trailing FCF yield since FY18′ on this growth
Data: ADUS SEC Filings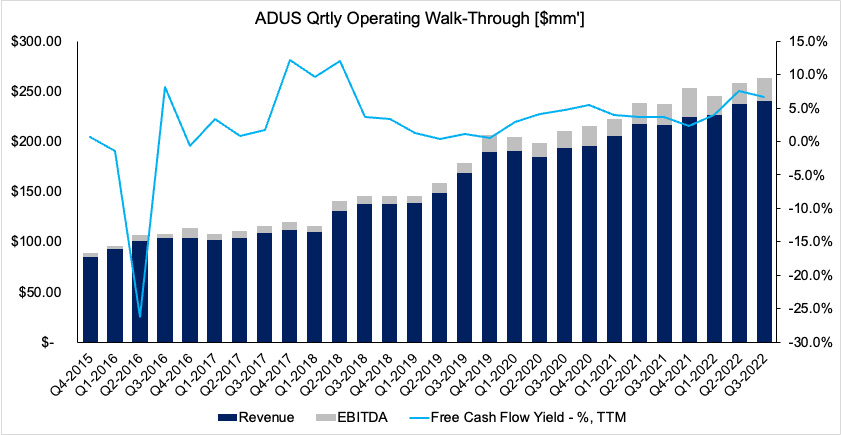
3. Speaking of acquisitions, after examining ADUS’ quarterly numbers from Q1 FY22′ – Q3 FY22, we surmise that it’s recognised a combined $65mm in annualized revenue from its JourneyCare, Apple Home Healthcare acquisitions across this YTD.
4. Median length of stay crept back toward pre-pandemic levels of roughly 28 days, up from 23 days in Q2 FY22. The uptrend in part was driven by the higher than normal discharge rate discussed previously.
5. We observed another strong quarter of net CFFO to $18.3mm driven by increase in productivity and patient trends labelled earlier. This included $4.4mm in ARP funding. For the YTD, it had clipped $80.8mmm in net CFFO, versus $14.3mm by this time last year [Exhibit 2]. It recognized this on Q3 FY22′ adjusted EBITDA of $25.7mm, or 10.7% of sales.
6. On these figures, it paid down $93mm of its revolver this YTD with $33mm of this retired in Q3 alone. Consequently, management said it reduced ADUS’ net leverage to <1x adjusted EBITDA. Management also noted it is comfortable leveraging up to 2.5-3x on an ongoing basis, but will accept 3.5x net leverage “for the right strategic deal if we saw a way to pay that back down through cash flow”.
Exhibit 2. ADUS net cash from operations, FY22′ 9-months to date vs FY21′ equivalent.
Data: ADUS Q3 FY22 10-Q, pp. 7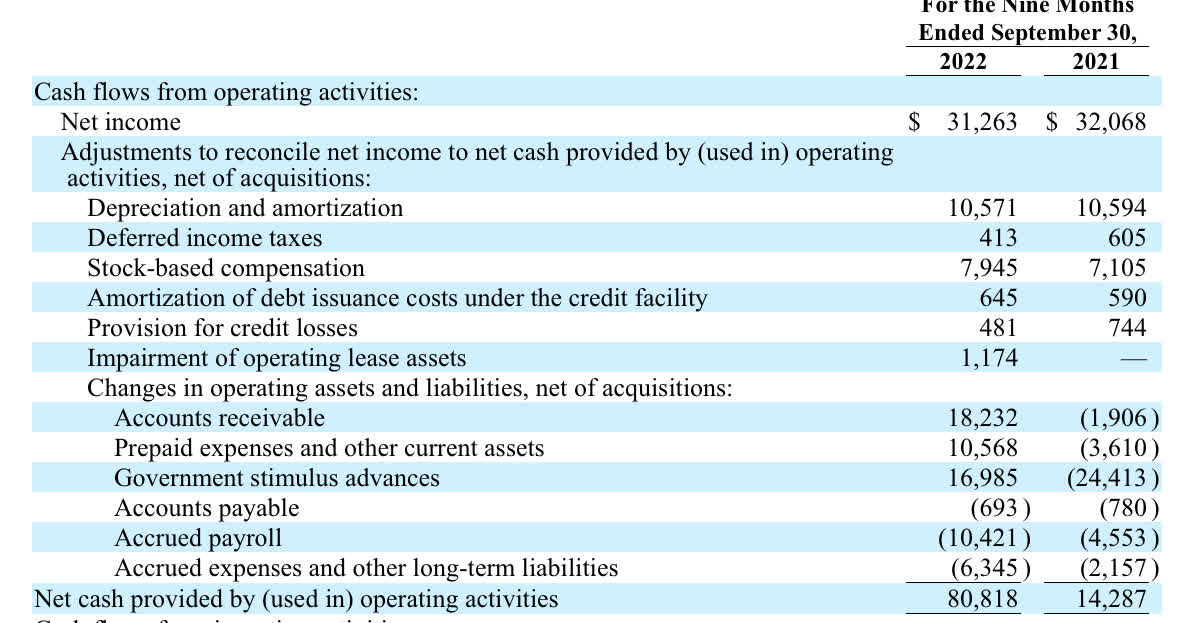
Turning to the company’s divisional highlights, we observed the following as standouts:
- Hospice average daily census (“ADC”) lifted to 3,280 in Q3 versus 2,269 the same time last year. As a reminder, ADC measures total patient days divided by the number of days in the period. Meanwhile, the hospice division’s average discharge length of stay reduced to 93 days from 95 days the year prior. Whereas revenue per patient day increased to $170 from $162 over trailing 12 months.
- We saw that days sales outstanding (“DSO”) came in flat sequentially to 46.2 days, helping maintain a healthy pace of cash receipts from customers. One of ADUS’ major paying states, Illinois, saw its lowest DSO on record at 35.4 days for the company. Management note it expects this uptrend in cash conversion to continue into the coming periods, especially in states running budget surpluses. This is true in Illinois looking ahead.
- We see the clinical care division realized a 15.1% YoY increase in same store admissions. It’s also noted the patient mix drifted towards non-episodic care, and we agree with ADUS’ moves in prioritizing a return to pre-pandemic admission rates in this segment.
- It’s also worth noting that ADUS retained its tight relationship between free cash flow (“FCF”) and return on invested capital (“ROIC”) last quarter. We note the company has held an average ROIC range of 6-8% from FY15-date [Exhibit 3]. The key takeaway is that in periods of FCF decline/outflow there’s been a corresponding uptick in trailing ROIC [and vice-versa]. The ROIC curve has flattened since Q1 FY22, not surprising seeing as the cost of capital has lifted to multi-year highs. We need to see this lift higher though, as its current WACC is 8.53% vs TTM ROIC of ~6.5%.
Exhibit 3. Tight fit between FCF and trailing ROIC demonstrating proficiency in capital budgeting
Note: All figures in $mm [ LHS] or percentage [RHS]. FCF calculated as [NOPAT – investments]. ROIC calculated as [NOPAT/Invested Capital]. (Data: HB Insights, ADUS SEC Filings. )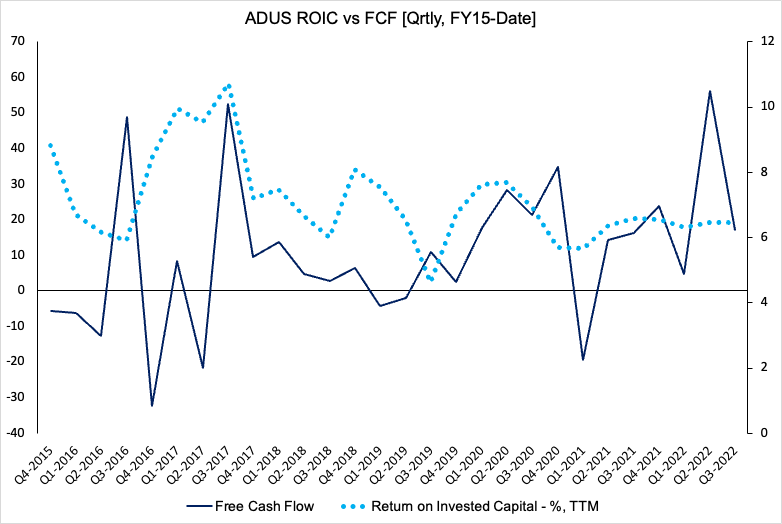
We decided to investigate the quarterly ROIC further and see where the value is being created. Breaking it down to its sub-components, NOPAT margin [NOPAT/sales] and invested capital turnover [sales/invested capital], we observed some interesting trends.
You can see that NOPAT margin has been the main driver of ROIC growth since FY17 [Exhibit 4]. It has curled up whilst invested capital turnover has shifted down. This tells us that management have been less active on investing capital each quarter, and that profitability – measured by NOPAT and NOPAT margin – is a key driver of earnings for ADUS.
Exhibit 4. Stripping back drivers of ROIC we noted that NOPAT margin is the key driver to ROIC upside
Data: HB Insights, ADUS SEC Filings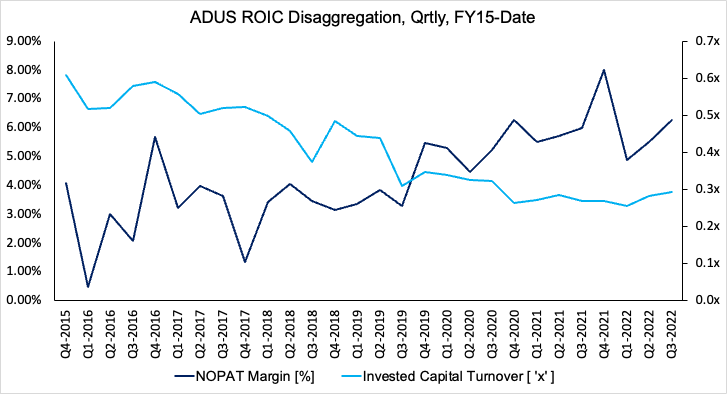
Valuation and conclusion
We should note that we see continued upside at the top and bottom lines for ADUS looking ahead. Specifically, we estimate $949mm for ADUS in FY22, stretching up to ~$1Bn and $1.08Bn in FY22-24′ respectively.
Moreover, we project 28.5% YoY growth in EPS to $3.60 in FY22. EPS growth projections of 11% and 12.5% the following 2 years isn’t an unreasonable expectation in our opinion either. Our growth assumptions are built on the company’s current run-rate and its forecasts on CFFO downstream, alongside an improving macro environment in the healthcare market.
You can see our forward estimates for ADUS at the top and bottom lines in Exhibit 5 and 6 respectively.
Exhibit 5.
Data: HB Insights Estimates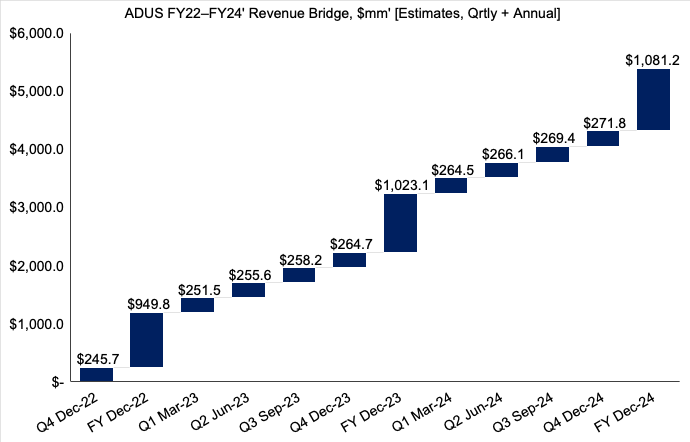
Exhibit 6.
Data: HB Insights Estimates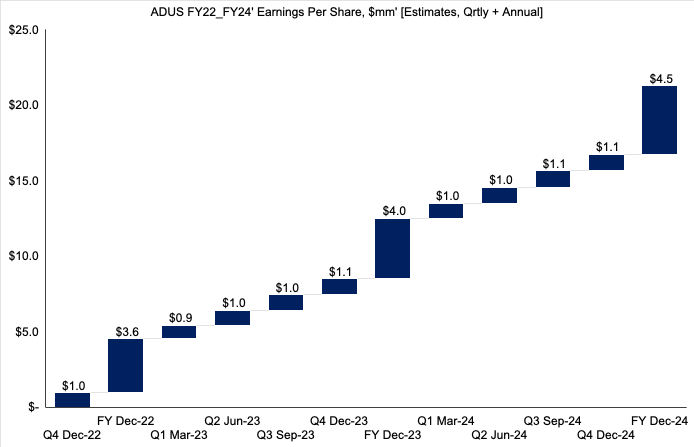
Last time we suggested a price range for the ADUS share price of $96-$103. The stock has since punched up above this level, knocking these objectives out. We should also note that consensus values ADUS at 30-38x forward P/E [for non-GAAP and GAAP EPS respectively]. The FY22 forward P/E estimate for the S&P 500 is 18.18x. Hence, consensus expects ADUS to outpace the benchmark.
We agree with this viewpoint and believe ADUS should trade at a fair forward P/E of 38.4x earnings, or $138 per share [Exhibit 7]. This signifies 28% upside potential and thus is fair and reasonably priced. This price objective confirms our reinstated buy thesis.
Exhibit 7. Fair forward P/E 38.4x FY22 EPS Est. = $138.
Note: Fair forward price-earnings multiple calculated as 1/fair cost of equity. This is known as the ‘steady state’ P/E. For more and literature see: [M. Mauboussin, D. Callahan, (2014): What Does a Price-Earnings Multiple Mean?; An Analytical Bridge between P/Es and Solid Economics, Credit Suisse Global Financial Strategies, January 29 2014] (Data: HB Insights Estimates)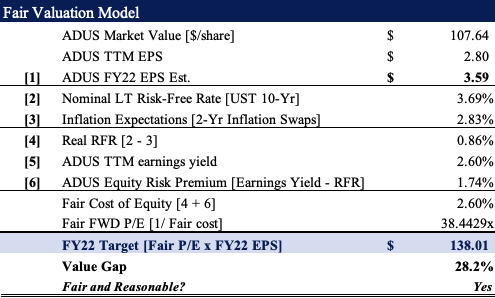
Net-net, we continue to rate ADUS a buy on valuation and future value creation. We suggest a price objective of $138 apiece or 38.4x FY22 earnings estimates.