Baker Hughes: 2022 Results Compared To Schlumberger And Halliburton (NASDAQ:BKR)

anatoliy_gleb
Introduction
Baker Hughes Company (NASDAQ:BKR) released its fourth quarter and full-year 2022 results on January 23, 2023.
Note: This article is an update of my article published on October 24, 2022. I have followed BKR on Seeking Alpha since December 2020.
1 – Fourth quarter and Full-year 2022 results snapshot
The company reported fourth quarter 2022 adjusted earnings of $0.38 per share, missing analyst expectations this quarter against $0.25 last year. Total quarterly revenues of $5,905 million were below expectations, with consolidated orders of $8.01 billion.
The lower-than-expected quarterly results were due to higher costs and expenses, even if higher contributions from the Oilfield Services and Equipment business unit partially compensated for them.
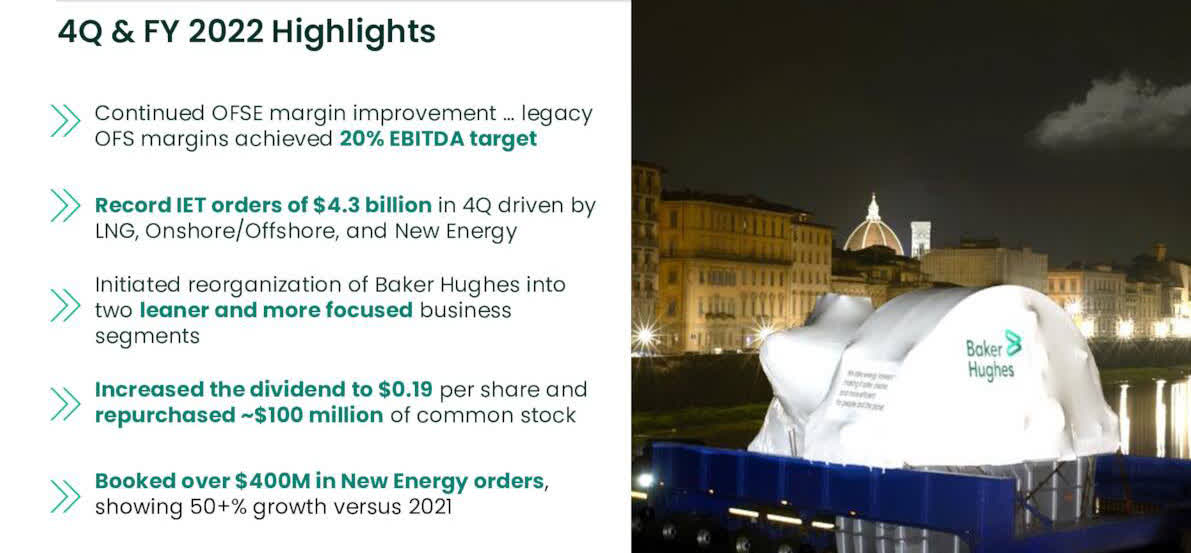
BKR 4Q22 and FY22 highlights (BKR Presentation)
CEO Lorenzo Simonelli said in the conference call:
Operationally, our performance for the year was mixed. During the first half of this year, we experienced multiple headwinds across our organization as well as a number of operational challenges. While our performance improved over the second half, we still have more work to do and are focused on various initiatives to improve shorter-term execution and meet the longer term financial objectives
Note: I regularly cover three companies in oilfield services. After Schlumberger (SLB) and Halliburton (HAL), Baker Hughes is my third choice.
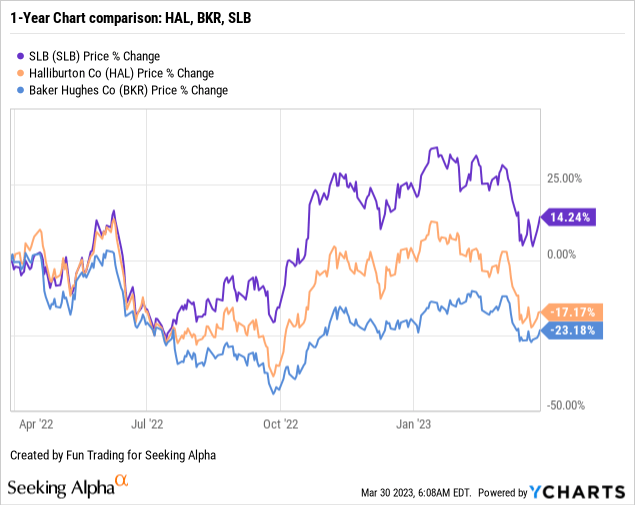
2 – Stock performance
Baker Hughes and its peers have retreated significantly since the start of 2023. BKR is down 23% on a one-year basis underperforming its two main competitors greatly, especially SLB showing a 14% increase YoY.
3 – Baker Hughes Compared to Schlumberger and Halliburton
The oilfield services segment is a complex sector, and while offering some upside on good days, it quickly drops on any sign of economic weakness, putting pressure on oil and gas prices.
It’s a recurring issue that we have often experienced in the past and even recently. Comparing BKR to SLB and HAL balance sheets shows that BKR is not performing as well as its peer but shows a solid financial basis. Net income compared with revenues is telling.
However, BKR’s dividend yield is slightly better than its peers, with a quarterly dividend of $0.19 this quarter.
| Comparison SLB/HAL/BKR in $ million | SLB 4Q22 | HAL 4Q22 |
BKR 4Q22 |
| Total Revenues | 7,879 | 5,582 | 5,905 |
| Net Income | 1,064 | 656 | 182 |
| EBITDA | 1,539 | 1,078 | 664 |
| Operating Cash Flow | 1,614 | 1,163 | 898 |
| CapEx | 669 | 350 | 269 |
| Free Cash Flow | 945 | 813 | 629 |
| Total Cash | 2,894 | 2,346 | 2,488 |
| Total LT Debt | 12,226 | 7,928 | 6,658 |
| Shares outstanding (Diluted) | 1,440 | 911 | 999 |
| Dividend yield | 2.05% | 2.04% | 2.70% |
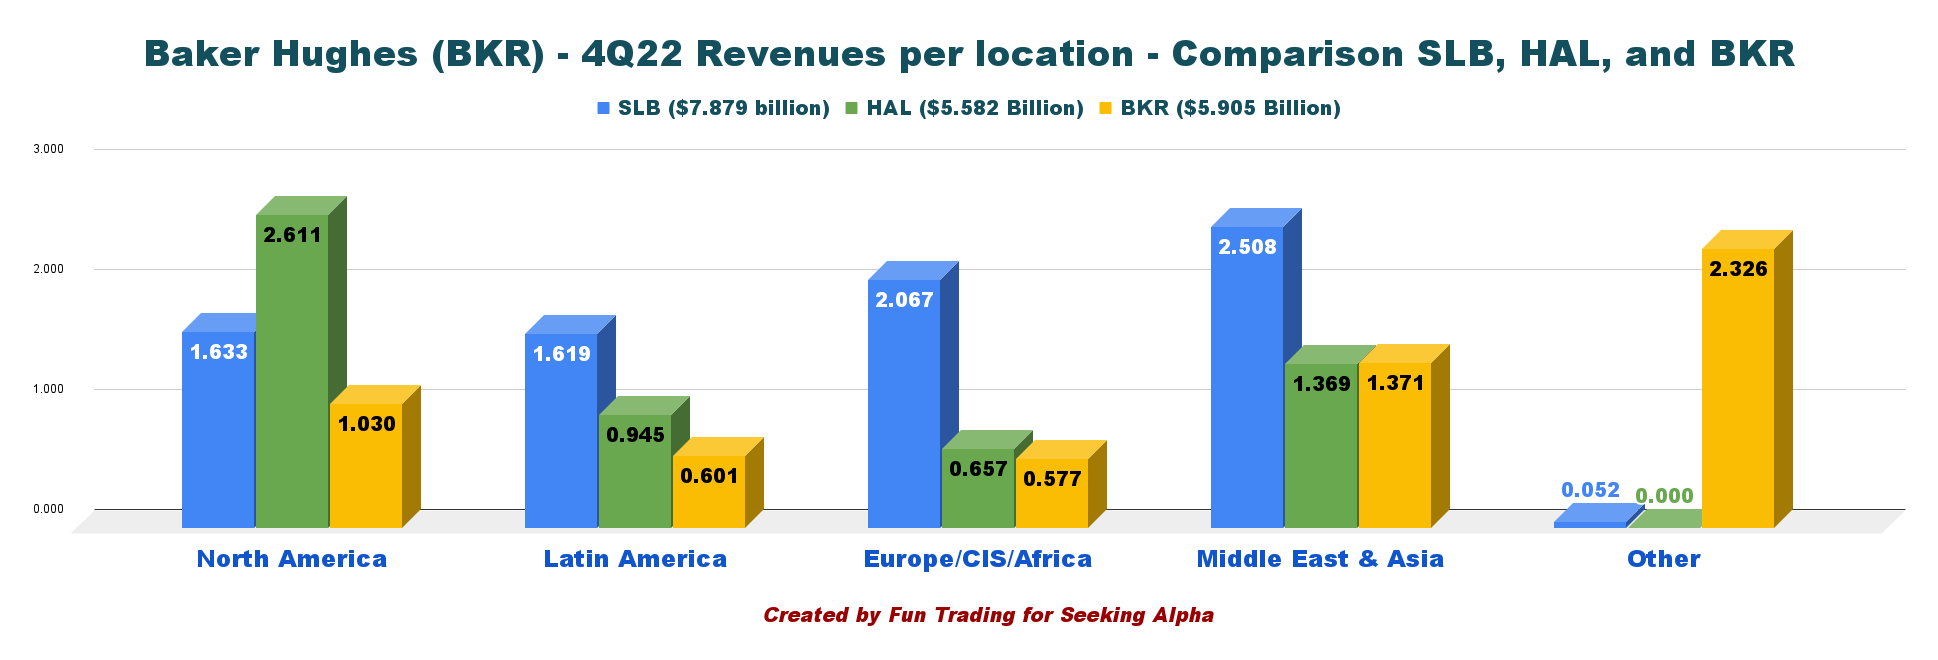
BKR SLB HAL revenue per segment in 4Q22 (Fun Trading)
BKR has a strong presence in the Middle East and Asia. However, the chart above is slightly misleading due to the “other” revenues, representing the Turbomachinery & process solutions and Digital Solutions covering the four regions. BKR shows strength in LNG equipment and new energy. In the conference call, CEO Lorenzo Simonelli said:
In 2022, we booked almost $3.5 billion in LNG equipment orders, our highest ever and booked over $400 million in new energy orders, showing over 50% growth versus 2021. Although not yet back to previous historical levels, orders for our offshore exposed businesses also accelerated. Within OFSE, SSPS booked over $3 billion in orders in 2022, representing 36% growth vs. 2021.
Thus, I recommend BKR as a solid oilfield-services business for a small long-term investment. Unfortunately, BKR has delivered not-so-stellar results, pushing the company to increase profitability by restructuring its business in the preceding quarter with charges totaling $230 million in 3Q22.
The company combined the Oilfield-Services segment with the Oilfield Equipment segment to form the OFSE component. It combined the Turbomachinery & Process Solutions segment with the Digital Solutions segment to create the IET segment.
CEO Lorenzo Simonelli said in the press release:
we took a large step forward in reshaping the company as we announced a formal restructuring and re-segmentation of Baker Hughes into two business segments. This kicked off a major transformation effort across the organization, including key executive management changes, which will fundamentally improve the way the company operates
As a regular recommendation, I suggest trading short-term LIFO about 40% of your long-term position to take advantage of the volatility and unforeseen events expected in this industry.
Baker Hughes – The Raw Numbers – Fourth Quarter of 2022
| Baker Hughes | 4Q21 | 1Q22 | 2Q22 | 3Q22 | 4Q22 |
| Total Orders in $ Billion | 6.66 | 6.84 | 5.86 | 6.06 | 8.01 |
| Total Revenues in $ Billion | 5.52 | 4.84 | 5.05 | 5.37 | 5.91 |
| Net Income available to common shareholders in $ Million | 293 | 72 | -839 | -17 | 182 |
| EBITDA $ Million | 1,055 | 528 | -321 | 463 | 664 |
| EPS diluted in $/share | 0.32 | 0.08 | -0.84 | -0.02 | 0.18 |
| Operating cash flow in $ Million | 774 | 72 | 321 | 597 | 898 |
| CapEx in $ Million | 266 | 268 | 226 | 226 | 269 |
| Free Cash Flow in $ Million | 508 | -196 | 95 | 371 | 629 |
| Total Cash $ Billion | 3.85 | 3.19 | 2.93 | 2.85 | 2.49 |
| Debt Consolidated in $ Billion | 6.73 | 6.69 | 6.66 | 6.66 | 6.66 |
| Dividend per share in $ | 0.18 | 0.18 | 0.18 | 0.18 | 0.19 |
| Shares Outstanding (Diluted) in Million | 899 | 948 | 1,001 | 1,008 | 999 |
Source: Company release
Historical data from 2015 is only available to subscribers.
Analysis: Earnings Details
1 – Revenues and other income were $5.905 billion in 4Q22
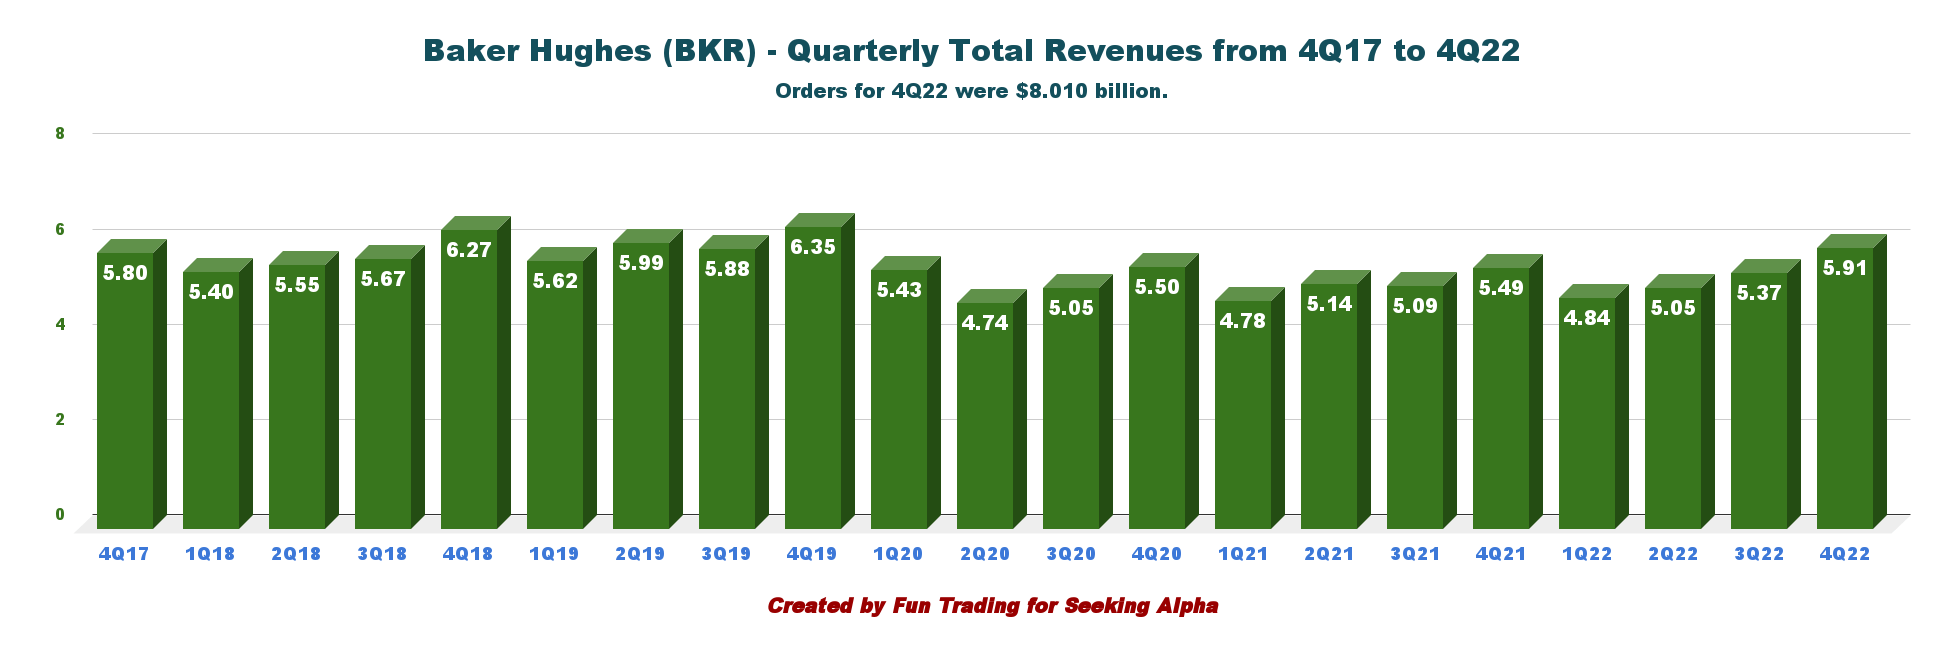
BKR Quarterly Revenues history (Fun Trading)
BKR’s total orders from all business segments in the fourth quarter of 2022 were $8,010 million. Revenues were $5,905 million this quarter, up 7.7% from the same quarter a year ago and up 10% quarter over quarter.
Adjusted operating income was $692 million for the quarter, up 38% sequentially and up 21% year-over-year.
Adjusted EBITDA was $947 million for the quarter, up 25% sequentially and up 12% year-over-year. Income tax expense in the fourth quarter of 2022 was $157 million.
The company posted total costs and expenses of $5,242 million for the fourth quarter, up from the same quarter a year ago, $4,911 million.
Below are shown revenues per segment history:
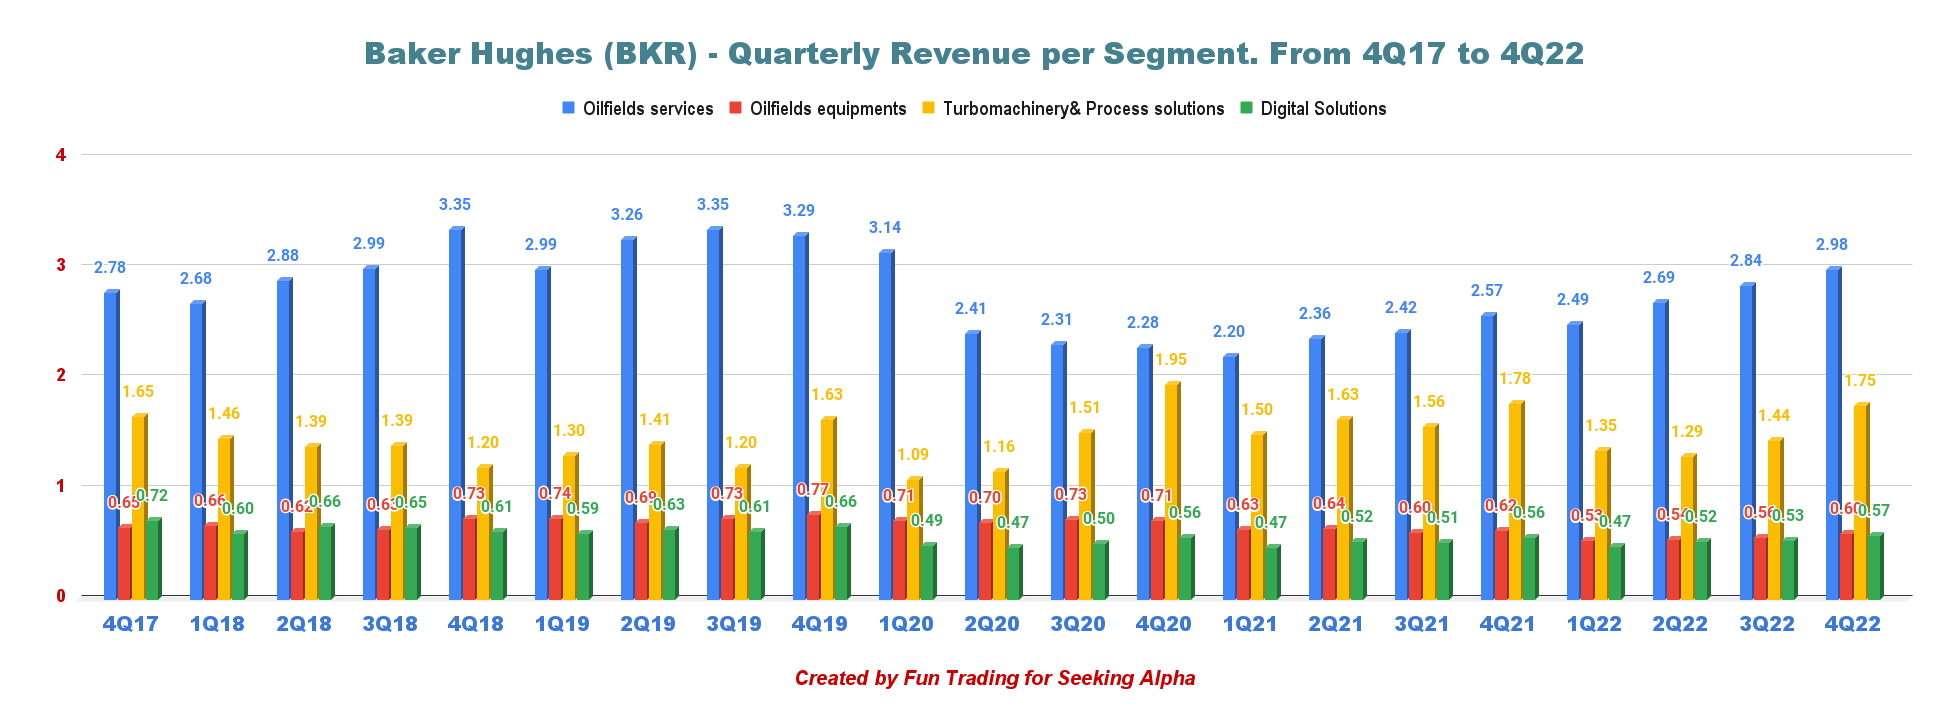
BKR Quarterly revenues per segment history (Fun Trading)
BKR oilfield business segments represented about 50.4% of its revenue during the quarter through December.
1.1 – Oilfield Services
Revenues were $3.579 million, up 12% from last year of $3,185 million. Operating income from the segment was $416 million, up from $280 million in the fourth quarter of 2021, due to higher volumes and prices in most product lines.
1.2 – Industrial and Energy Technology
Revenues totaled $2,325 million, up 1% from the last year or $2,300 million. The segment reported an income of $377 million compared with $397 million in 4Q21. Revenues were up this quarter due to higher contributions from the Gas Technology-Equipment segment, partially canceled by lower contributions from the Gas Technology-Services segment.
1.5 – 2023 Positive outlook
The company believes the energy sector is in a multi-year growth cycle despite elevated inflation and tightening monetary conditions.
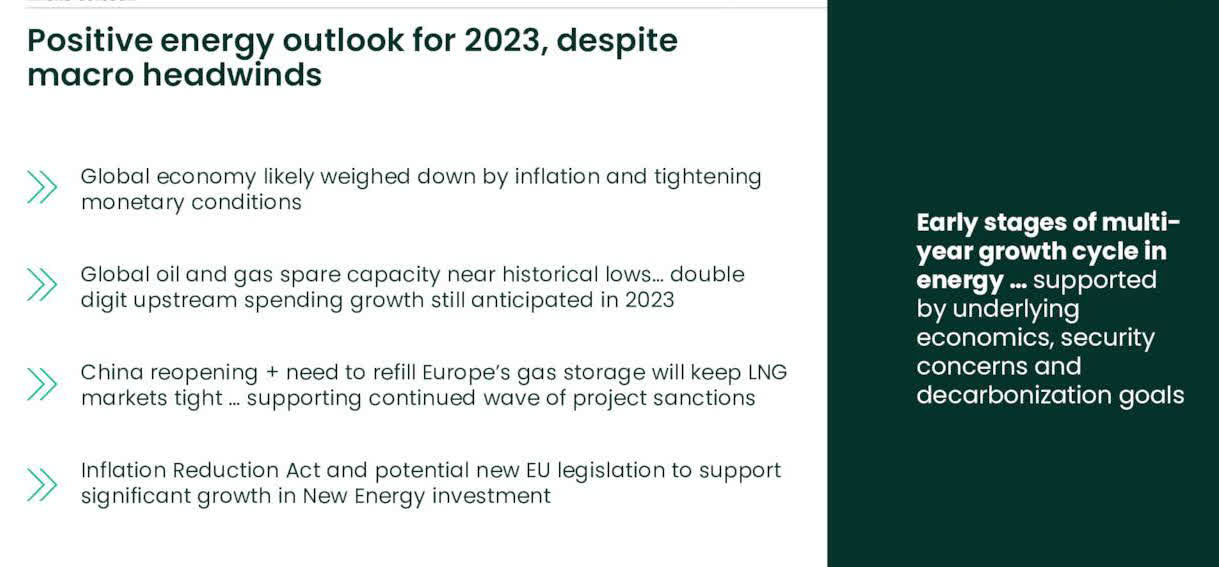
BKR 2023 Outlook Presentation (BKR Presentation)
Lorenzo Simonelli, Baker Hughes’ Chairman and CEO said in the conference call:
As we enter 2023, IET has a record backlog of $25 billion and a robust pipeline of new order opportunities in LNG, onshore/offshore and new energy, and we now expect IET orders in 2023 between $10.5 billion to $11.5 billion. Despite the supply chain challenges, we are closely monitoring for both Gastech and industrial tech. We are well positioned to execute on this backlog to help drive significant revenue growth in 2023 and 2024.
2 – Free cash flow was $629 million in 4Q22
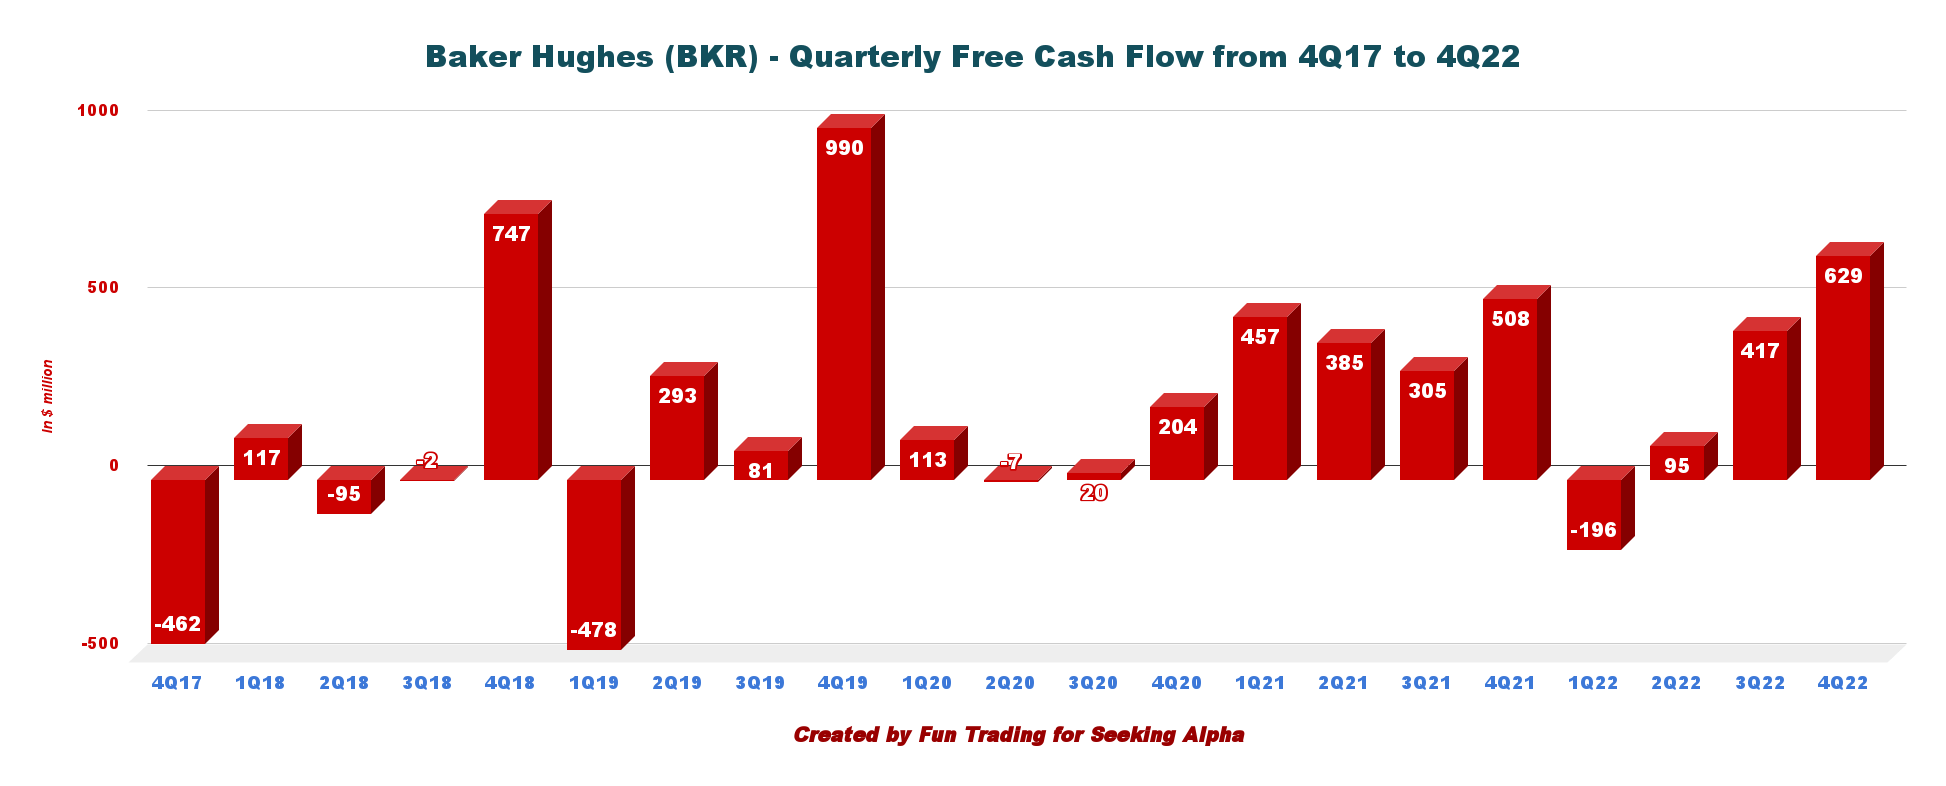
BKR Quarterly Free cash flow history (Fun Trading)
Note: Generic free cash flow is cash flow from operations minus capex. The company calculated Free cash flow differently and indicated $657 million for 4Q22.
Trailing 12-month free cash flow came in at $899 million, and the company had a free cash flow of $629 million in 4Q22.
This quarter, the quarterly dividend is $0.19 per share or an annual cash payment of $760 million. The dividend yield is now 2.70%.
3 – The net debt was $4.17 billion in 4Q22
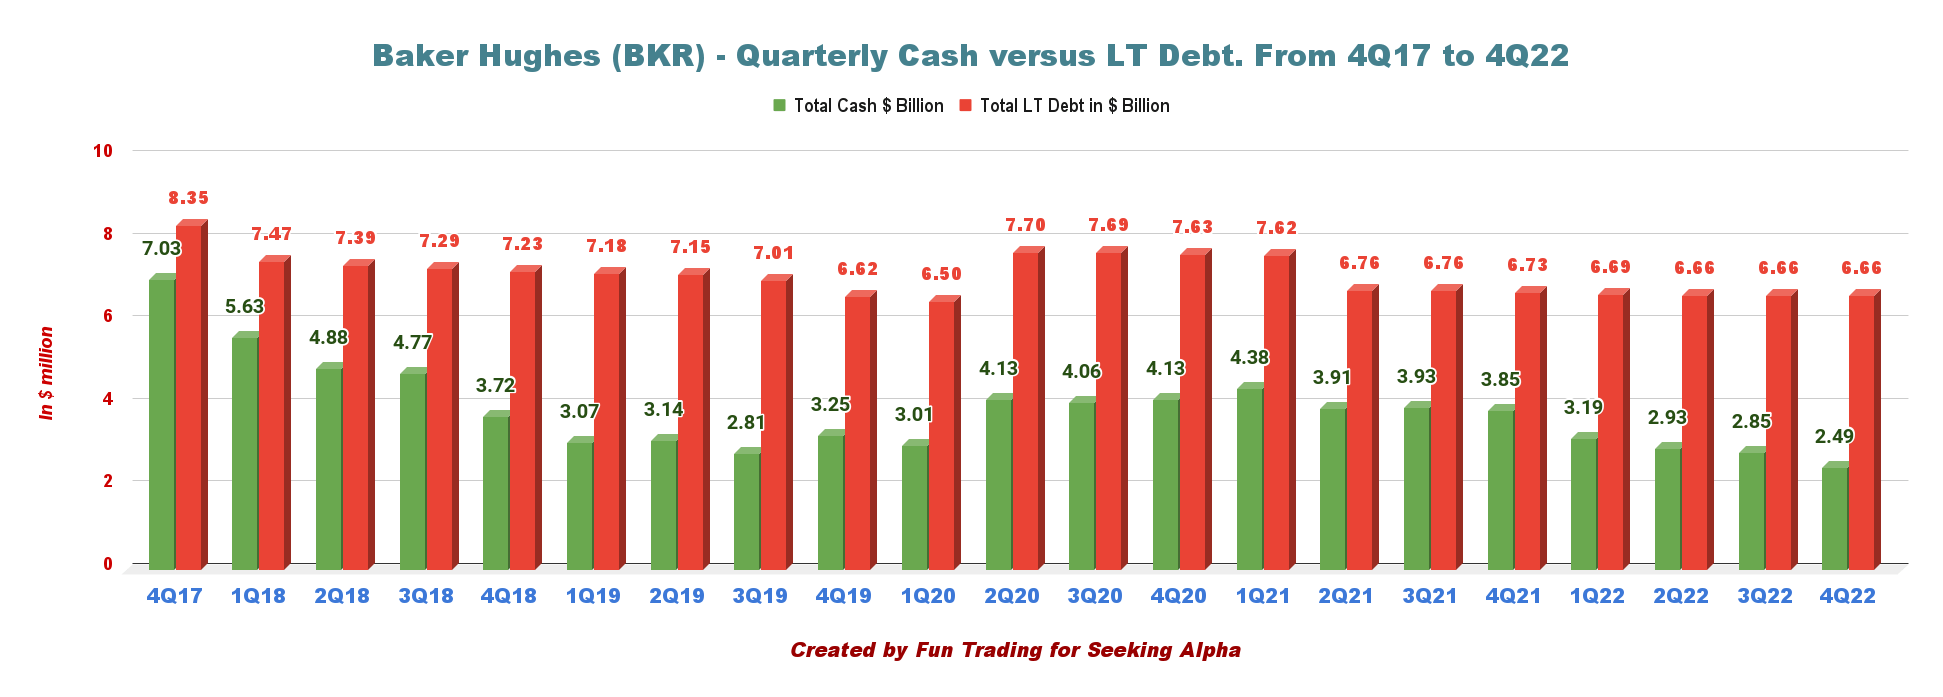
BKR Quarterly Cash versus Debt history (Fun Trading)
As of December 31, 2022, the company had cash and cash equivalents of $2,488 million, down significantly from $3,853 million in the fourth quarter of 2021.
At the end of the fourth quarter, Baker Hughes had long-term debt of $6,658 million (including $678 million in current debt), with a debt-to-capitalization of 31.4% from 31.7% the preceding quarter (see chart above).
Technical Analysis (Short Term) and Commentary
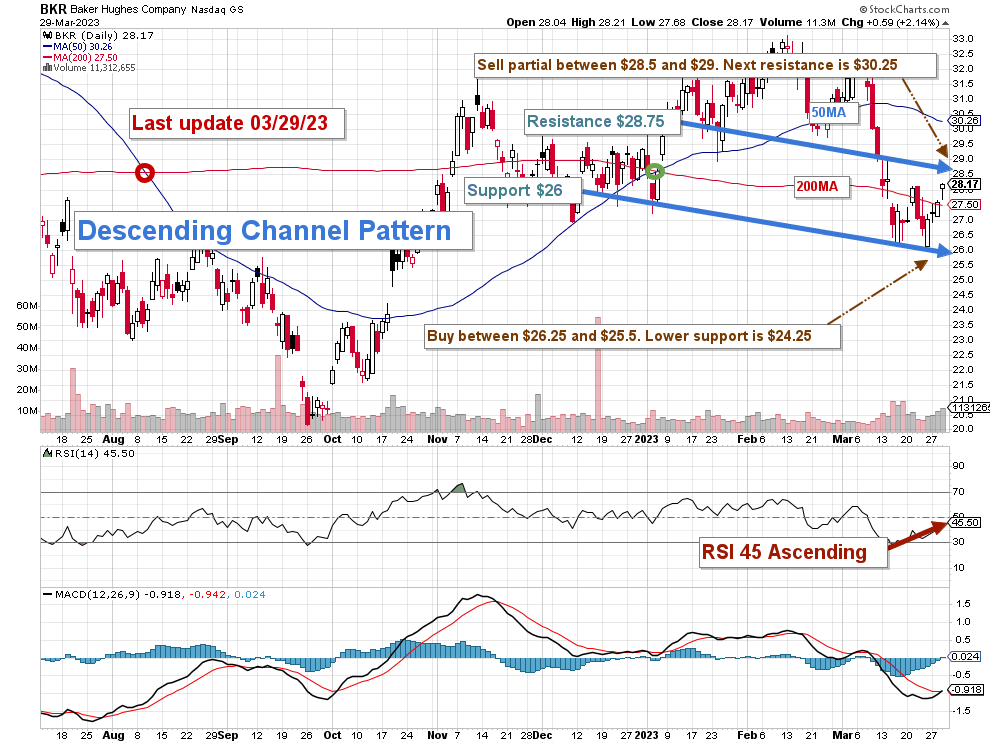
BKR TA Chart short-term (Fun Trading StockCharts)
Note: The chart includes the effect of the dividend.
BKR forms a descending channel pattern with resistance at $28.75 and support at $26.
The general strategy I usually promote is to keep a core long-term position and use about 30%-40% to trade LIFO while waiting patiently for a higher final price target to sell your core position above $34-$36.
Thus, I recommend selling partially between $28.5 and $29 with possible higher resistance at $30.25. Conversely, it’s reasonable to buy back BKR on any weakness between $26.25 and $25.5 with possible lower support at $24.25.
Warning: The TA chart must be updated frequently to be relevant. It’s what I’m doing in my stock tracker. The chart above has a possible validity of about a week. Remember, the TA chart is a tool only to help you adopt the right strategy. It is not a way to foresee the future. No one and nothing can.