9 High-Yield Dividend Aristocrats That Could Change Your Life
AscentXmedia
The dividend aristocrats are beloved by many income investors and for good reason.
Dividend aristocrats tend to be (but are not always) superior quality companies.
- aristocrats average 67th percentile risk management vs 62% for blue-chips
- aristocrats average A- stable credit ratings
- aristocrats tend to be stronger and more stable companies
- aristocrats have proven dividend-friendly corporate cultures and good management you can trust
Aristocrats are famous for offering lower volatility and superior long-term returns.
| Year | Aristocrats Returns | Aristocrats Cumulative Returns | S&P 500 Total Returns |
S&P Cumulative Returns |
| 1990 | 5.70% | 105.70% | -3.2% | 96.8% |
| 1991 | 38.50% | 146.4% | 30.4% | 126.2% |
| 1992 | 10.10% | 161.2% | 7.6% | 135.8% |
| 1993 | 4.30% | 168.1% | 10.1% | 149.5% |
| 1994 | 0.90% | 169.6% | 1.3% | 151.5% |
| 1995 | 34.60% | 228.3% | 37.6% | 208.4% |
| 1996 | 20.90% | 276.0% | 22.9% | 256.2% |
| 1997 | 34.50% | 371.3% | 33.3% | 341.5% |
| 1998 | 16.80% | 433.6% | 28.6% | 439.1% |
| 1999 | -5.40% | 410.2% | 21.0% | 531.4% |
| 2000 | 10.10% | 451.7% | -9.1% | 483.0% |
| 2001 | 10.80% | 500.4% | -11.9% | 425.5% |
| 2002 | -9.90% | 450.9% | -22.1% | 331.5% |
| 2003 | 25.40% | 565.4% | 28.7% | 426.6% |
| 2004 | 15.50% | 653.1% | 10.9% | 473.1% |
| 2005 | 3.70% | 677.2% | 4.9% | 496.3% |
| 2006 | 17.30% | 794.4% | 15.8% | 574.7% |
| 2007 | -2.10% | 777.7% | 5.6% | 606.9% |
| 2008 | -21.90% | 607.4% | -37.0% | 382.4% |
| 2009 | 26.60% | 768.9% | 26.4% | 483.3% |
| 2010 | 19.40% | 918.1% | 15.1% | 556.3% |
| 2011 | 8.30% | 994.3% | 2.1% | 568.0% |
| 2012 | 16.90% | 1162.4% | 16.0% | 658.8% |
| 2013 | 32.30% | 1537.8% | 32.4% | 872.3% |
| 2014 | 15.80% | 1780.8% | 13.7% | 991.8% |
| 2015 | 0.90% | 1796.8% | 1.4% | 1005.7% |
| 2016 | 11.80% | 2008.8% | 12.0% | 1126.4% |
| 2017 | 21.70% | 2444.7% | 21.8% | 1371.9% |
| 2018 | -2.70% | 2378.7% | -4.4% | 1311.5% |
| 2019 | 28% | 3044.8% | 31.5% | 1724.7% |
| 2020 | 8.70% | 3309.7% | 18.4% | 2042.0% |
| 2021 | 25.47% | 4152.6% | 28.7% | 2628.3% |
| 2022 | -11.49% | 3675.5% | -18.7% | 2137.3% |
| Aristocrats’ Median Return Since 1990 | Average Return Since 1990 | Annualized Returns Since 1990 | S&P 500 Annual Returns Since 1990 |
Annual Outperformance |
| 13.65% | 13.2% | 12.42% | 10.90% | 1.52% |
(Sources: Ploutos, Ycharts)
The official dividend aristocrats are S&P 500 companies with 25+ consecutive years of rising dividends.
- every year since at least 1997
- including through three major recessions
- three market crashes
- five bear markets
- dozens of corrections and pullbacks
They are truly the bluest of blue-chips BUT the official aristocrat list is just 66 companies.
There are actually 135 companies with 25+ year dividend growth streaks including some truly exceptional foreign companies that are well worth considering for your portfolio.
Today I wanted to highlight some of the best global aristocrats, which are not on most income investor’s radars, but definitely deserve to be.
But before I show you the nine best global aristocrats worth buying today, let me show you the wrong way to invest in international aristocrats.
First Trust S&P International Dividend Aristocrats ETF (FID): One Of The Worst Dividend ETFs I’ve Ever Seen
The S&P global aristocrat index is the basis for this annually rebalanced ETF which has risk management rules such as 3% risk caps for individual companies and 25% sector caps.
S&P uses 10 years as its cutoff for global aristocrats.
- the DK dividend champions list uses the traditional 25+ year cutoff for and includes lots of international companies
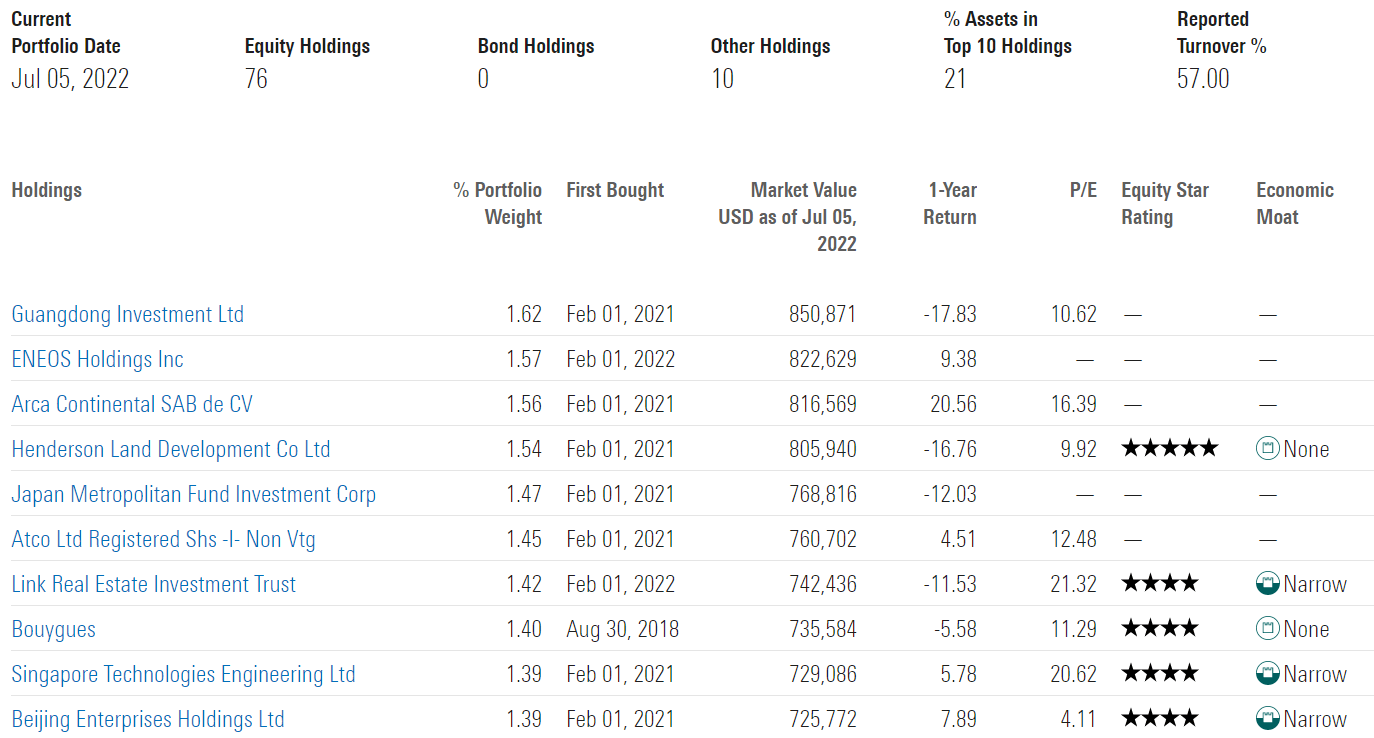
Portfolio Fundamentals
(Source: Morningstar)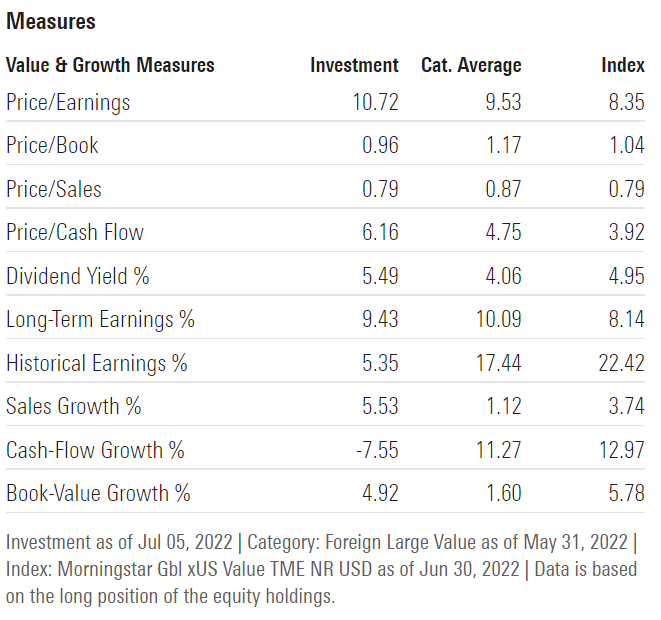
This is a global dividend ETF and that means a dirt-cheap valuation of sub 11X earnings and a P/cash flow of 6.2
It yields 5.5% and Morningstar analysts expect strong growth in the future though even the historical 5.4% growth rate would deliver about 11% long-term returns.
(Source: Morningstar)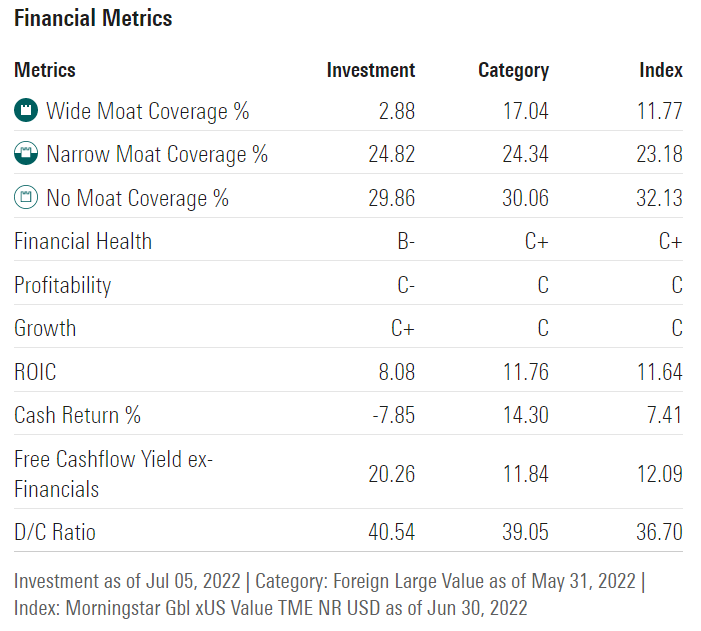
(Source: Morningstar)
Not much moatiness here though the 20% free cash flow yields are very good and the 41% payout ratio is very safe.
(Source: Morningstar)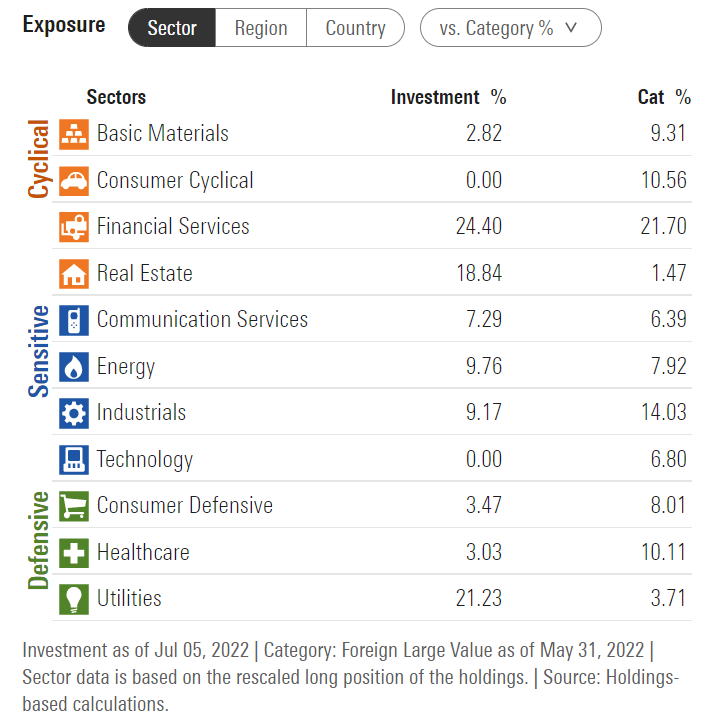
(Source: Morningstar)
Just like REGL and SMDV when you are looking for aristocrats you’ll find a lot of utilities, and financials.
Here we also have a good amount of REIT exposure and the only sectors lacking entirely are consumer discretionary and tech.
(Source: Morningstar)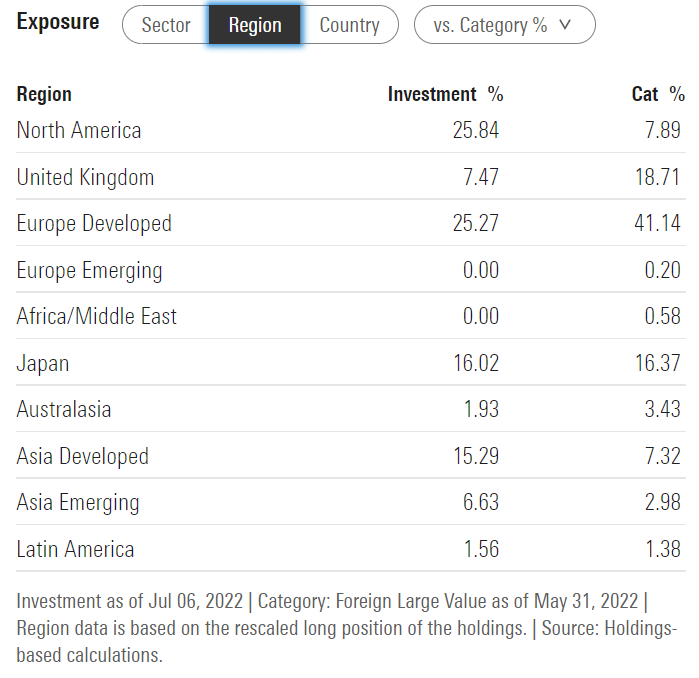
(Source: Morningstar)
This ETF is about 60% North America and Europe with 30% mature Asia exposure and about 10% emerging market exposure.
(Source: Morningstar)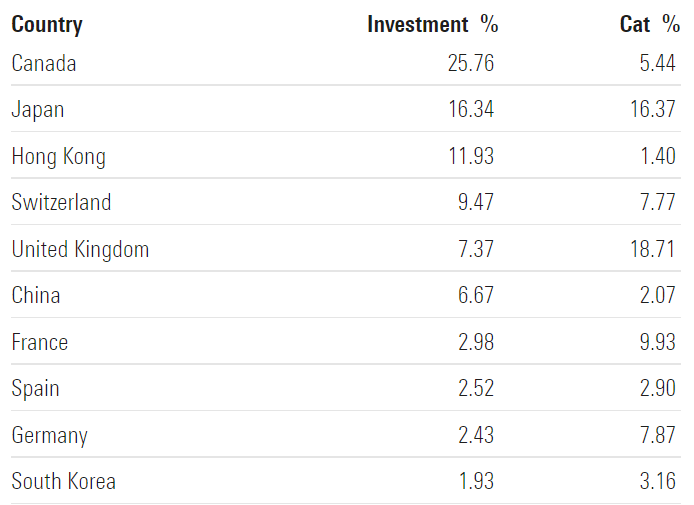
(Source: Morningstar)
This ETF is overweight Canada and Japan, with 19% exposure in China.
(Source: Morningstar) (Source: Morningstar) (Source: Morningstar)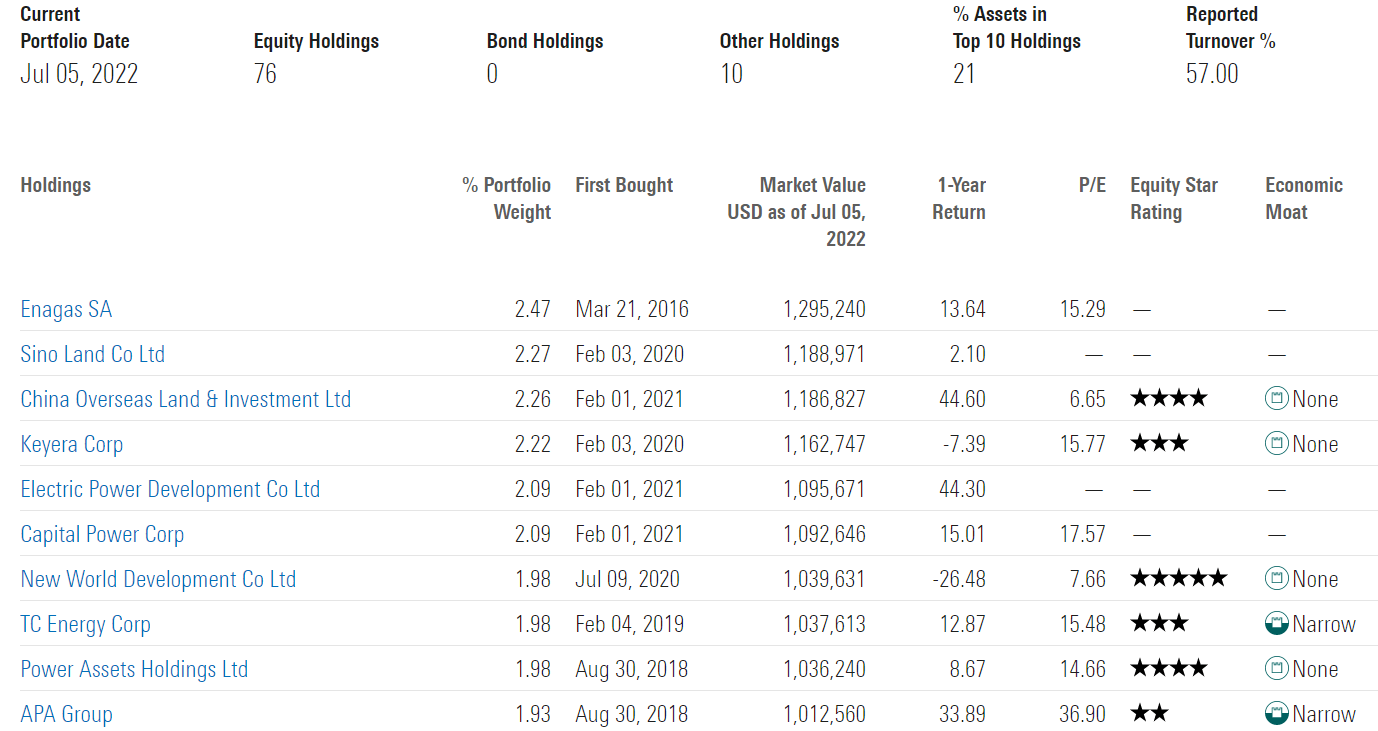
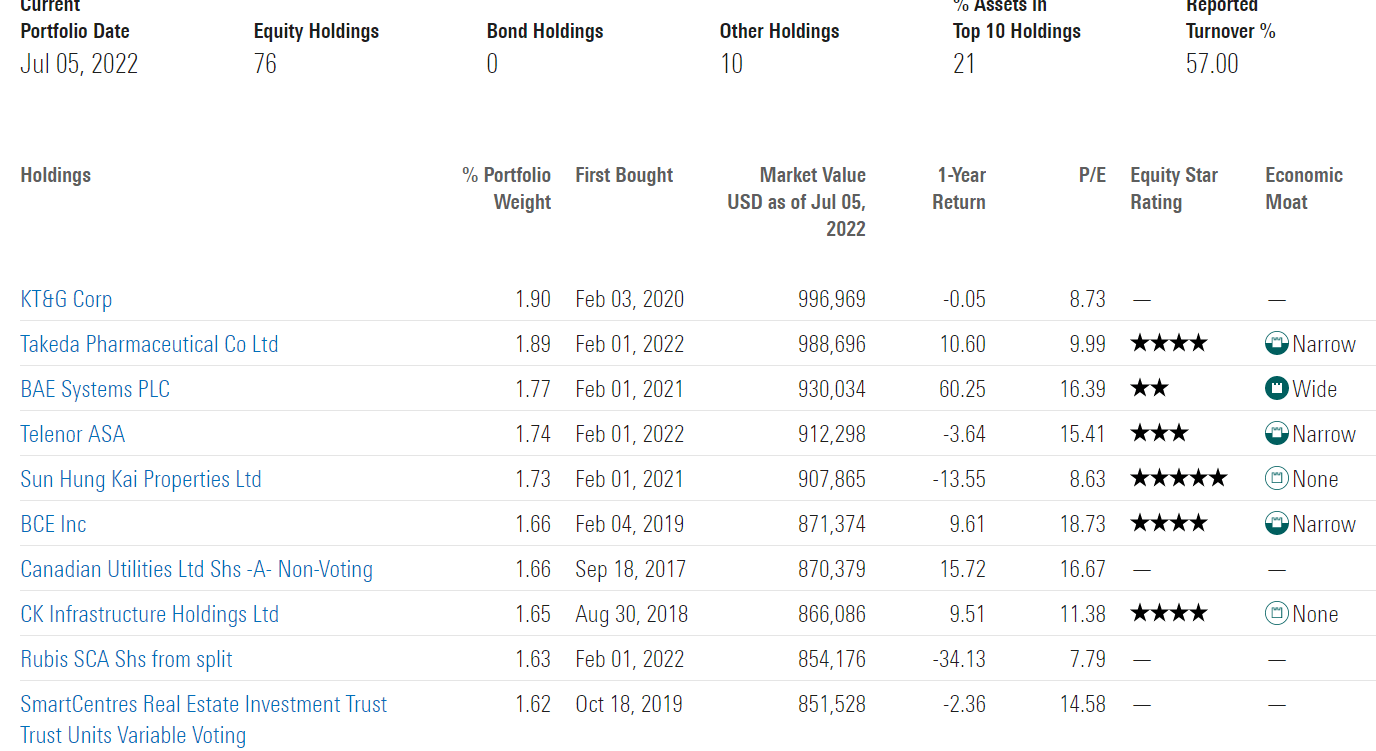
Again higher turnover, and not equally weighted this time but capped at 3% or less and likely market cap-weighted.
So with a yield of 5.5% from a global aristocrat portfolio and potentially close to 10% long-term growth according to Morningstar, what’s not to love?
Actually quite a lot.
Historical Returns And Income Growth Are Shockingly Terrible
The future doesn’t repeat, but it often rhymes.” – Mark Twain
Past performance is no guarantee of future results, but studies show that blue-chips with relatively stable fundamentals over time offer predictable returns based on yield, growth, and valuation mean reversion.
Bank of America
So why am I recommending investors avoid FID like the plague?
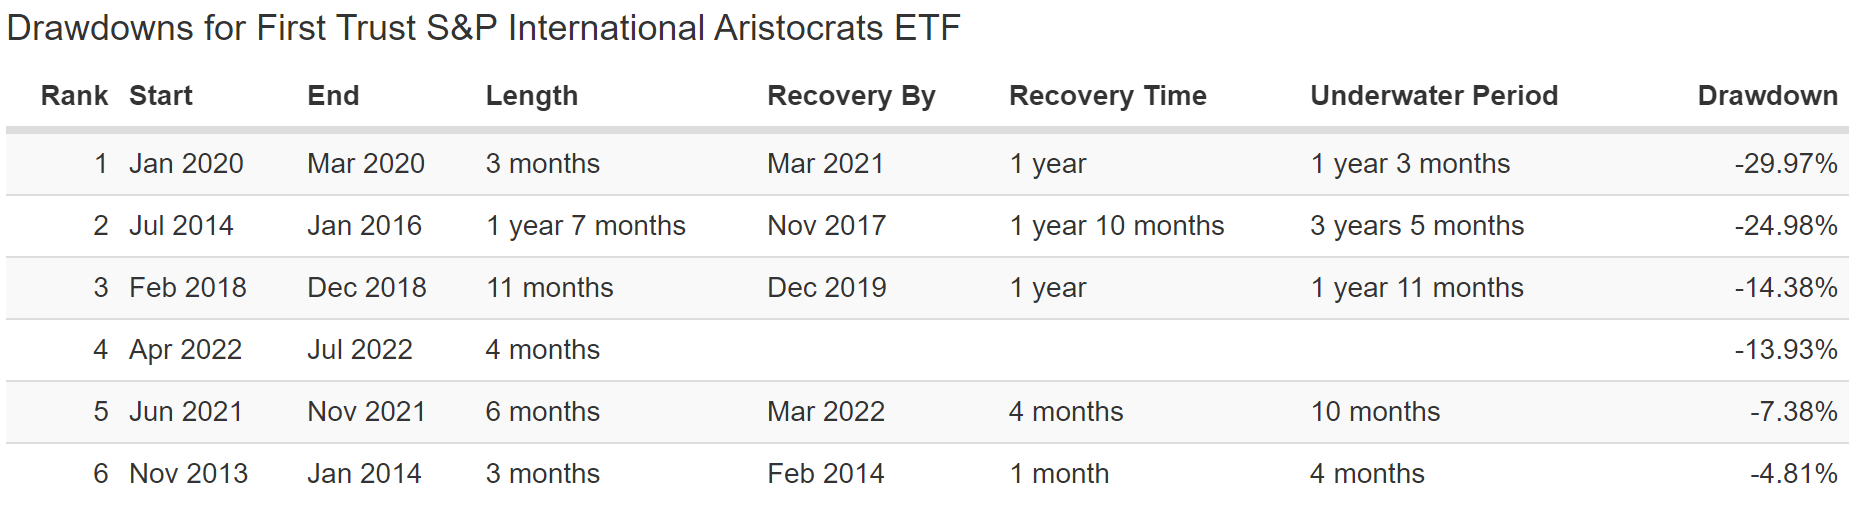
First Trust S&P International Dividend Aristocrats ETF Since November 2013
(Source: Portfolio Visualizer Premium) (Source: Portfolio Visualizer Premium) (Source: Portfolio Visualizer Premium)
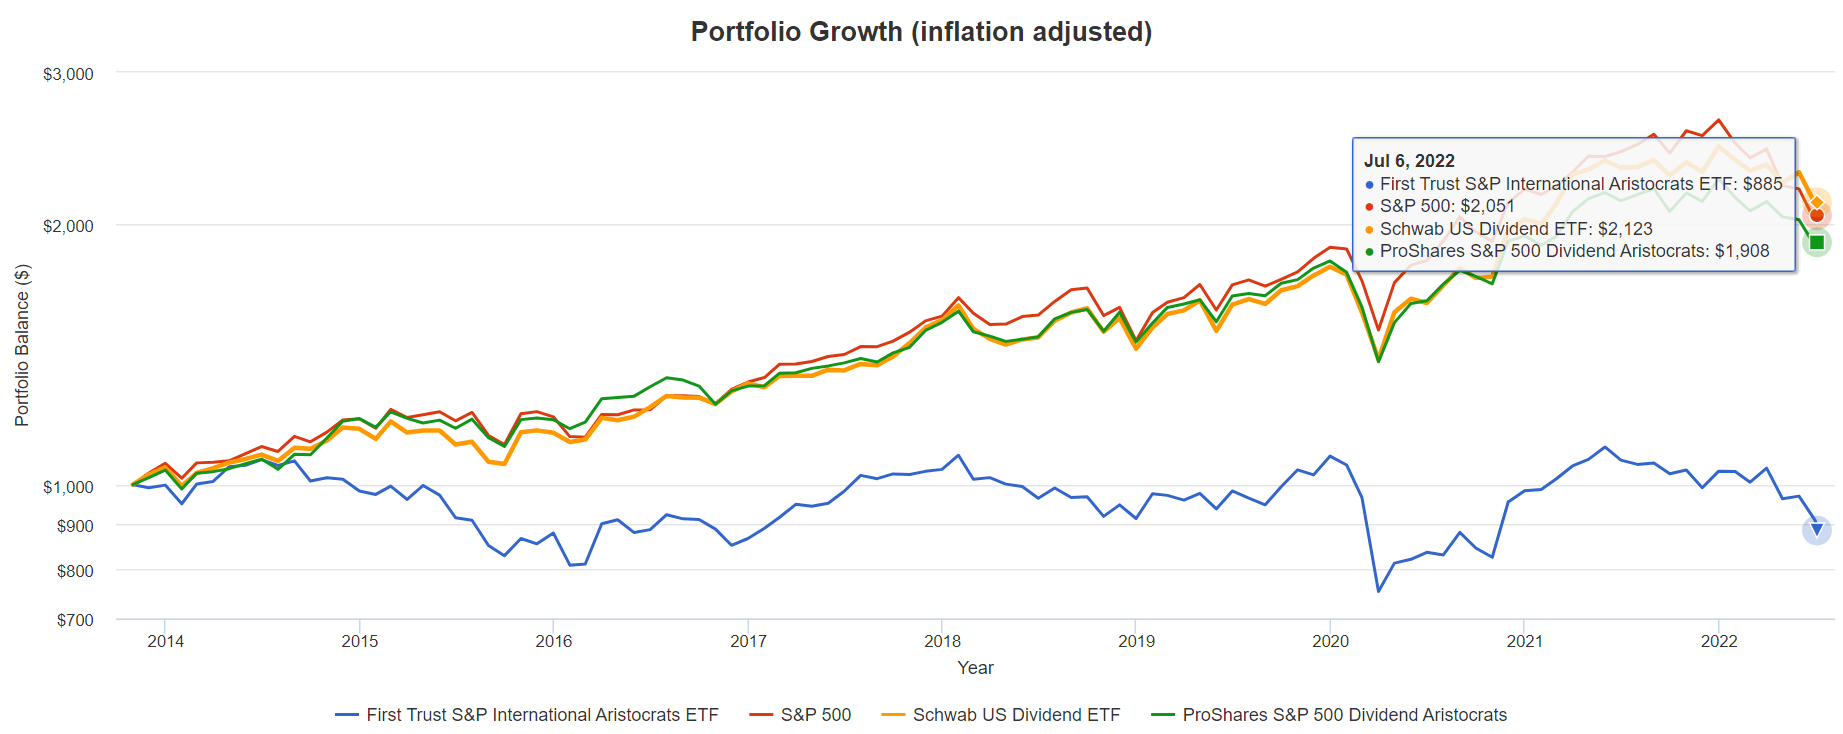
FID has been a terrible investment since inception, delivering -1.1% annual inflation-adjusted returns. Its average annual return of 3.2% is below its starting yield of 4.9%.
- indicating the portfolio has suffered negative price appreciation for nine years
Before this bear market began returns were terrible.
Before the pandemic returns were terrible.
And even when the economy was growing steadily before mid-2014 (1st energy crash of the decade) it was underperforming.
(Source: Portfolio Visualizer Premium) (Source: Portfolio Visualizer Premium) (Source: Portfolio Visualizer Premium) (Source: Portfolio Visualizer Premium) (Source: Portfolio Visualizer Premium) (Source: Portfolio Visualizer Premium)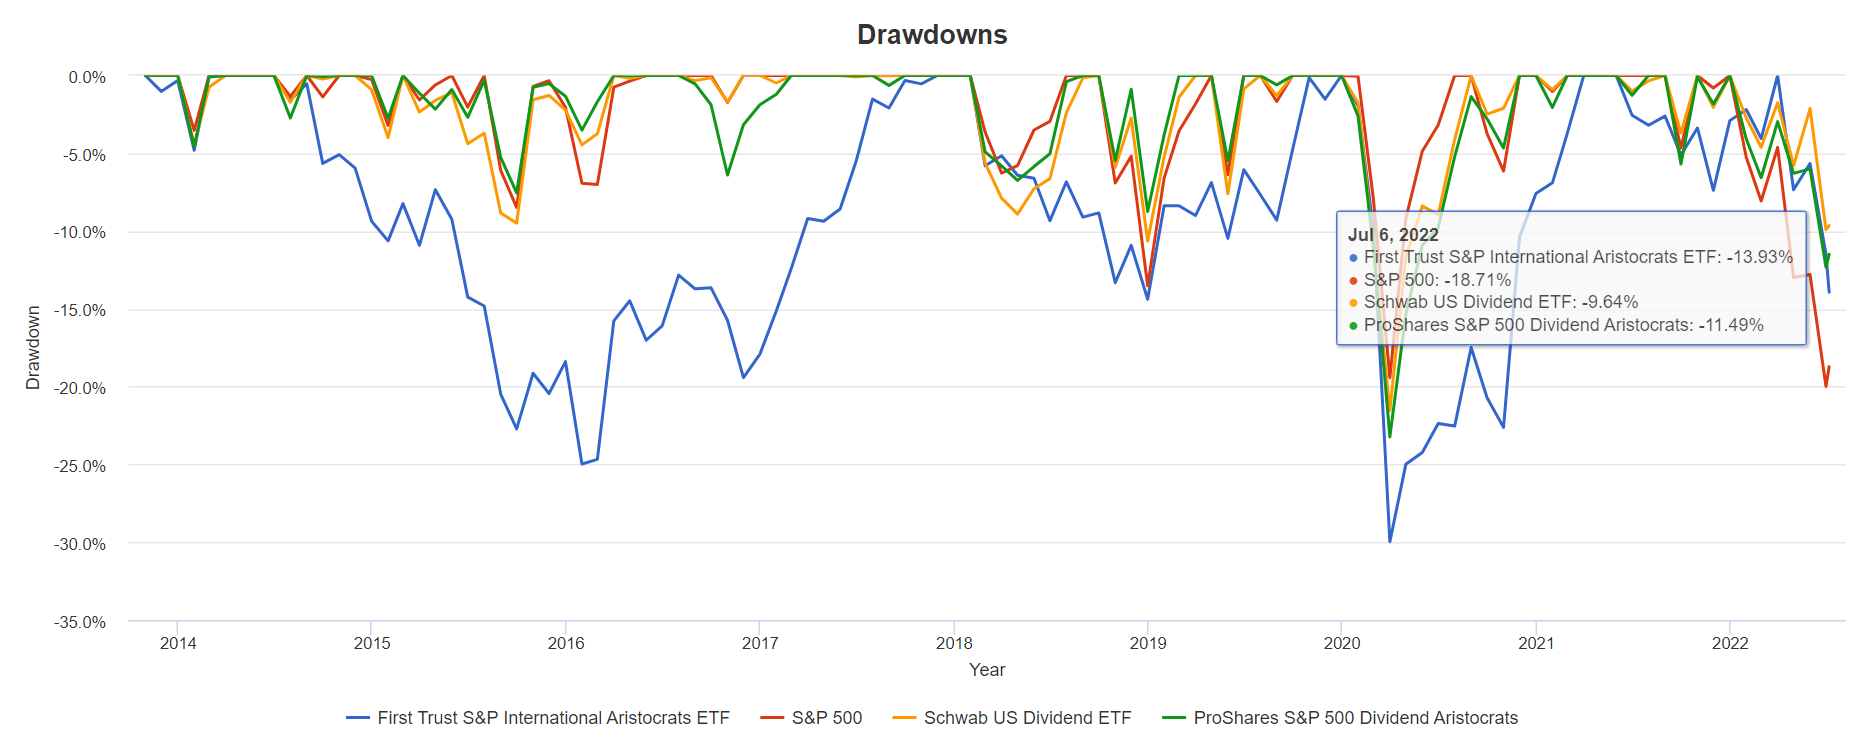

(Source: Portfolio Visualizer Premium)
Aristocrats are famous for:
- the most dependable income growth
- lower volatility over time (and during most recessions)
- market-beating returns over time
FID offers none of those things and I can’t recommend it. And here’s another reason why.
| Portfolio | 2014 Income Per $1,000 Investment | 2021 Income Per $1,000 Investment | Annual Income Growth | Starting Yield |
2021 Yield On Cost |
| S&P 500 | $22 | $38 | 8.12% | 2.2% | 3.8% |
| NOBL | $19 | $33 | 8.21% | 1.9% | 3.3% |
| SCHD | $30 | $80 | 15.04% | 3.0% | 8.0% |
| FID | $49 | $45 | -1.21% | 4.9% | 4.5% |
(Source: Portfolio Visualizer Premium)
Not even adjusting for inflation FID delivered -1.2% annual income growth.
- from a portfolio that’s 100% global aristocrats
You can see how the S&P aristocrats matched the market’s income growth over the last 7 years, while SCHD once more dominated when it comes to high-yield sustainable, and dependable income growth.
| Analyst Consensus Income Growth Forecast | Risk-Adjusted Expected Income Growth | Risk And Tax-Adjusted Expected Income Growth |
Risk, Inflation, And Tax Adjusted Income Growth Consensus |
| -5.7% | -4.0% | -3.4% | -5.9% |
(Source: DK Research Terminal, FactSet, Morningstar)
Morningstar expects FID to deliver highly negative real risk and tax-adjusted income over time, just as it has for the last seven years.
- YTD dividends on FID are down another 3%
- eight years of negative income growth from an international aristocrat portfolio
Now compare that to what they expect from the S&P 500.
| Time Frame | S&P Inflation-Adjusted Dividend Growth | S&P Inflation-Adjusted Earnings Growth |
| 1871-2021 | 1.6% | 2.1% |
| 1945-2021 | 2.4% | 3.5% |
| 1981-2021 (Modern Falling Rate Era) | 2.8% | 3.8% |
| 2008-2021 (Modern Low Rate Era) | 3.5% | 6.2% |
| FactSet Future Consensus | 2.0% | 5.2% |
(Sources: S&P, FactSet, Multipl.com)
What about a 60/40 retirement portfolio?
- 0.5% consensus inflation, risk, and tax-adjusted income growth.
It takes a truly terrible dividend portfolio to underperform 0.5% real expected income growth over time, and that’s what FID appears to be.
The Reason FID Is So Fundamentally Flawed
FID has several major issues.
- the S&P global aristocrat index’s 10-year dividend growth streak is not quite long enough
- the official index excludes some of the best global aristocrats for some reason (possibly by not using local currency)
Pandemic Dividend Cuts By Streak
Justin Law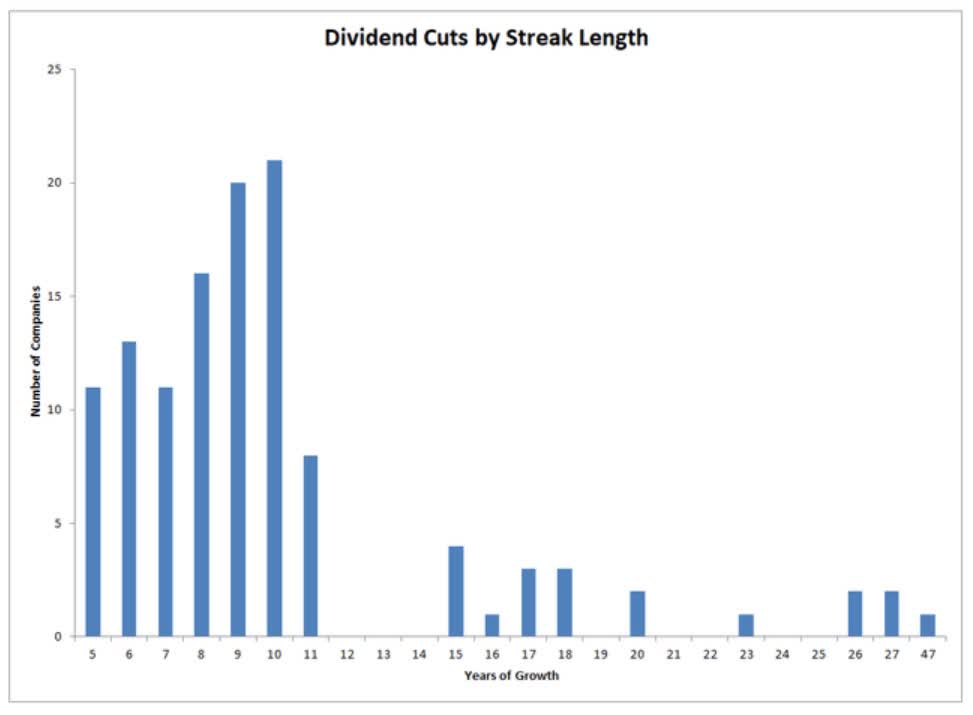
In the Pandemic, 12+ year dividend growth streaks were the key distinction between dividend cutters and those that kept growing their dividends.
How To Find The World’s Best Global Aristocrats In Minutes
The DK 500 Master List is one of the highest quality watchlists on earth.
-
every dividend aristocrat (S&P companies with 25+ year dividend growth streaks)
-
every dividend champion (every company, including foreign, with 25+ year dividend growth streaks)
-
every dividend king (every company with 50+ year dividend growth streaks)
-
every foreign aristocrat (every company with 20+ year dividend growth streaks)
-
40 of the world’s best growth stocks
We have 65 foreign companies, so here’s how I would build this international aristocrat portfolio.
Using the DK Zen Research Terminal:
- foreign dividend companies list
- add the dividend growth streak (local currency) column
- 20+ year dividend growth streak (Ben Graham standard of excellence and 2X longer than the S&P global aristocrat standard)
This screen gives you 14 global aristocrats.
Next, we apply the reasonable or good buy screen, to find the nine global aristocrats that are attractively or reasonable priced today.
Then just use the watchlist creation tool to see what an equally weighted portfolio of these nine companies looks like.
- up to 60 columns of data you can sort by and see the averages for
And that’s how in mere minutes we find the 9 best global aristocrats you can buy today.
The 9 Best Global Dividend Aristocrats You Can Buy Today
Dividend Kings Zen Research Terminal 
I’ve linked to articles providing a deeper look into each of these global aristocrats’ investment thesis, growth prospects, risk profile, valuation, and total return potentials.
Note that other than BTI, all of these companies have dividend tax withholdings.
- ENB’s 15% withholding only applies to taxable accounts, not retirement accounts
- the rest apply to all accounts
- the US tax credit can only be claimed in taxable accounts
In other words, ENB is best owned in a retirement account while the rest are optimally owned in taxable accounts.
- the way you recoup the withholding and enjoy the full yield
Why are these my favorite international aristocrats right now?
Why I Trust These Aristocrats And So Can You
Dividend Kings Zen Research Terminal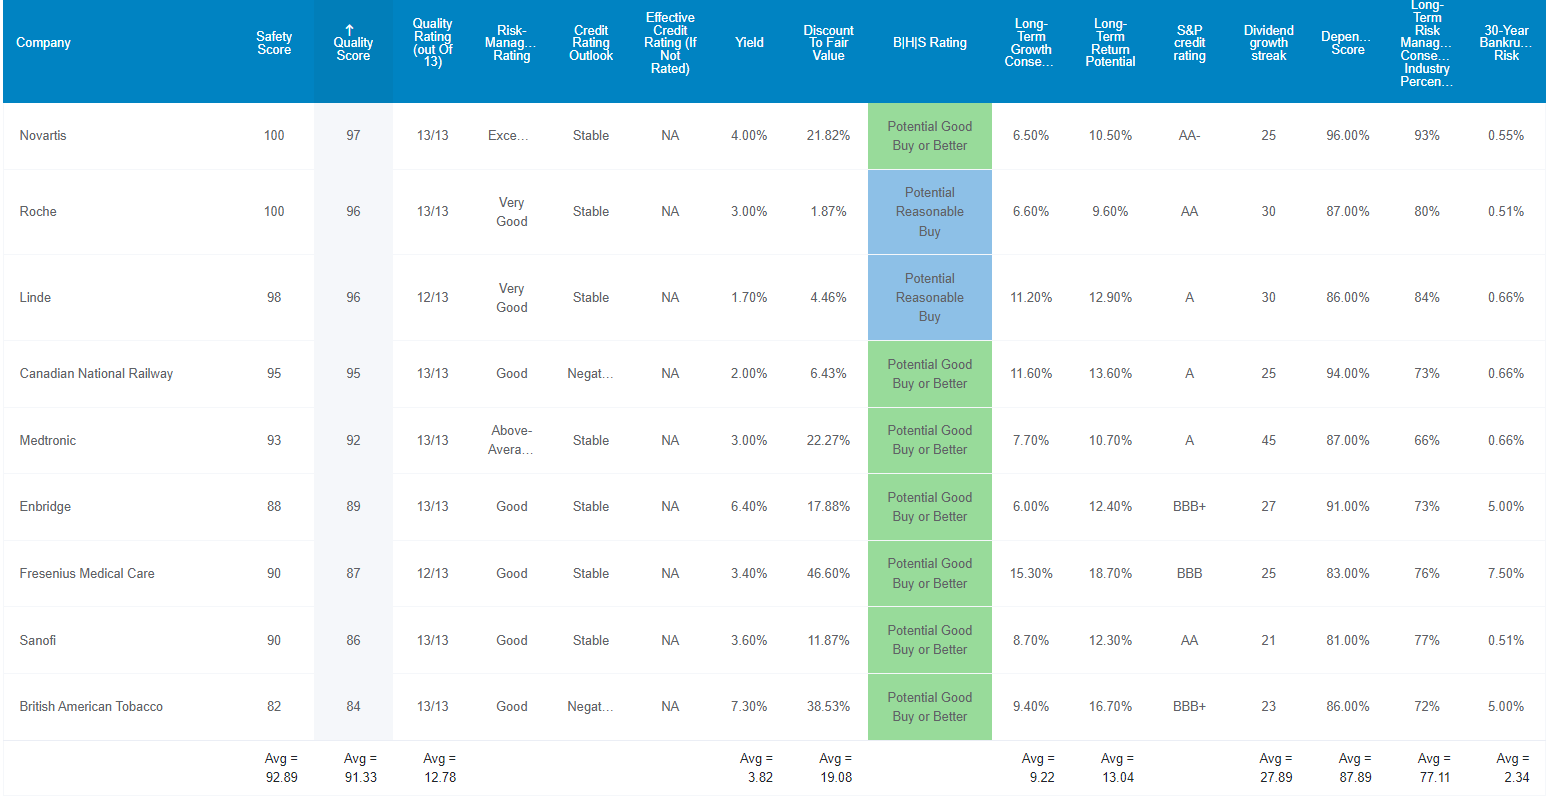
These aren’t just aristocrats they are Ultra SWAN quality aristocrats, as close to perfect dividend growth blue-chips as can exist anywhere in the world.
How do we know this? By comparing them against the dividend aristocrats themselves, the bluest of dividend blue-chips.
Highest Quality Than The Dividend Aristocrats
| Metric | Dividend Aristocrats | 9 Best Global Aristocrats | Winner Aristocrats |
Winner 4 High-Yield/Low Volatility Aristocrats |
| Quality | 87% | 91% | 1 | |
| Safety | 89% | 93% | 1 | |
| Dependability | 84% | 88% | 1 | |
| Long-Term Risk Management Industry Percentile | 67% Above-Average | 77% Good | 1 | |
| Average Credit Rating | A- Stable | A- Stable | 1 | 1 |
| Average 30-Year Bankruptcy Risk | 3.01% | 2.34% | 1 | |
| Average Dividend Growth Streak (Years) | 44.3 | 27.8 | 1 | 0 |
| Average Return On Capital | 100% | 120% | 1 | |
| Average ROC Industry Percentile | 83% | 78% | 1 | |
| 13-Year Median ROC | 89% | 64% | 1 | |
| Total | 4 | 7 |
(Source: DK Zen Research Terminal)
These global aristocrats don’t just offer a very safe 3.8% yield, but a nearly 4% yield that’s among the safest on earth. How safe?
| Rating | Dividend Kings Safety Score (162 Point Safety Model) | Approximate Dividend Cut Risk (Average Recession) |
Approximate Dividend Cut Risk In Pandemic Level Recession |
| 1 – unsafe | 0% to 20% | over 4% | 16+% |
| 2- below average | 21% to 40% | over 2% | 8% to 16% |
| 3 – average | 41% to 60% | 2% | 4% to 8% |
| 4 – safe | 61% to 80% | 1% | 2% to 4% |
| 5- very safe | 81% to 100% | 0.5% | 1% to 2% |
| 9 Best Global Aristocrats | 93% | 0.5% | 1.4% |
| Risk Rating | Low-Risk (77th industry percentile risk-management consensus) | A- stable outlook credit rating 2.34% 30-year bankruptcy risk |
20% OR LESS Max Risk Cap Recommendation (Each) |
(Source: DK Research Terminal)
In the average recession since WWII, the average risk of these aristocrats cutting their dividends is about 1 in 200. Even in an extreme recession, such as the Pandemic or Great Financial Crisis, the risk is approximately 1 in 71.
Ben Graham considered a 20+ year dividend growth streak to be an important sign of excellent quality (and 20+ years with zero cuts a sign of quality). These aristocrats average a 28-year growth streak.
S&P estimates the average risk of bankruptcy over the next 30 years is 2.34%, an A- stable rated portfolio with 23% lower fundamental risk than the dividend aristocrats.
Joel Greenblatt, one of the greatest investors in history, considers return on capital (pre-tax profit/annual cost to run the business) to be his gold standard for quality and moatiness.
- S&P 500’s ROC in 2021 was 14.6%
- aristocrats average 100%
- these aristocrats 120% (8.2X better than the S&P)
These aristocrats’ ROC is in the 78th industry percentile confirming a wide moat. Their 13-year median ROC is 64% meaning that return on capital has doubled in the last 13 years.
- growing at an average of 5% per year
This means these Ultra SWAN quality global aristocrats aren’t just wide moat but enjoy a stable or improving moat.
Finally, six rating agencies rate them in the 77th industry percentile for long-term risk management. What does that mean?
| Classification | Average Consensus LT Risk-Management Industry Percentile |
Risk-Management Rating |
| S&P Global (SPGI) #1 Risk Management In The Master List | 94 | Exceptional |
| Strong ESG Stocks | 78 |
Good – Bordering On Very Good |
| 9 Best Global Aristocrats | 77 |
Good – Bordering On Very Good |
| Foreign Dividend Stocks | 75 | Good |
| Ultra SWANs | 71 | Good |
| Low Volatility Stocks | 68 | Above-Average |
| Dividend Aristocrats | 67 | Above-Average |
| Dividend Kings | 63 | Above-Average |
| Master List average | 62 | Above-Average |
| Hyper-Growth stocks | 61 | Above-Average |
| Monthly Dividend Stocks | 60 | Above-Average |
| Dividend Champions | 57 | Average |
(Source: DK Research Terminal)
It means these A- credit rated companies are truly names you can trust with disciplined and adaptable management, strong balance sheets, and sound capital allocation track records.
And of course, their dividend-friendly corporate cultures are second to none.
OK, now that you know why these are 9 of the highest quality, safest, and most dependable aristocrats on earth, here’s why you might want to buy them today.
Wonderful Companies At Wonderful Prices
Dividend Kings Zen Research Terminal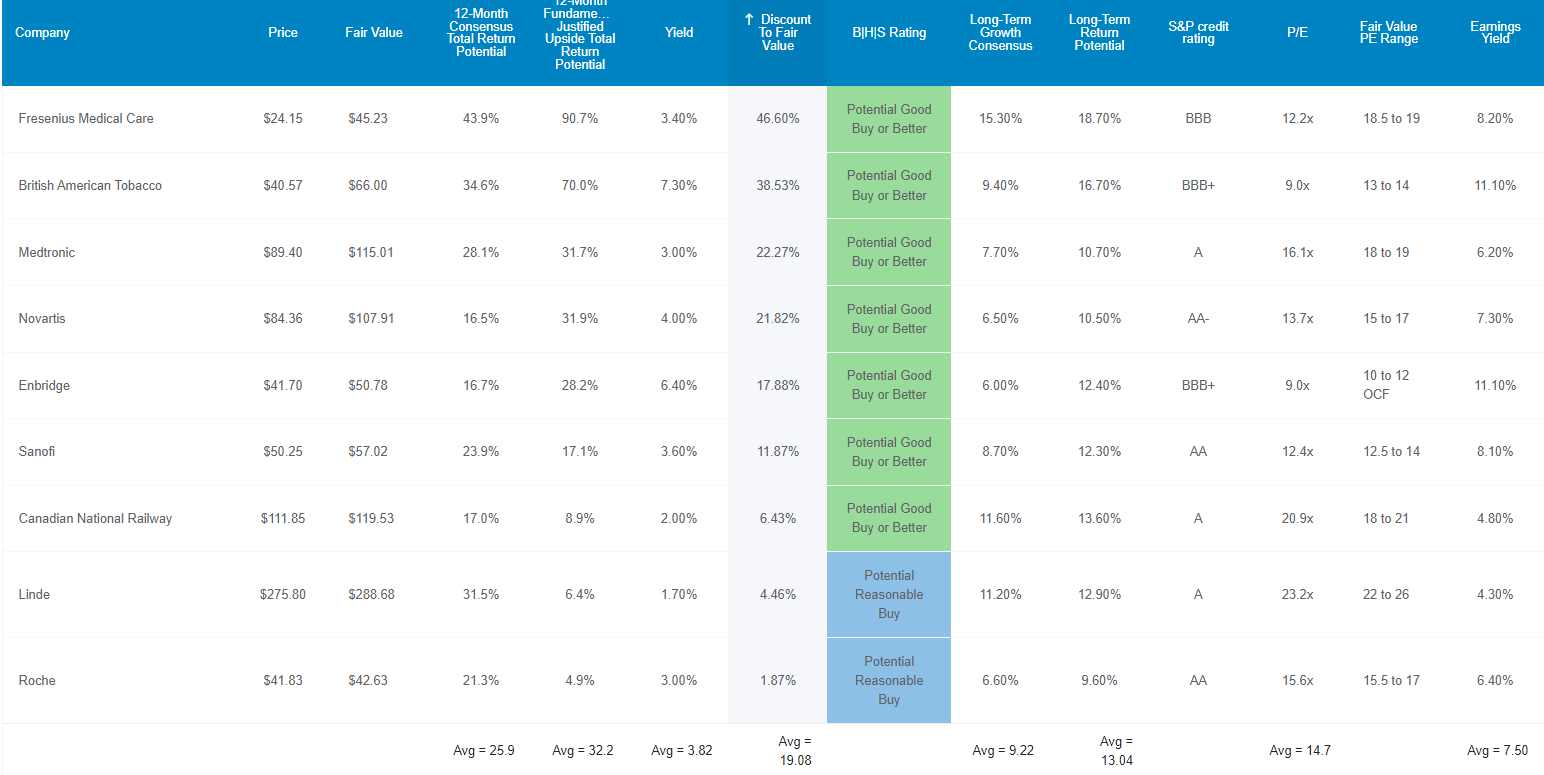
For context, the S&P 500 currently trades at 16.3X forward earnings, a 3% historical discount to its 25-year average of 16.9.
These global aristocrats trade at 14.7X earnings, a 19% historical discount.
They yield a very safe 3.8%, that’s 2.2X more than the S&P 500 and 65% more than the dividend aristocrats.
Analysts expect 26% total returns in the next year but their fundamentals justify a 32% rally over the next year… merely growing as expected and returning to their historical fair values.
But I’m not recommending these global aristocrats to potentially earn you 26% or 32% returns over 12 months. I’m trying to help you achieve life-changing income growth and wealth compounding to help you retire in safety and splendor.
Long-Term Return Fundamentals That Can Help You Retire In Safety And Splendor
Dividend Kings Zen Research Terminal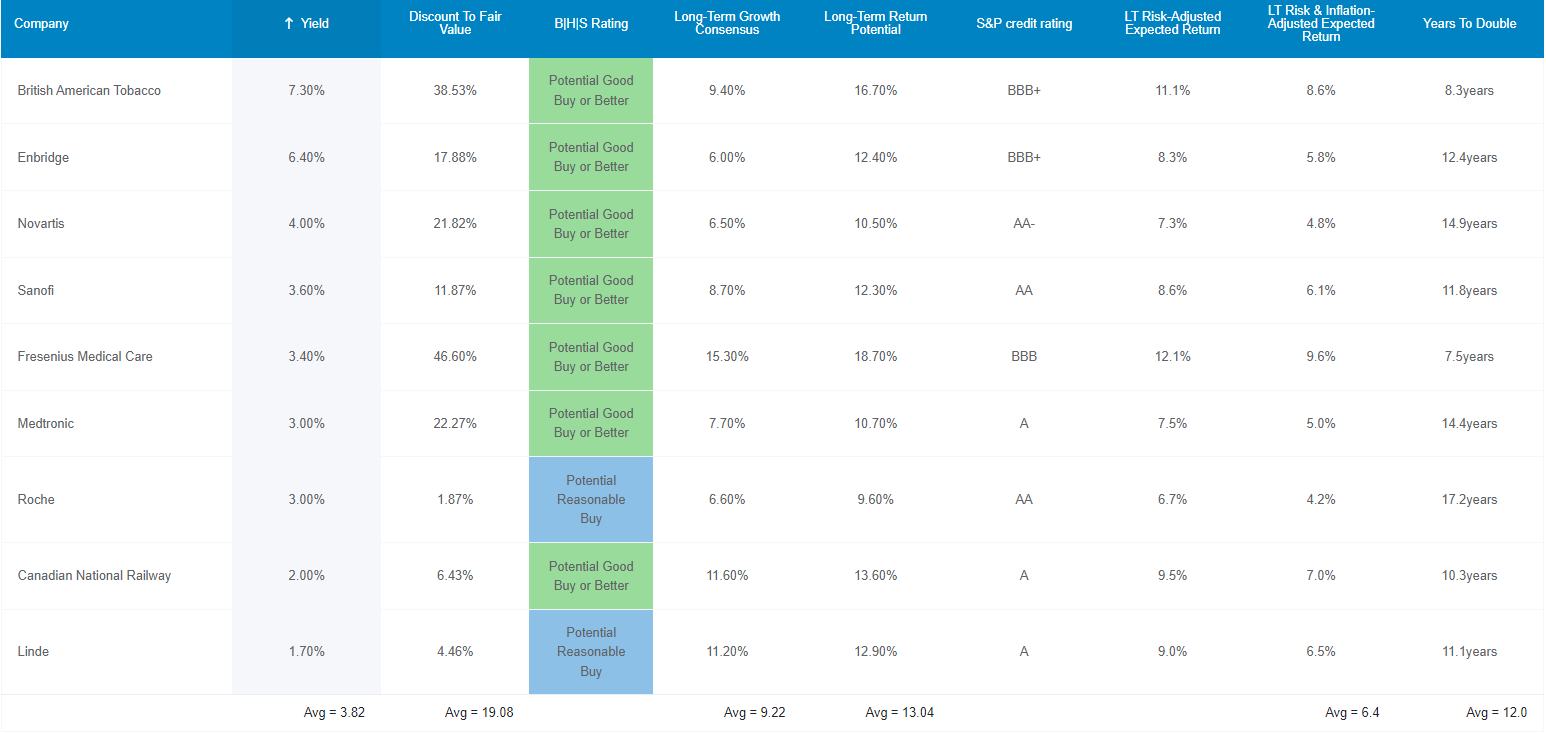
As great as a 3.8% very safe yield is, what is even more impressive is that analysts expect these aristocrats to grow at 9.2% over time and deliver 13.0% long-term returns.
Adjusting for the risk of these companies not growing as expected, inflation, and taxes means a 6.4% risk and inflation-adjusted expected return.
- compared to 4.7% for the S&P 500 and 5.0% for the dividend aristocrats
What does that mean for long-term investors?
- you can realistically expect to double your money in real terms every 12 years
- vs 14.4 years for the aristocrats and 15.3 years for the S&P 500
You might not think that a real doubling time of 3.3 years better than the S&P 500 might make that much of a difference but it most certainly does over time.
Inflation-Adjusted Consensus Total Return Potential: $1,000 Initial Investment
| Time Frame (Years) | 7.6% CAGR Inflation-Adjusted S&P Consensus | 8.4% Inflation-Adjusted Aristocrats Consensus | 10.5% CAGR Inflation-Adjusted 9 Best Global Aristocrat Consensus | Difference Between Inflation-Adjusted 9 Best Global Aristocrat Consensus Vs S&P Consensus |
| 5 | $1,445.67 | $1,493.29 | $1,649.68 | $204.01 |
| 10 | $2,089.97 | $2,229.92 | $2,721.46 | $631.49 |
| 15 | $3,021.42 | $3,329.92 | $4,489.55 | $1,468.13 |
| 20 | $4,367.98 | $4,972.54 | $7,406.34 | $3,038.36 |
| 25 | $6,314.67 | $7,425.45 | $12,218.12 | $5,903.44 |
| 30 | $9,128.95 | $11,088.36 | $20,156.03 | $11,027.08 |
(Source: DK Research Terminal, FactSet)
Analysts think these global aristocrats could potentially deliver 20X returns over the next 30 years.
| Time Frame (Years) | Ratio Aristocrats/S&P Consensus | Ratio Inflation-Adjusted 9 Best Global Aristocrat Consensus vs S&P consensus |
| 5 | 1.03 | 1.14 |
| 10 | 1.07 | 1.30 |
| 15 | 1.10 | 1.49 |
| 20 | 1.14 | 1.70 |
| 25 | 1.18 | 1.93 |
| 30 | 1.21 | 2.21 |
(Source: DK Research Terminal, FactSet)
That’s 2.2X more than the S&P 500 and 1.8X more than the dividend aristocrats.
What does that potentially mean for retirees? The Bureau of Labor Statistics reports that the average retired couple at age 65 has $510,000 in retirement savings.
- so potentially $617,000 more inflation-adjusted wealth over a 30-year retirement vs the S&P 500
- potentially $408,000 more inflation-adjusted wealth vs the dividend aristocrats
This is what I mean by helping you retire in safety and splendor with the world’s best dividend blue-chips.
OK, so this is all very impressive. But while the safety and quality of these aristocrats is beyond question, what evidence is there that they can deliver anything close to 13% long-term returns over time?
Historical Returns Since September 2003 (Annual Rebalancing, Equal Weighting)
How have these global aristocrats performed over the last two decades, when 91% of total returns were the result of fundamentals and not luck?
(Source: Portfolio Visualizer Premium)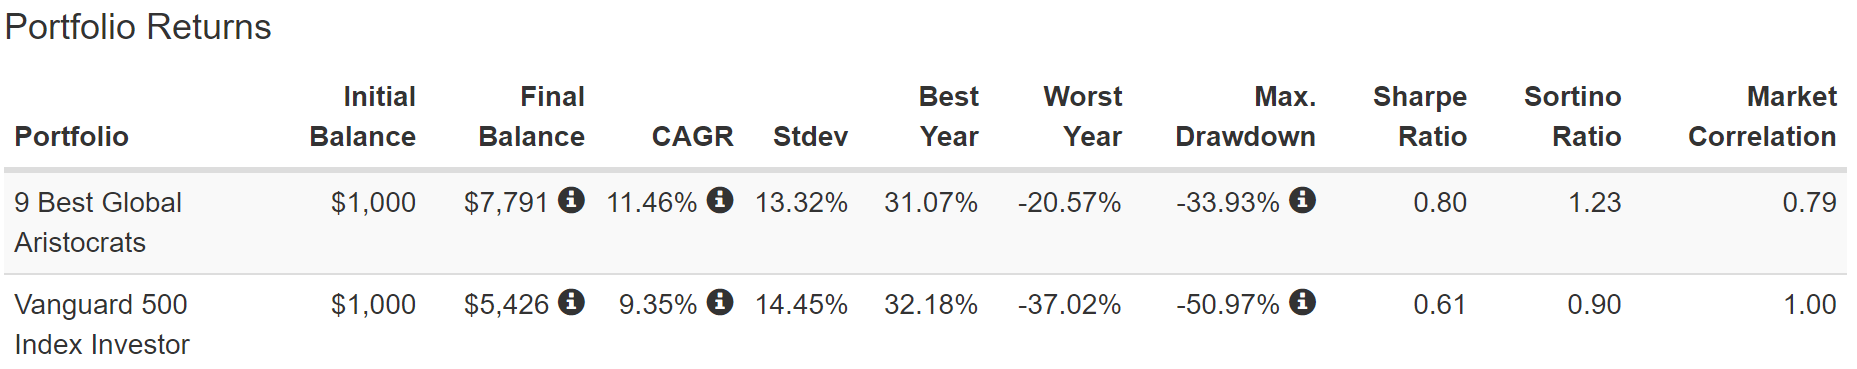
Including the current bear market, these aristocrats delivered 11.5% long-term returns and with 1.2% lower annual volatility than the S&P 500.
(Source: Portfolio Visualizer Premium)
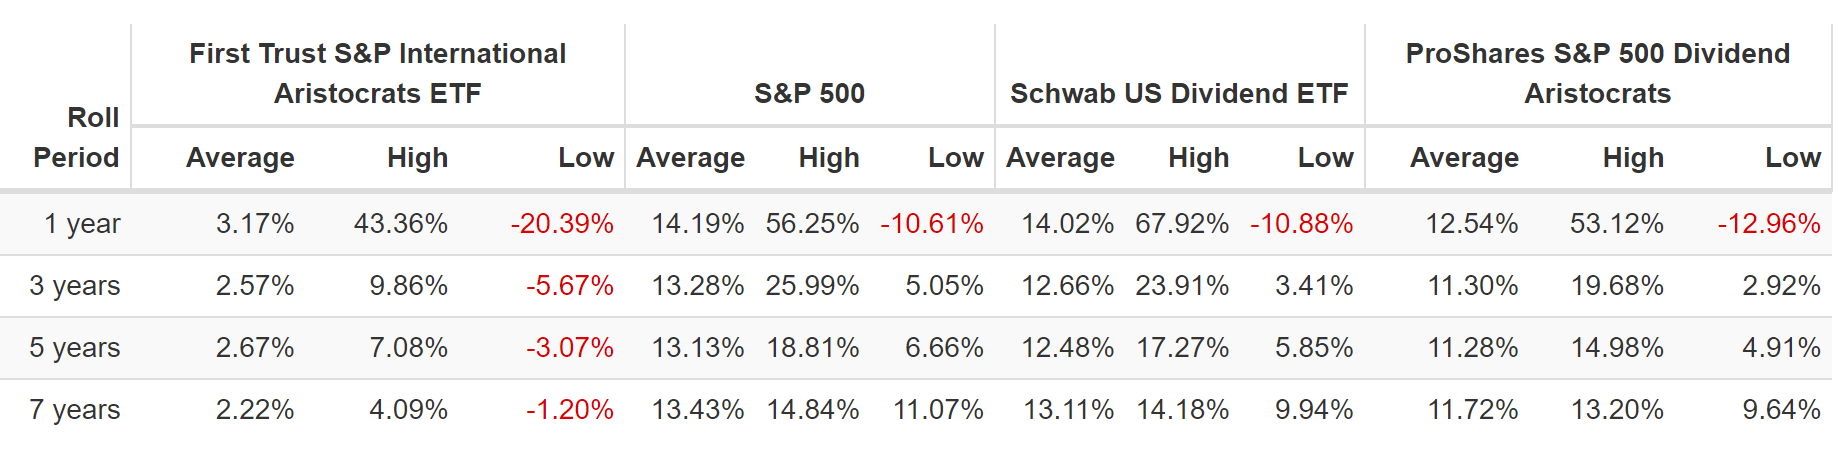
Their average one-year rolling return over two decades was 12.4%, similar to what analysts expect in the future. Their average rolling return has beaten the market in every time frame.
(Source: Portfolio Visualizer Premium)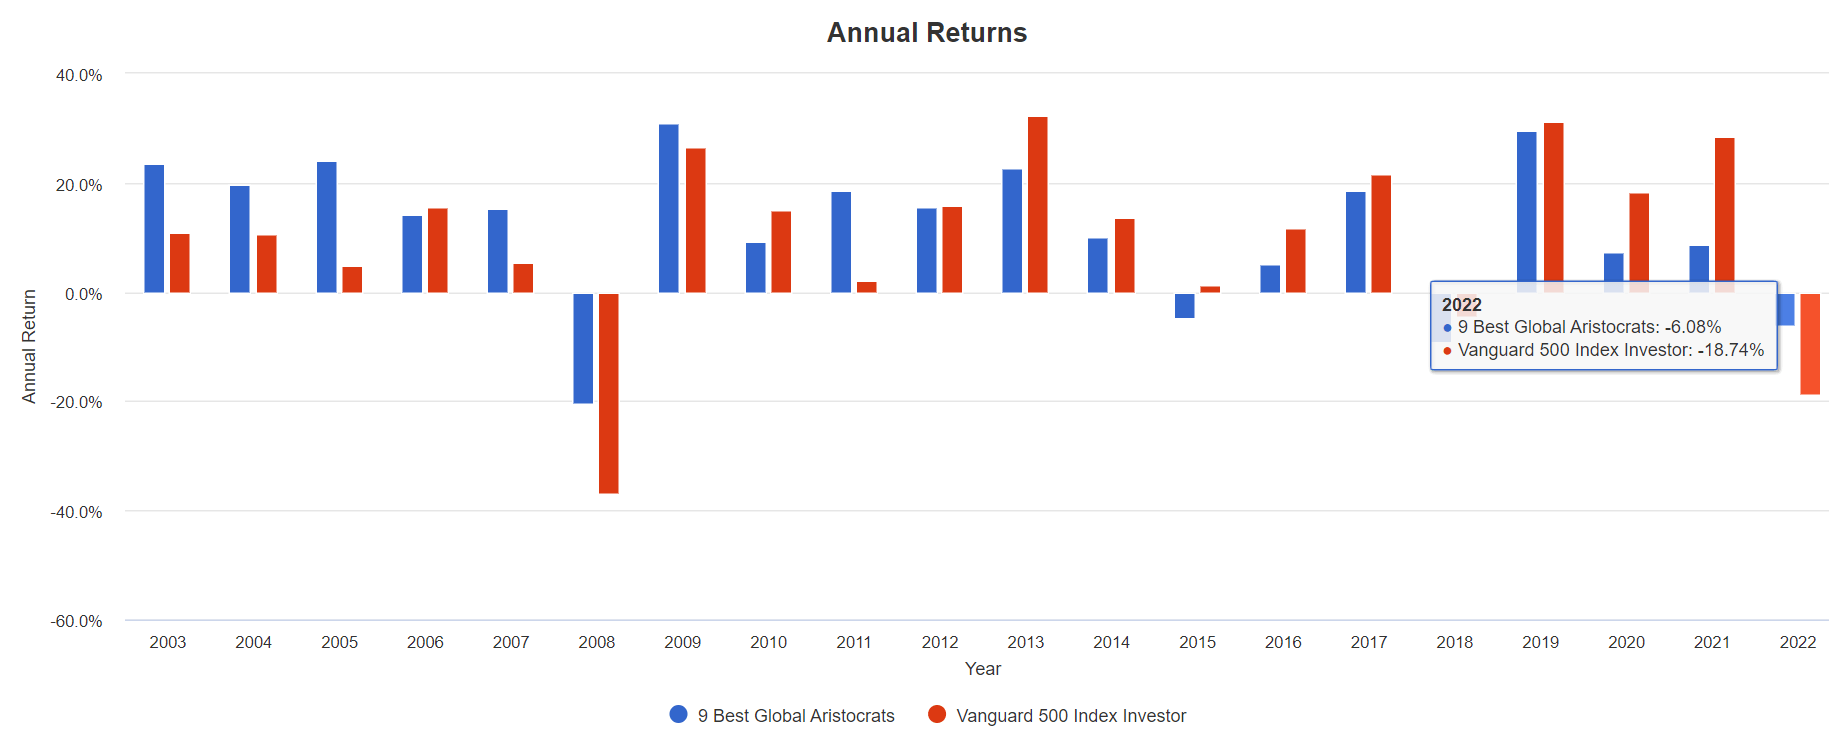
So far in 2022, these aristocrats are down 6% compared to the market’s 19% decline.
(Source: Portfolio Visualizer Premium)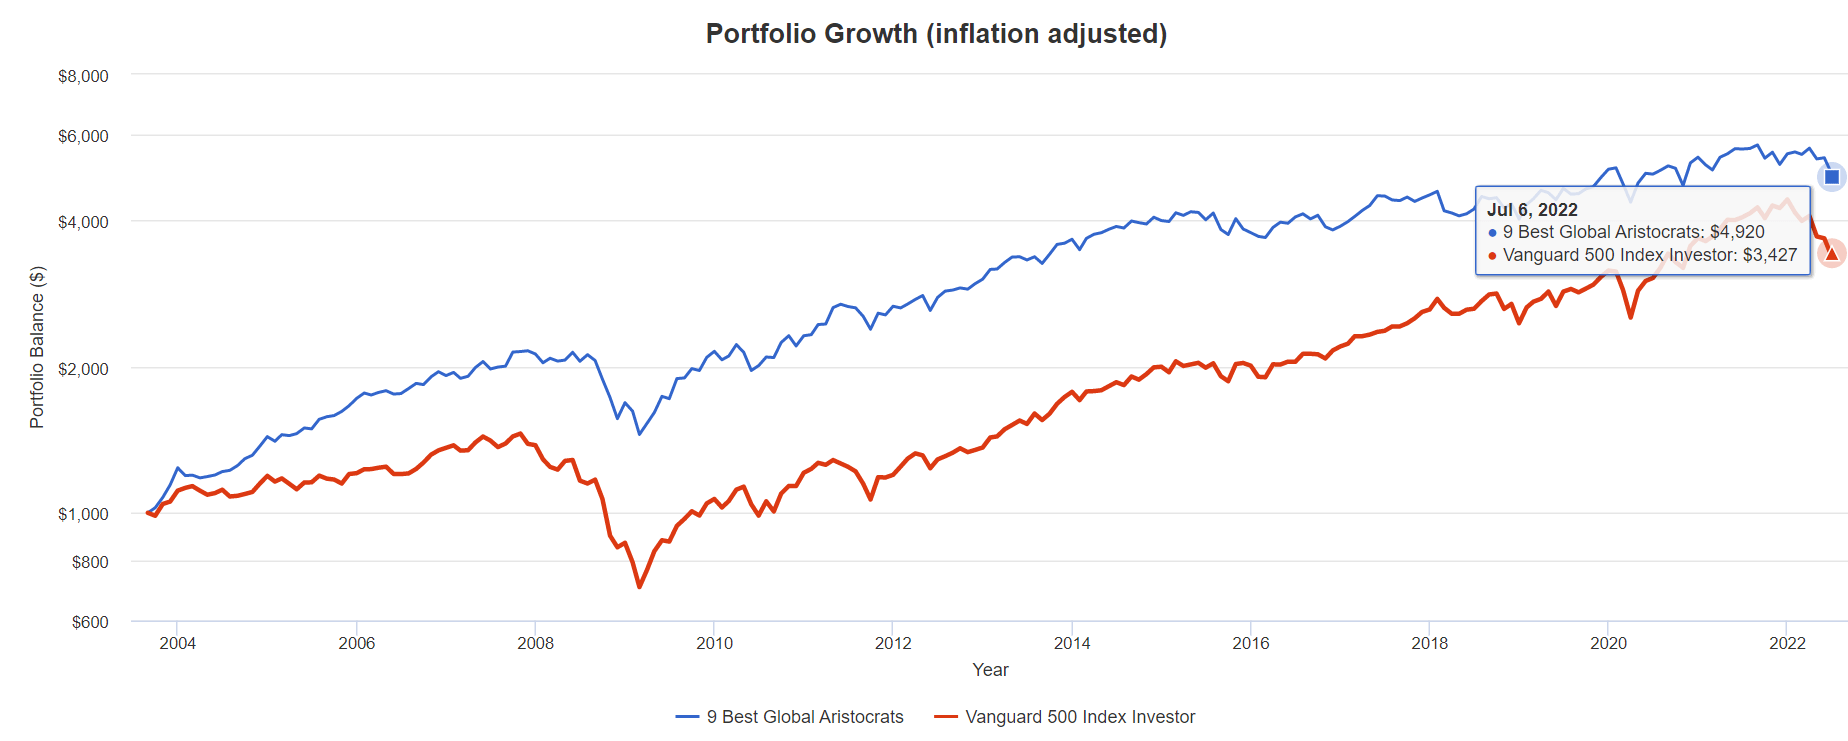
Adjusted for inflation they’ve delivered 5X returns or 44% better than the S&P 500.
And they’ve done all this with far lower volatility during the most extreme market crashes, including a 34% peak decline in the Great Recession.
- 60/40 fell 32%
- S&P fell 51%
(Source: Portfolio Visualizer Premium)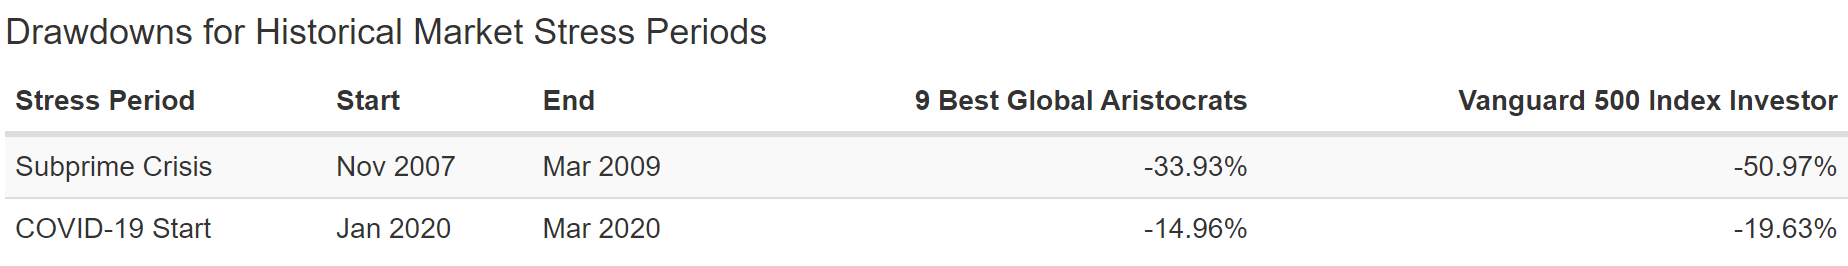
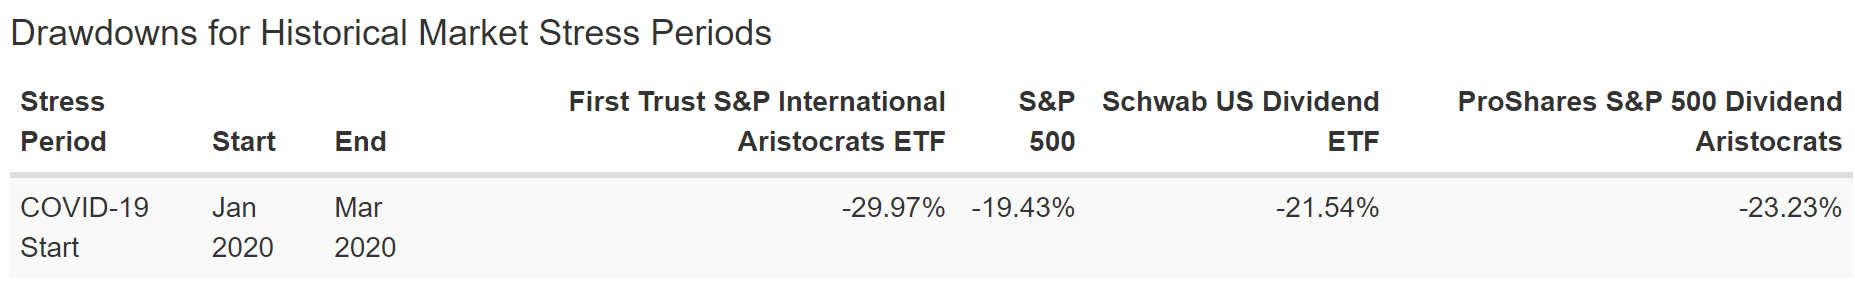
In the pandemic, they fell 15%, 33% less than the S&P 500.
(Source: Portfolio Visualizer Premium)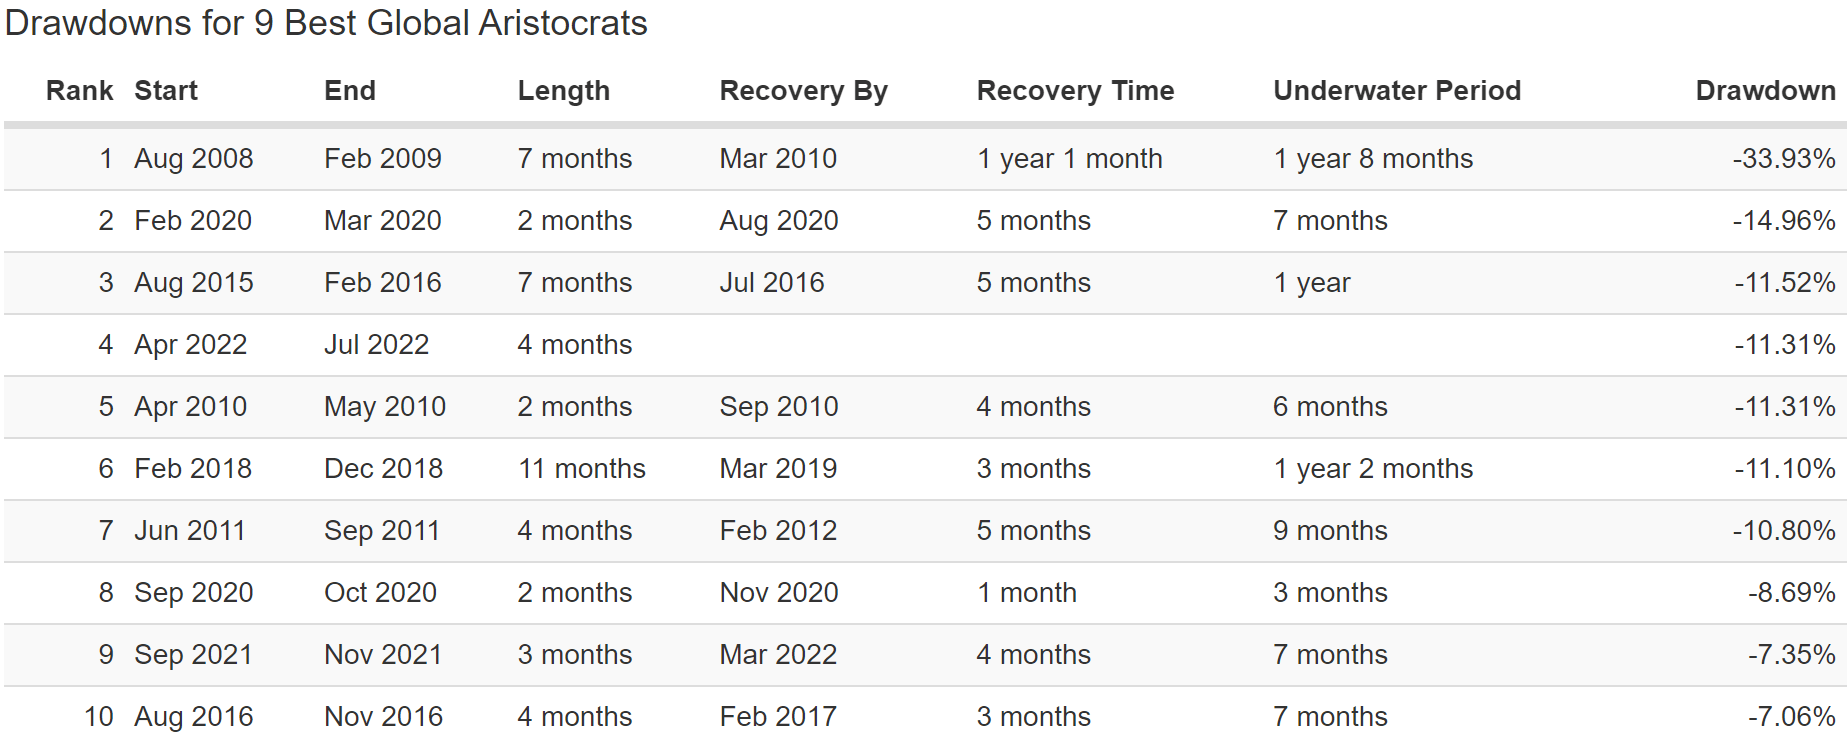
In this bear market, they are down 11%, 1% less than the dividend aristocrats and about half as much as the S&P 500.
And let’s not forget about the #1 reason for owning dividend aristocrats, safe and steadily rising income in all economic and market conditions.
(Source: Portfolio Visualizer Premium)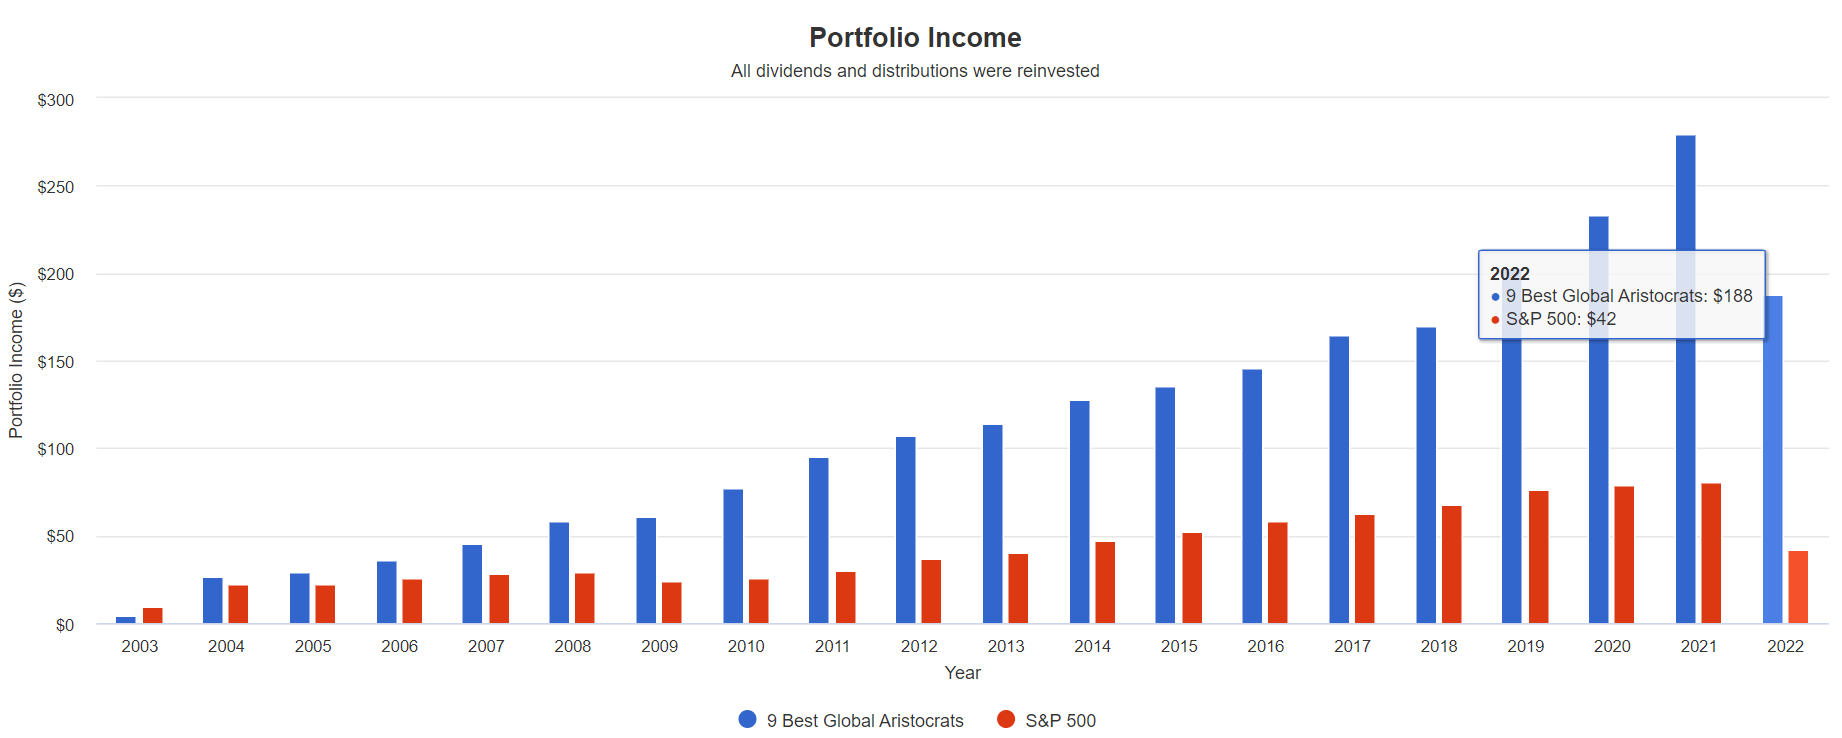
The dividend aristocrat ETF, NOBL, has a variable annual income in some years.
- -27% dividends in 2021 due to rebalancing
Annually rebalancing this portfolio for 20 years has resulted in higher income every single year. Great Recession? Income grew. Pandemic? Income grew. Booming economy? Slowing economy? Collapsing economy? Doesn’t matter these aristocrats deliver the goods in all economic and market conditions.
| Portfolio | 2004 Income Per $1,000 Investment | 2022 Income Per $1,000 Investment | Annual Income Growth | Starting Yield |
2021 Yield On Cost |
| S&P 500 | $22 | $84 | 7.73% | 2.2% | 8.4% |
| 9 Best Global Aristocrats | $26 | $376 | 16.00% | 2.6% | 37.6% |
(Source: Portfolio Visualizer Premium)
Not only did these aristocrats deliver very steady dividends, but their dividend growth rate was 16% annually, or 2X that of the S&P 500.
- thanks to reinvesting dividends at higher yields during these individual companies’ bear markets.
What about future income growth?
| Analyst Consensus Income Growth Forecast | Risk-Adjusted Expected Income Growth | Risk And Tax-Adjusted Expected Income Growth |
Risk, Inflation, And Tax Adjusted Income Growth Consensus |
| 16.8% | 11.8% | 10.0% | 7.5% |
(Source: DK Research Terminal, FactSet)
Analysts expect slightly faster income growth in the future.
- because their starting yields are much higher
Adjusting for the risk of these companies’ not growing as expected, inflation, and taxes, income investors can realistically expect 7.5% annual income growth.
Now compare that to what they expect from the S&P 500.
| Time Frame | S&P Inflation-Adjusted Dividend Growth | S&P Inflation-Adjusted Earnings Growth |
| 1871-2021 | 1.6% | 2.1% |
| 1945-2021 | 2.4% | 3.5% |
| 1981-2021 (Modern Falling Rate Era) | 2.8% | 3.8% |
| 2008-2021 (Modern Low Rate Era) | 3.5% | 6.2% |
| FactSet Future Consensus | 2.0% | 5.2% |
(Sources: S&P, FactSet, Multipl.com)
What about a 60/40 retirement portfolio?
- 0.5% consensus inflation, risk, and tax-adjusted income growth.
In other words, these 9 global aristocrats offer:
- 2.2X the market’s yield (and a much safer yield at that)
- 3.5X its long-term inflation-adjusted consensus income growth potential
- 15X better long-term inflation-adjusted income growth than a 60/40 retirement portfolio
This is the power of global aristocrat bargain hunting in this bear market.
Bottom Line: These Are The 9 Best High-Yield Global Aristocrats You Can Buy Today
Let me be very clear that safety and quality have nothing to do with short-term price movements.
Volatility caused by money managers who speculate irrationality with huge sums will offer the true investor more chance to make intelligent investment moves.
“He can be hurt by such volatility only if he is forced, by either financial or psychological pressures, to sell at untoward times.” – Warren Buffett
Even low volatility blue-chips can become very volatile in bear markets.
Ycharts
On March 16th, 2020, a global margin call triggered the 3rd worst day in market history.
- S&P fell 12%
- Nasdaq fell 12%
- JNJ fell 5%
- LOW and O fell 25% each
What matters over the long-term isn’t short-term price stability but long-term safe income growth.
And that’s what BTI, ENB, NVS, SNY, FMS, RHHBY, MDT, CNI, and LIN deliver in spades.
Today they are 19% historically undervalued.
- 25% average 12-month total return forecast from analysts
- 32% fundamentally justified 12-month total return potential
But I don’t care about 12-month returns, and neither should you. Here’s what really matters.
- higher quality than the dividend aristocrats
- A- stable average credit rating
- 2.3% average 30-year bankruptcy risk (27% less than the dividend aristocrats)
- 3.8% very safe yield
- 9.2% long-term growth consensus
- 13.0% long-term consensus return potential vs 12.4% average annual returns over the last 19 years
Higher yield, lower volatility, stronger returns, and dividend dependability to beat the band in even the two worst economic catastrophes in 75 years.
Global aristocrats like these are how you do long-term high-yield dividend investing right.
Global aristocrats like these are how you can take charge of your financial destiny and make your own luck on Wall Street.
Global aristocrats like these are how you can stop fretting about the Fed, agonizing over the state of the economy, and obsessing over what inflation or interest rates do in any given year.
Because when you have your savings entrusted to the world’s best aristocrats? Then retiring in safety and splendor is not a matter of luck, just time, discipline, and patience.