Triple Net REITs – Rebounding Wins Championships
Dzmitry Dzemidovich
I often hear that triple net leases fare better in recessions because:
- The tenant bears primary maintenance costs;
- Escalator clauses provide organic rent increases;
- Lessees are typically mission-critical or community businesses that normally weather recessions; and
- Master leases provide cross-default protection where applicable.
One way to test this theory is by looking at the last three recessions, which means back testing. We are generally against back testing because the world is a dynamic place where disruptions can cause past relationships to diverge materially in the future. For example, 22 years ago there was very little e-commerce. Amazon sold only books, Facebook was a dream and if you wanted something delivered, it was expensive.
As we look at current threats to Realty Income (O), National Retail Properties (NNN), Agree Realty (ADC), W. P. Carey (WPC) and Federal Realty (FRT) – our Triple Net Group (“TNG”) – we see increased flex-work and consumer delivery services eating into some real estate values. On the other hand, new uses and focuses like experiential real estate continue to revive the sector, too.
We can back test with reasonable confidence that past lessons apply to our TNG REITs.
Back In Time
Based on data from the St. Louis Federal Reserve, we experienced recessions in 2001, 2008 and 2020:
U.S. Recessions (St. Louis Fed) (St. Louis Federal Reserve)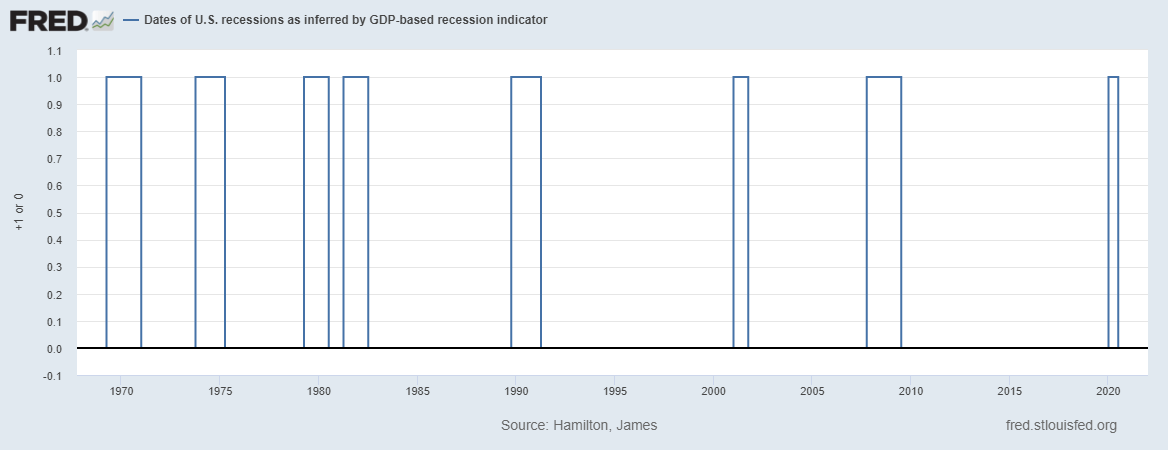
Bar thickness represents the number of negative or recession quarters according to the NBER.
Each of these recessions was different in its origin and how it played out:
- 2001 was the Tech Bubble burst in Q1 followed by 9/11 in Q3. After 4 quarters, economic growth returned.
- 2008 actually started in Q4, 2007 and ended 6 quarters later. Unlike 2001, 2008 was a financial liquidity crisis started in the home mortgage market. It was among the worst recessions in U.S. history and took longer than most to fully recover.
- The 2020 recession lasted just 2 quarters as COVID-19 led to a sharp, short economic disturbance that still reverberates today. While growth was only negative for 2 quarters, its severity created long-tail effects.
2001
How did our TNG REITs do in 2001?
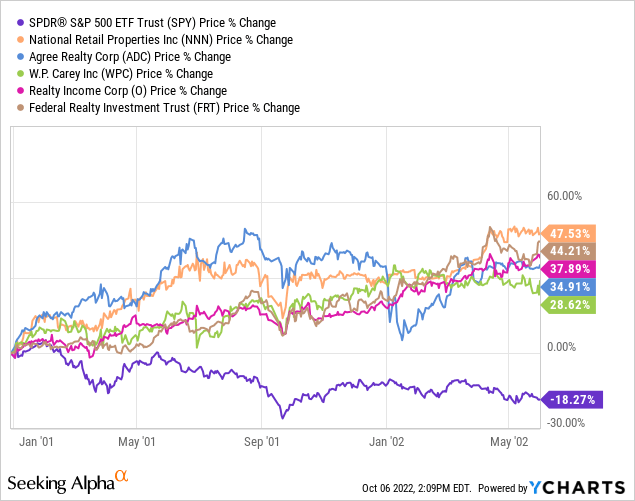
The tech bubble burst was a non-event whereas the S&P declined by double digits to April. Next, we have the Black Swan 9/11 attack which caused a short sharp downturn.
As you can see, the REITs recovered far faster than the overall market from 9/11 while completely brushing off the Tech Bubble.
This sort of performance makes sense given our government’s response to encourage consumer spending accompanied by loose monetary policy and a war (wars are often expansionary because equipment has to be replaced, etc.)
2008
A much nastier affair with longer-lasting effects than 2001.
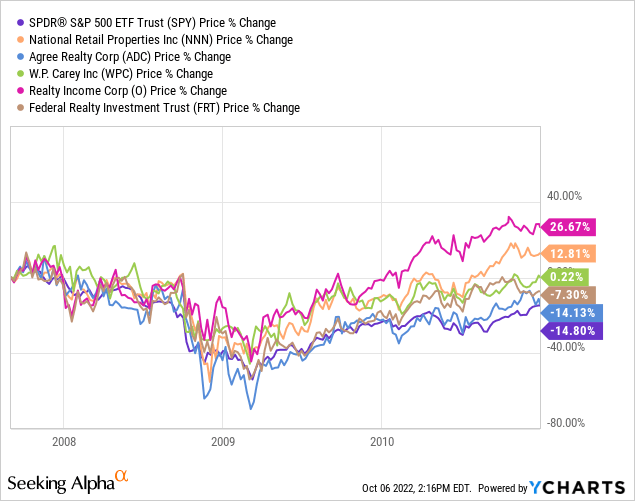
We see that our TNG REITs declined with and recovered better than the overall market by 12/31/2010 again. In this recession, interest rates spiked in late 2007. REITs are interest rate-sensitive investments that typically carry higher leverage, so a financial recession should affect the sector longer than a value bubble bursting elsewhere in the economy, like 2001.
We can see that Realty Income and National Retail Properties recovered best and the entire TNG outperformed the S&P 500 index because tenants paid their rents, whereas many businesses did not survive 2008. Full recovery in this case took 12-24 months for most of the TNG. Again, the shape of this recovery matches our expectations for a financially led recession.
2020
COVID-19 upended the United States by March and the market tanked.
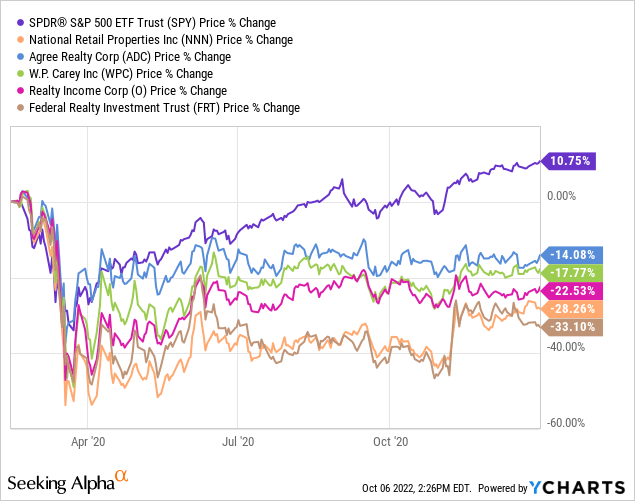
The S&P 500 index, unlike the prior two recessions, took off and materially outperformed our TNG REITs. A lot of the S&P strength was driven by: (1) emerging technology like Zoom and Peloton exploding before falling back to Earth; (2) even looser monetary policy putting extra money in people’s pockets; and (3) elevated retail investor activity. These all combined to drive overall equity values into bubble territory.
While our TNG REITs participated to some degree, with multiples hitting 20x cash flows (5% cap rate) or higher, it was not as exuberant as overall equities. That makes sense to us because a medically-driven Black Swan recovery should be both faster and more shallow for our TNG as tenants realize they would return to their properties but customers hesitate.
That staring contest between open stores and reluctant customers created a recovery lag in tenant revenues. Again, this was not evenly distributed pain. For example, grocery stores were fine, but many of their co-tenants like dry cleaners closed. That created a re-tenanting in shopping centers (Federal Realty recovered to more than 92% rent collected by year-end, up from 57% in May) that takes longer than working through a deferred rent catch-up with a recovering tenant.
Our single tenant TNG collected more than 90% of rents during the COVID-19 peak (very little re-tenanting), but perceived increased risk due to lagging tenant revenues along with rising interest rates have held back full recovery so far.
As long as interest rates remain above 2020 levels, full recovery will have to be growth driven. Valuation multiples move lower as interest rates move higher (higher cap rates) and we expect higher rates to persist for years. Not peak rates, but materially higher than 2020 on the short end of the curve.
How does this affect our outlook as we barrel toward what we expect to be a garden variety recession?
Back to the Future – 2023
2022 has been a strange year. We have yet to find our new normal with COVID-19 (it’s not going away anytime soon). Good news is that people are generally doing better and venturing back in the world, albeit more cautiously than for a non-medical Black Swan event.
While things have changed for some tenants, we see fundamental strength in our economy and consumer sentiment. In our estimation, we are not heading into some horrible permanent decline.
We realize some people see risk as an on/off switch, but it’s really a spectrum, and we are not at a peak risk moment. On the scale of 1-10 where a 10 is the Great Depression, the coming recession looks to be in the 3-6 range – a more normal recession. Our expectations could get nastier depending on how the Fed manages liquidity.
Because we see the Fed committed to an orderly inflation fight, we see the horrible recession risk as remote today.
Triple Net REIT Lag
Our TNG REITs initially have lagged the overall 2020 market recovery, but that reversed itself earlier this year as uncertainty and newly rising interest rates negatively impacted all stock values. The S&P 500 fell 20% into Bear Market territory, while the average retail REIT fell 17% through August 2022. Of our Triple Net Group, only FRT fell further year-to-date (-31.15%).
We see a lagging recovery as justified for the 2020 recession as a result of rising interest rates that negatively impact REIT asset values and expected cash flows.
As we look to 2023, questions about NAV and the appropriate cap rate/discount rate for valuing developed real estate will challenge values as REITs have continued to invest and reshape their portfolios.
Valuations
The following table lays out our key value metrics through Q2 2022:
| Ticker |
Est. NAV* |
Last Price (10-6-22) |
Premium/ Discount to NAV |
Price/ AFFO Multiple (NTM) |
Implied Cap Rate |
L-T Debt/ Tot. Capital |
AFFO Payout Ratio (2022 YTD) |
Dividend Yield (FWD) |
| ADC | $60.55 | $64.28 | 106% | 16.70x | 5.99% | 33.04% | 71.29% | 4.37% |
| FRT | 124.92 | 91.94 | 74 | 18.50 | 5.41 | 57.47 | 67.94 | 4.70 |
| NNN | 45.09 | 39.01 | 87 | 12.07 | 8.29 | 49.17 | 66.25 | 5.64 |
| O | 57.76 | 58.52 | 101 | 14.73 | 6.79 | 36.08 | 76.31 | 5.09 |
| WPC | 72.92 | 71.76 | 99 | 13.39 | 7.47 | 46.96 | 79.87 | 5.91 |
| TNG Average | 93% | 15.08x | 6.79% | 44.54% | 72.33% | 5.21% | ||
|
S&P Global REIT** |
6.3% | 3.4% |
Sources: TIKR, SA, EDGAR, S&P Global and my calculations.
*TIKR
** S&P Global estimates the overall cap rate for REITs has moved up to 6.3% in the 2022 second quarter.
Let’s start with our suspects for fully or overvalued companies. Agree appears somewhat overvalued based on the NAV premium and lower cap rate. Then there are two mixed results: Federal has a low cap rate and Realty Income appears fully valued by NAV. Finally, we take a closer look at National Retail and W. P. Carey.
ADC Breakout
Agree entered into an agreement on 9/28/22 to sell forward, $599MM in common stock at a price of $66.85 per share, a $2.57 premium to the 10/6/22 closing price in a downward market. That overhang, equivalent to about 11% of its market cap, will create harder headwinds in the near term. We rate Agree a HOLD today for coupon clipping.
FRT Breakout
FRT has the highest leverage, the lowest profit margins, a conservative payout ratio and a beaten-down share price. When we look deeper, Federal operates more shopping centers than the rest of the TNG who primarily lease to single tenant properties. FRT was more heavily impacted by COVID-19 with respect to re-tenanting. Federal appears to have earned its relatively poor performance this year.
FRT CEO Don Wood commented at a global real estate conference last month that leasing activity has rebounded strongly. Still, investors tend to haircut shopping centers more than single tenant properties these days. Single tenant not only boasts higher operating margins, it is also perceived to be easier to understand from a risk perspective.
On that basis, we see Federal as fully valued today. We rate it a HOLD.
O Breakout
As Realty Income continues to digest its VEREIT acquisition, the market rewards O’s management track record with a small NAV premium and a less aggressive cap rate.
O has fallen more than 15% this year, better than the retail REIT sector and it appears fairly valued.
But hold on, Realty just raised a $750MM debt offering and it invested a further $1.8BN in new projects in 2022 Q3. O continues to grow despite a looming recession and a large acquisition it is digesting. Realty Income is a balance sheet monster that can grow through good times and bad.
We rate O a BUY today based on its continued growth because it is being valued as though it is standing pat.
NNN Breakout
National Retail Properties has the highest discount to NAV among our single tenant REITs and the highest implied cap rate. What is going on with this industry stalwart? Leverage is sound. The payout ratio is arguably low, which should help the stock price by freeing up capital to reinvest.
Instead, NNN is off as much as O without O’s nice value ratios. It’s not as though NNN management hasn’t lifted guidance three times by the end of Q2. Further, CEO, Steve Horn announced on the Q2 earnings call that,
“In July, we announced roughly a 4% increase in our common stock dividend to be paid on 15 August, thus making 2022 our 33rd consecutive annual dividend increase. National Retail Properties is one of the select companies of under 90 U.S. public companies, including only two other REITs, which have achieved this impressive track record.”
Right! NNN and O are remarkably similar once you count O’s soon-to-be-raised $750MM in new debt, yet NNN suffers a far higher cap rate discount. Realty earns that difference by investing more aggressively today. Still, NNN is having a very solid year when many are not.
If O is a BUY today, then so is NNN, and maybe even more so. We cannot see why National Retail should trade at a discount to the S&P REIT cap rate of 6.3%.
W. P. Carey Breakout
Our most international member of the Triple Net Group, WPC boasts the highest yield on the highest payout ratio. We judge that payout ratio to be at the high end of sustainability for a REIT structure. We question the NAV estimate here more than other REITs because the WPC portfolio is 28.3% invested in Europe with a total of 35.4% invested internationally.
A strong dollar, an ongoing European conflict and higher Eurozone inflation make us question the NAV estimate as being far more susceptible to error. Instead, we think the 7.47% cap rate more correctly reflects the elevated risk concerns outside the U.S. We think it’s a bit on the high side, but not enough discount to make this a buy today. We rate WPC a HOLD for now.
Conclusions
Over the three most recent recessions, our Triple Net Group of REITs consistently demonstrated quick if not full recoveries.
The brief COVID-19 recession created long-tail effects in retail and office properties that still reverberate within the TNG today. While the S&P 500 fairly exploded out of the 2020 recession, our Triple Net Group is still rebuilding.
Given that we expect a historically normal recession with elevated interest rates hurting cap rates, we believe this is still a great sector to hold in one’s portfolio.
These guys can grow through it because they know how to rebound!