The Passive 60/40 Portfolio Is Broken – Do This Instead
William_Potter
Co-produced by Austin Rogers for High Yield Investor
The 60/40 portfolio may have reached the end of its useful life as an investment strategy.
The whole idea behind passively holding a portfolio of 60% stocks and 40% bonds, usually through one or a few low-cost funds, is that the majority stock exposure will give ample upside during bull markets while the minority bond exposure will provide some upside (or at least downside protection) during bear markets.
For decades upon decades, this investment strategy performed more or less as expected.
Then interest rates hit zero (or close to it), leaving little further room for interest rates to compress.
And then inflation took off, causing interest rates to chase after them to the upside.
This has led to an extremely rare occurrence in the markets: both stocks (SPY) and bonds (AGG) are down by double-digits this year.
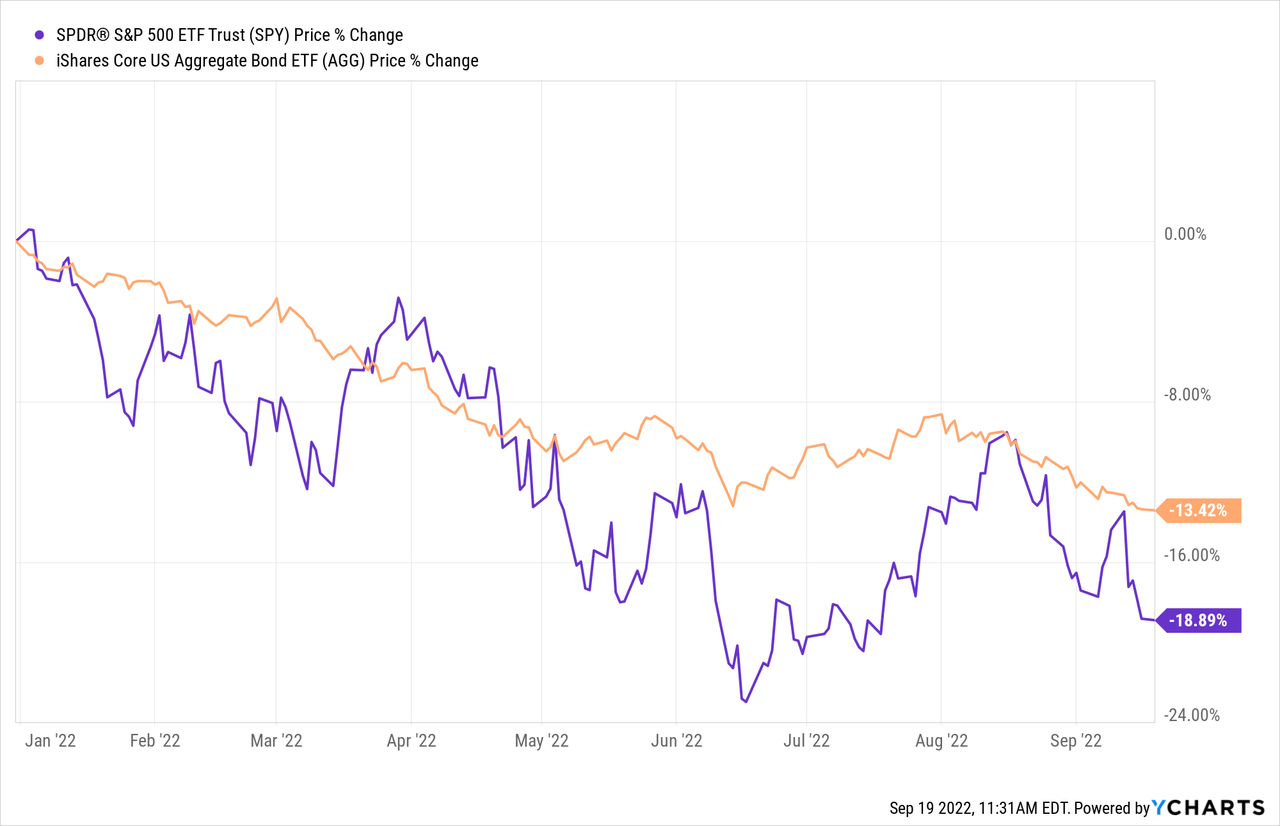
On a price basis alone, the 60/40 portfolio is down 16.7% so far this year.
This uses the aggregate bond market, including both public and private debt. But if we were to do a 60/40 portfolio where the bond segment is made up of long-term Treasuries, such as can be found in the Vanguard Extended Duration Treasury ETF (EDV), the 60/40 portfolio’s price performance would drop to an abysmal -25.1% year-to-date.
If we move beyond price basis alone to total returns (including dividends and interest income), the 60/40 portfolio’s performance marginally improves, but neither stocks’ average dividend yield nor bonds’ average interest yield are enough to make much of a difference.
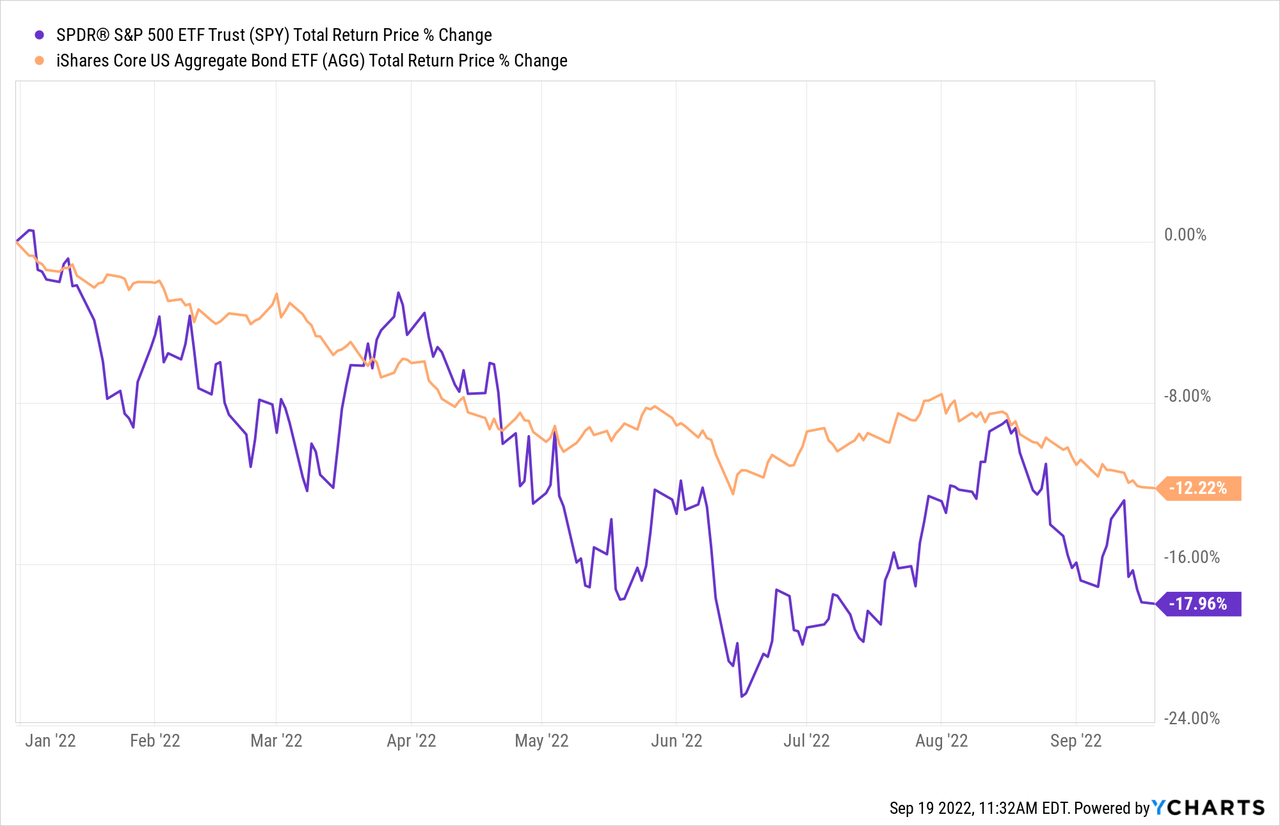
On a total return basis, the 60/40 portfolio is helped by income only a little bit, producing -15.7% YTD.
However you measure it, 2022 has so far been among the worst years of performance for a 60/40 portfolio ever recorded.
Michael Batnick
It’s unclear whether the above image shows returns on a price basis alone or a total return basis, but either way, the 60/40 portfolio has only performed worse two years in recorded history, and both of them were during the Great Depression.
Since 1976, there has been only one other year in which both stocks and bonds generated a negative return.
Michael Batnick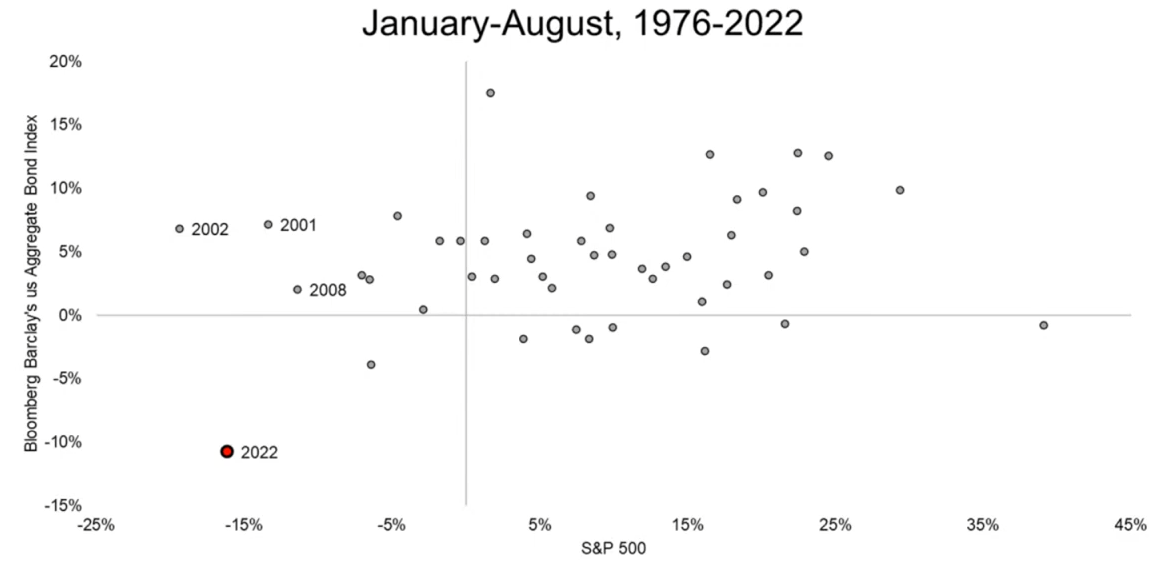
This year has been an extreme outlier because of the speed at which interest rates have soared higher. And though long-term interest rates are still somewhat low from a historical perspective, the total debt in the US economy (public and private) has never been higher.
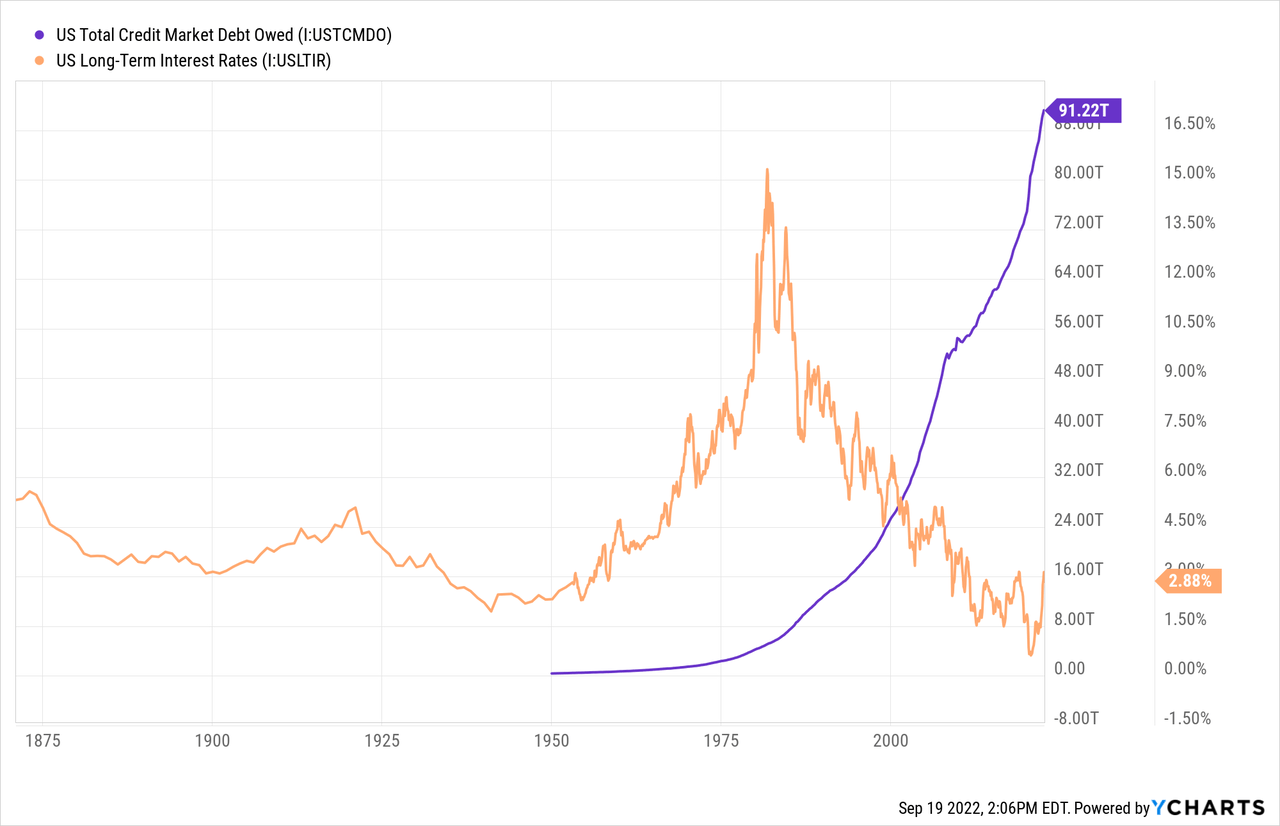
One can’t look at interest rates in a vacuum to measure their level. One must look at the level of rates relative to the level of debt in the economy.
Long-term interest rates might be only marginally higher than they were in 2018, but total public and private debt is 30% higher. And yes, interest rates were far higher in the early 1980s, but total debt was 1/10th the level it is today.
At this point, long-term interest rates could do one of three things:
- Remain rangebound for a while
- Continue rising
- Go back down toward zero
The first two scenarios would be bad for stocks, while the second scenario would be bad for both stocks and bonds.
Rates almost never stay rangebound for very long, so that does not seem like a likely scenario in any case.
Rates could certainly keep rising. This scenario would manifest if the secular inflation thesis proves correct and the Fed has to keep hiking rates aggressively to combat it.
Finally, rates dropping back toward zero would produce a great result for the 60/40 portfolio, but for how long? Can US interest rates sustainably go below zero? That seems unlikely for as long as the USD remains the world’s primary reserve currency.
Thus, there is limited upside left to be gained from bonds in aggregate. One could certainly achieve a nice, one-time return from bonds if rates do fall back toward zero. But after that, further gains will be limited, while downside risk will be incredibly high. When rates push off from ultra-low levels, the 60/40 portfolio is liable to experience more of the same abysmal performance being experienced today.
The Solution: Go Active
The 60/40 portfolio is the ultimate passive, set-it-and-forget-it investment strategy. But what is hopefully clear from the preceding discussion is that passively investing in a 60/40 portfolio almost certainly won’t work as well going forward as it has over the past few decades.
Rather than move more toward a passive strategy, investors should be embracing more active strategies, whether that means becoming a stock-picker oneself, shifting capital into actively managed funds, or investing in a marketplace service on Seeking Alpha. (Yes, we know we are shamelessly talking our own book here, but we think it’s true.)
Instead of shifting toward active strategies, investors are doing the opposite and continuing to pour more and more money into passive ETFs and funds.
Financial Times
In 2021, for the first time ever, passive funds accounted for a greater share of total stock market capitalization (16%) than active funds (14%).
Of course, this still leaves 70% of market capitalization in the hands of individual investors (via direct ownership), institutional investors, insiders, etc. But all too many investors continue to ride the passive investing train that appears likely to produce poor results going forward.
The Rise of Alternatives
Another big problem with the 60/40 portfolio is that the investment universe is so much larger than merely stocks or bonds. There is also the vast world of alternative assets to consider.
What is an alternative asset? Pretty much any kind of investment that falls outside of the categories of stocks, bonds, or cash. Examples include:
- Commercial real estate
- Infrastructure
- Private equity
- Private debt
- Commodities & miners
- Art/collectibles/fine spirits
One common trait shared by all or almost all alternative assets is illiquidity. Unlike shares in a publicly listed company, there is usually no daily tradability available for these types of assets. While that may reduce their convenience for investors, the illiquidity also tends to significantly reduce volatility.
In addition to greater stability, these kinds of investments often generate higher income. Of course, for static assets like commodities, art, collectibles, or fine wines, returns solely come from buying low and selling high. But for almost every other kind of alternative asset, high income is a feature.
So, alternative assets offer three things that a 60/40 portfolio can’t:
- Greater diversification
- Less volatility
- Higher income
Unsurprisingly, the investment world is already heading in the direction of more exposure to alternatives.
According to a survey of financial advisors put out by Cerulli Associates in July 2022, FAs have alternative asset allocations representing 14.5% of their clients’ portfolios on average, and they expect that share to rise to 17.5% in two years.
But that is for the average client of a financial advisor, who probably has an above-average level of wealth but isn’t necessarily ultra-wealthy.
However, it’s interesting to note what the ultra-wealthy are doing with their investment portfolios, as collated by Tiger 21:
Tiger 21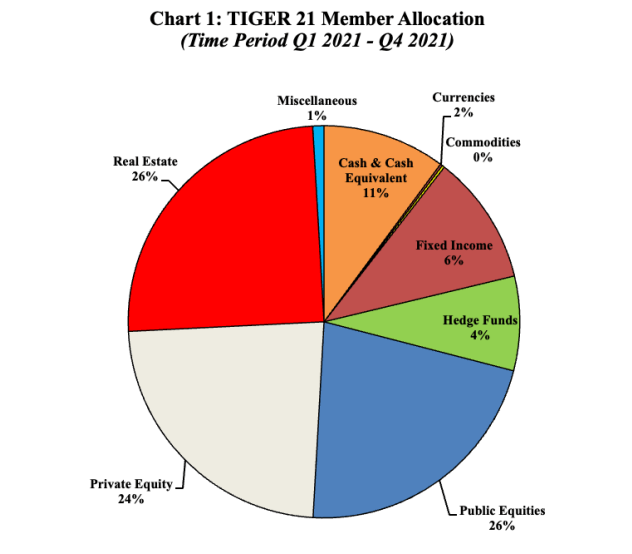
Rather than 60% stocks and 40% bonds, the ultra-wealthy invest only 26% of their capital in stocks and a mere 6% in fixed income/bonds. Less than a third of their total portfolios is in the two components of the long-venerated 60/40 portfolio.
Instead, half (exactly 50%) of Tiger 21 members’ capital is invested in private equity and private real estate, either directly or indirectly owned, and another 4% is in hedge funds.
Our Approach
At High Yield Investor, we love the alternatives space, but we don’t have millions of dollars available to directly invest in commercial real estate or private equity funds.
That’s why we love publicly traded alternative assets. Here are some examples:
- Business Development Companies (BDCs)
BDCs are the publicly traded stocks of companies that would otherwise be called “private debt investors.” They borrow money at relatively low interest rates and extend loans (typically 2-4 years in length) to middle-market businesses or late-stage startups at higher interest rates. The spread is their profit.
But it’s even better than that, because most BDCs also participate in the upside of their portfolio companies by taking equity stakes or holding warrants. Like the venture capital investment model, BDCs earn huge returns from a handful of big winners even though most equity investments don’t produce much upside.
The quintessential example of this is Houston-based Main Street Capital (MAIN), the bluest blue-chip BDC in the space. Though one might think that MAIN would be down more than the market this year because it makes high-yield loans, MAIN is actually performing better than the market:
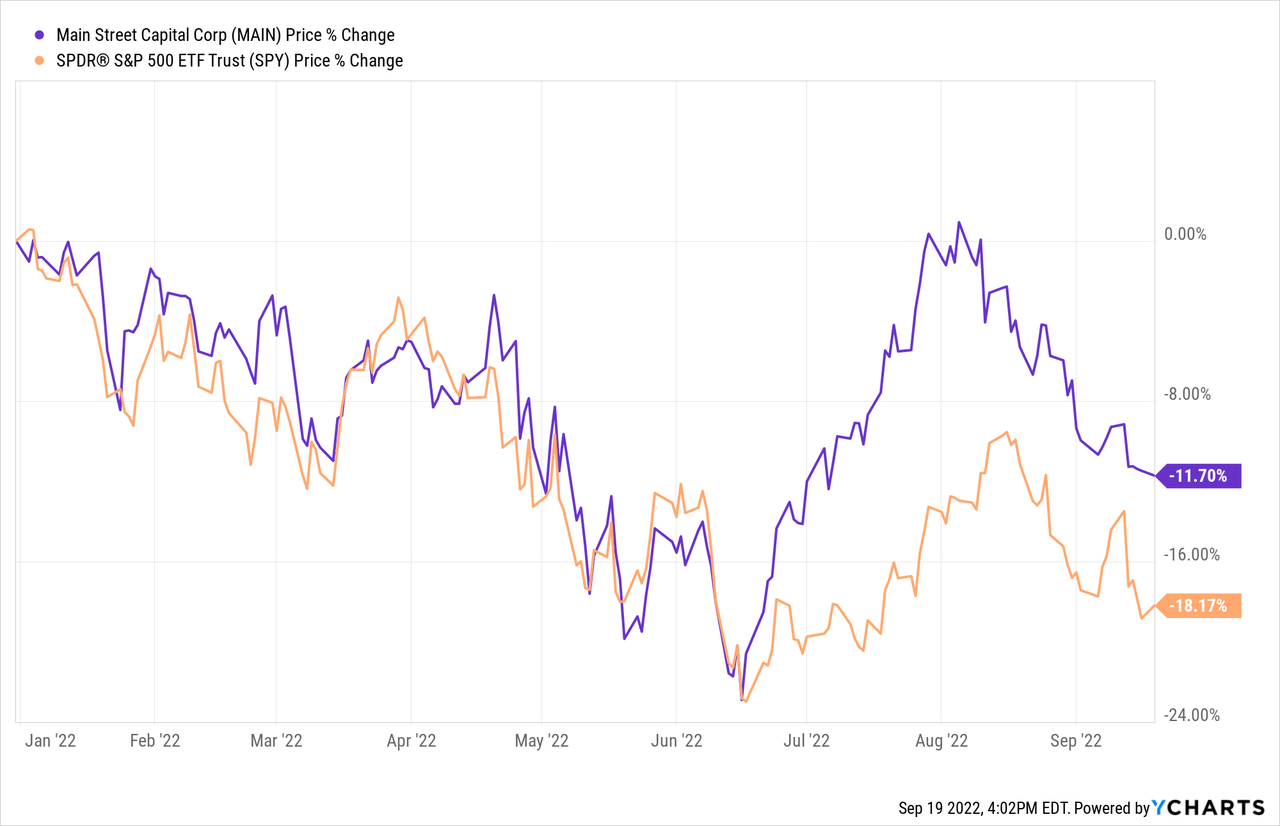
This is due in no small part to the continued strong performance of MAIN’s middle-market clients and thus also the BDC’s loan portfolio.
MAIN pays a 6.7%-yielding dividend that is paid monthly. Though we like MAIN for the strength of its portfolio, balance sheet, and management, there are other picks in the BDC space we like even better.
- Renewable Energy Power Production Facilities (RNRG)
Another of our favorite publicly traded alternative assets is renewables. While we believe oil and gas will continue to be needed for decades to come, it is undeniable that governments and corporations are pouring trillions of dollars toward increasing production of electricity from renewable energy sources like wind and solar.
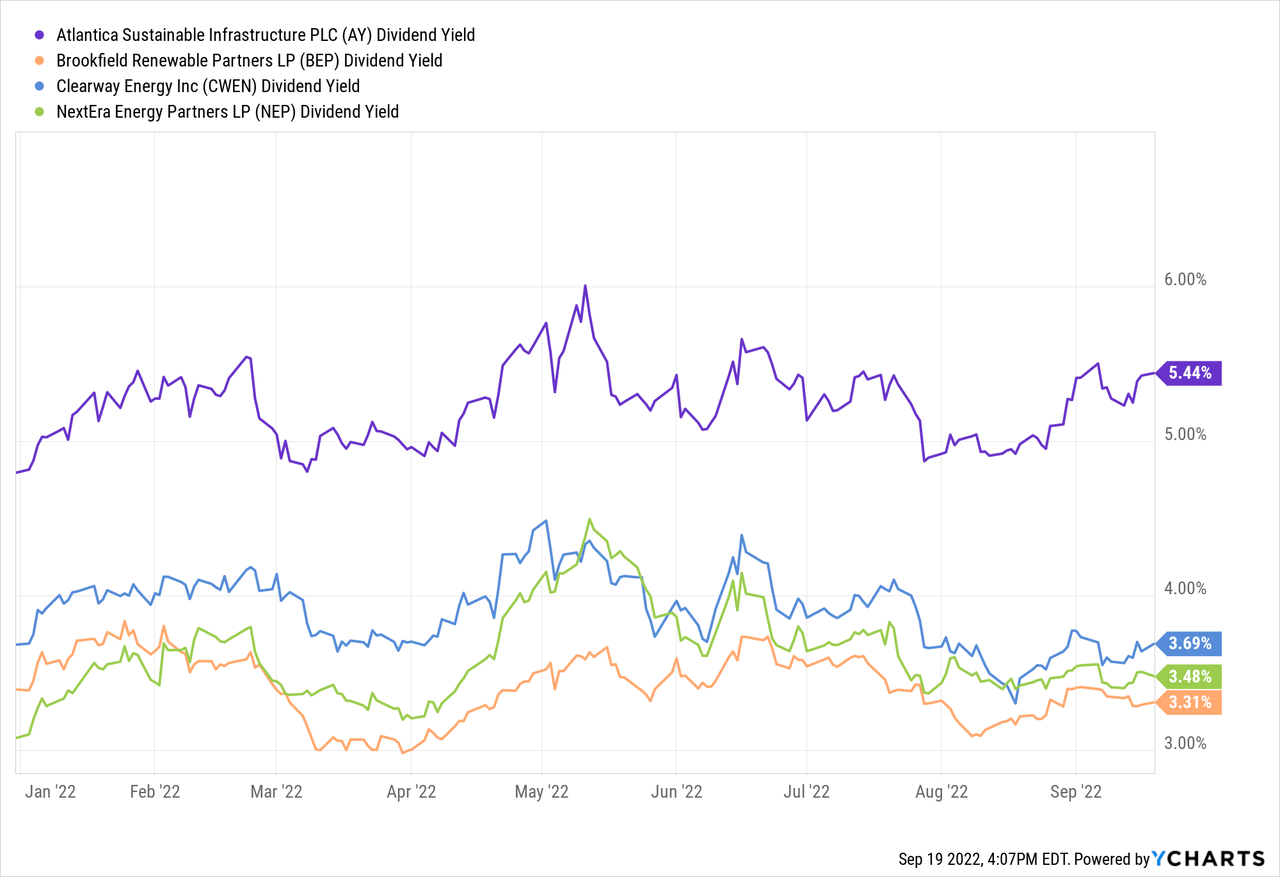
Rather than the solar panel makers (TAN) themselves, we prefer investing in the standalone renewable power producers like Brookfield Renewable (BEP, BEPC), NextEra Energy Partners (NEP), Clearway Energy Inc. (CWEN, CWEN.A), and Atlantica Sustainable Infrastructure (AY).
Though BEP is the undisputed industry leader in this space, as it has been around for over two decades and is larger than the rest of its peers combined, our favorite pick in this space is the smallest and highest yielding of the four: AY.
AY has a global footprint while still fixing or hedging the vast majority of its cash flows to the USD (to minimize foreign exchange risk), and it invests not only in wind and solar but also in other infrastructure such as electrical transmission lines and water desalinization plants. Moreover, all of its project-level debt is fully self-amortizing with 100% of secured debt expected to be paid off before the end of each respective revenue contract term.
We see little reason for AY to trade at such a steep discount to peers when its long-term growth prospects are nearly as good.
Bottom Line
The 60/40 portfolio has broken down in a big way this year, and we are unsure whether it will regain its preeminence as the most trusted, go-to investment strategy for risk-adjusted returns anytime soon.
That explains why financial advisors, institutional investors, and the ultra-wealthy are increasingly allocating more and more of their investments to alternatives. At High Yield Investor, we are too. BDCs and renewables are just two of them.