Southern Copper: Uncertainties About 2023 (NYSE:SCCO)
Minakryn Ruslan
Introduction
The Phoenix-based Southern Copper Corporation (NYSE:SCCO) is a majority-owned, indirect subsidiary of Grupo Mexico SAB de CV (OTCPK:GMBXF).
As of September 30, 2022, Grupo Mexico, through its wholly-owned subsidiary Americas Mining Corp (“AMC”), owns 88.91% of its capital stock.
SCCO Business (SCCO Presentation)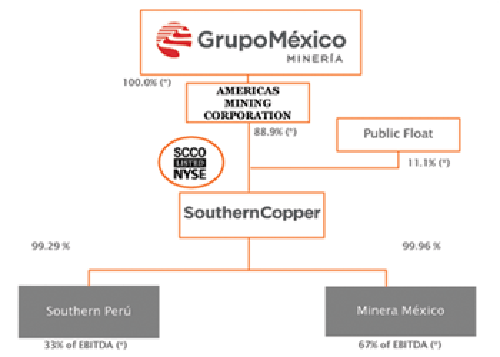
The company is an integrated producer of copper, representing about 80% of the revenue, and other metals (mainly molybdenum, silver, and zinc).
Note: This article is an update of my article published on July 24, 2022. I have followed SCCO on Seeking Alpha since January 2021.
The company operates mining operations, smelting, and refining facilities in Peru and Mexico (See picture below). Southern Copper also conducts exploration activities in Argentina, Chile, and Ecuador. From the most recent company November presentation.
SCCO Company overview 3Q22 (SCCO Presentation November)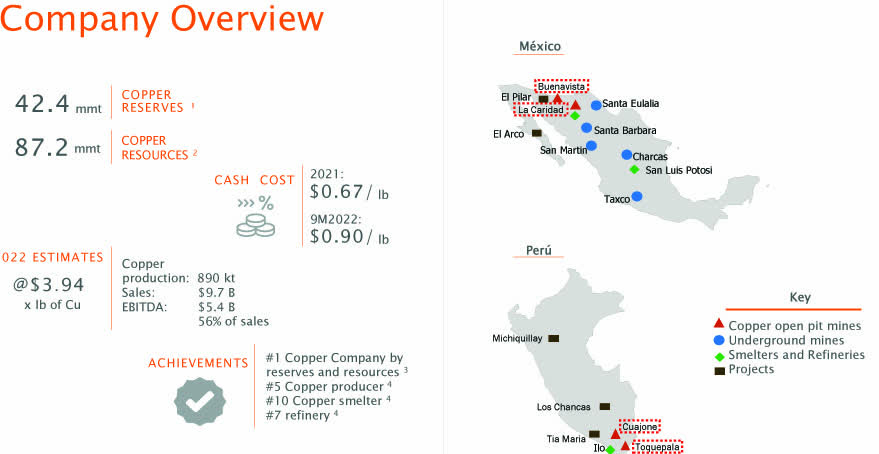
1 – Summary
On October 27, 2022, SCCO reported third quarter 2022 earnings of $0.67 per share on a net sale of $2,156.9 million, missing analysts’ expectations.
Revenues were down 19.5% from the prior-year quarter.
Lower metal prices for copper and by-products Molybdenum and Silver drove the decrease from 3Q21. The sales volume for copper increased by 2.4% YoY but fell significantly for molybdenum and zinc.
SCCO Quarterly revenues per metal in 3Q22 (Fun Trading)
Cash flow from operating activities in 3Q22 was $590.1 million, representing a decrease of 51.7% over the $1,220.6 million posted in 3Q21.
The Chairman of the Board, German Larrea, said in the press release:
The results of 3Q22 reflect the full recovery of our Cuajone operation after the violent stoppage suffered during the first half of this year. We remain fully committed to creating value for our shareholders and generating positive impacts for all the communities, regions, and countries where we operate.”
An essential element to consider: Southern Copper owns the world’s largest copper reserves at 42.4 MMT.
SCCO Reserve (SCCO Presentation)
2 – Stock performance
Southern Copper is the second copper company I am covering at Seeking Alpha after Freeport-McMoRan (FCX). I recommend reading my most recent article on Freeport McMoRan, published on October 26, 2022, by clicking here.
Both companies have dropped significantly since April due to a significant drop in the copper price and lingering fear of recession due to the Fed’s action. However, the miners have turned around since October, and SCCO is up 3% in 2022.
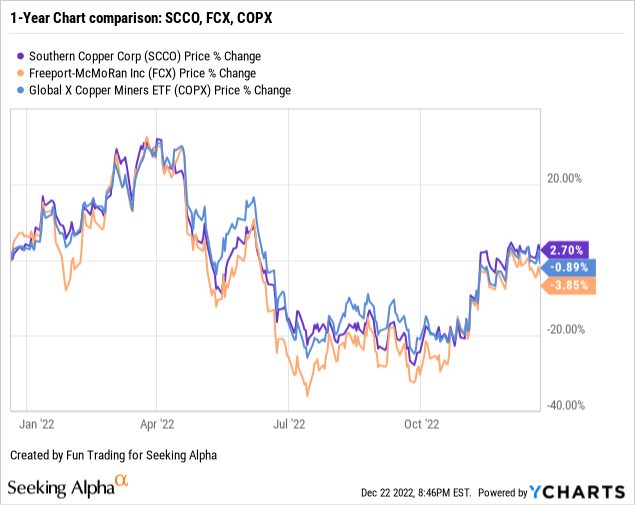
SCCO, Freeport-McMoRan, and the Global X Copper Miners ETF (COPX) are performing similarly.
3 – Investment Thesis
I consider Southern Copper and Freeport McMoRan two solid copper companies in terms of balance sheets which pay generous dividends despite a weakening copper price.
The primary difference between FCX and SCCO is that the latter is not producing significant gold production and, thus, is more sensitive to copper price volatility. Copper represented 74.6% of SCCO sales in the 3Q22.
SCCO Gold and Copper one-year chart (Fun Trading StockCharts)
The outlook for copper is still uncertain at the moment. The copper price has increased significantly since the low in July but is now plateauing just below $3.80 per pound.
The copper market is expected to experience another volatile 2023 as the base metal will be caught between a possible painful global recession and the shift to green energy with rising demand for EVs.
However, Goldman Sachs expects copper prices averaging 2023 around $4.42 per pound, with the average price jumping to $5.44 by 2024. I consider this price outlook very optimistic.
But the bottom line is that copper is and will always be a critical component of the global economy, and using stock weaknesses to build a copper portfolio is crucial.
In the conference call, CFO Raul Jacob said:
Looking into the copper market. In 3Q22, the LME copper price decreased 17.4% from an average of $4.25 per pound in the 3Q21 to $3.51, reflecting concerns about a simultaneous recession in the US, Europe and China due to the following factors: On-going interest rate hikes by the FED, the ECB and other relevant central banks to control inflation. A slowdown in the Chinese economy due to Covid-19 restrictions and a weak real estate market. The impact of energy prices on consumer’s demand; energy and inflation, as well.
SCCO Copper chart 6-Month (Kitco.com)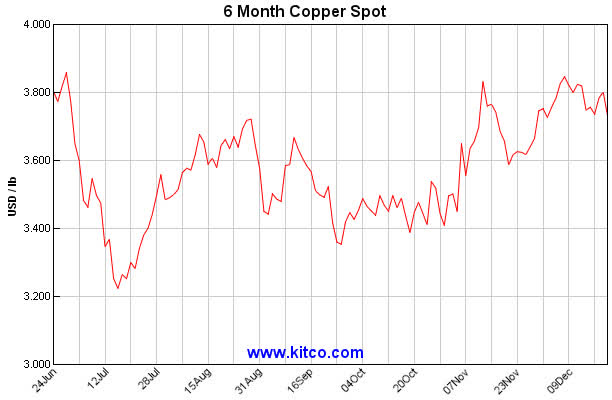
One major issue for Southern Copper is its substantial presence in Peru and, principally, the 54-day disruption it experienced with the Cuajone mine.
Thus, long-term investors should continue accumulating this highly cyclical stock on any significant weakness. But, due to extreme volatility in the copper demand, I recommend short-term trading LIFO. About 30% to 40% should be allocated to this task to minimize the risks of a sudden severe retracement.
Southern Copper – 3Q22 – Balance Sheet and Trend – The Raw Numbers
| Southern Copper | 3Q21 | 4Q21 | 1Q22 | 2Q22 | 3Q22 |
| Total Revenues in $ Million | 2,680.9 | 2,823.7 | 2,763.8 | 2,306.9 | 2,156.9 |
| Net income in $ Million | 867.6 | 832.9 | 784.7 | 432.3 | 519.0 |
| EBITDA $ Million | 1,710.8 | 1,728.5 | 1,683.0 | 1,025.7 | 1,025.7 |
| EPS diluted in $/share | 1.12 | 1.08 | 1.02 | 0.56 | 0.67 |
| Cash from Operations in $ Million | 1,220.6 | 1,227.7 | 820.7 | 309.9 | 590.1 |
| Capital Expenditure in $ Million | 243.1 | 196.8 | 205.2 | 224.6 | 227.9 |
| Free Cash Flow in $ Million | 977.5 | 1,030.9 | 615.5 | 85.3 | 362.2 |
| Total cash $ Million | 3,210.5 | 3,488.9 | 3,253.7 | 2,355.7 | 2,184.8 |
| Total Long-term Debt in $ Million | 6,546.7 | 6,547.6 | 6,548.5 | 6.549.4 | 6,550.3 |
| Dividend $/sh | 1.00 | 1.00 | 1.25 | 0.75 | 0.50 |
| Shares outstanding (diluted) in Million | 773.1 | 773.1 | 773.1 | 773.1 | 773.1 |
Source: Southern Copper release
Note: More data (production) is available for subscribers.
Analysis: Revenues, Free Cash Flow, and Copper/Silver/Molybdenum Production
1 – Revenues were $2,156.9 million for the third quarter of 2022
SCCO Quarterly Revenues history (Fun Trading)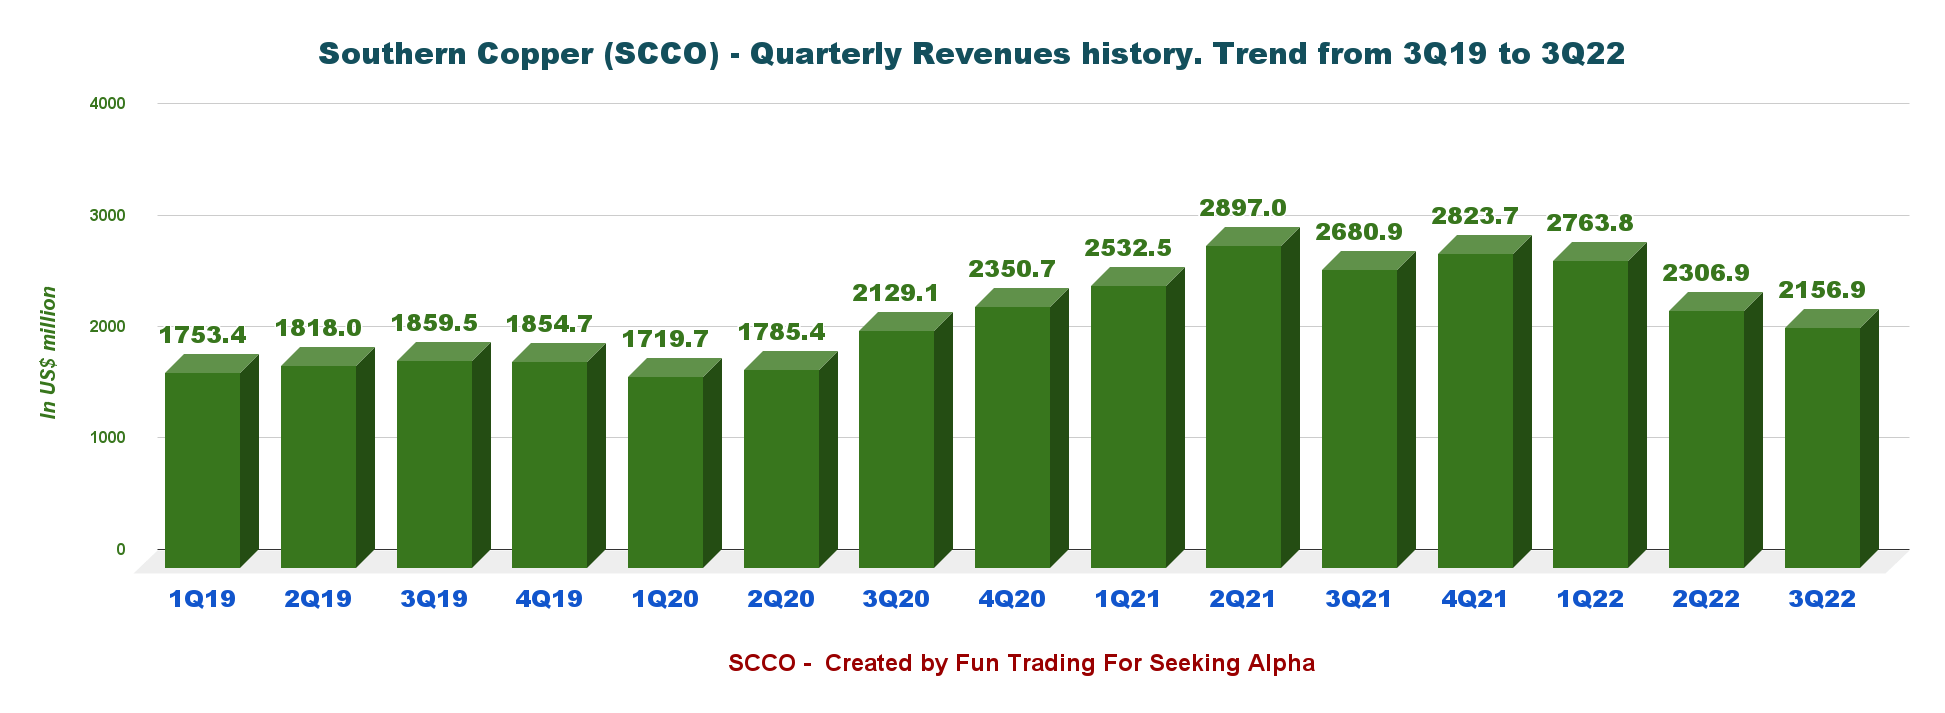
Southern Copper’s earnings per diluted share were $0.67 per share, and revenues were $2.157 billion. The 3Q22 adjusted EBITDA was $1,017.9 million, which represented a decrease of 40.4% from the $1,709.3 million registered in 3Q21.
3Q22 net income was $519.0 million, representing a 40.2% decrease compared to the $867.6 million in 3Q21.
On October 20, 2022, the Board of Directors authorized a dividend of $0.50 per share, down significantly QoQ, representing a dividend yield of 3.3%.
Cash cost (including by-products) was $1.03 per pound in 3Q22.
SCCO Cash cost Presentation (SCCO Presentation November)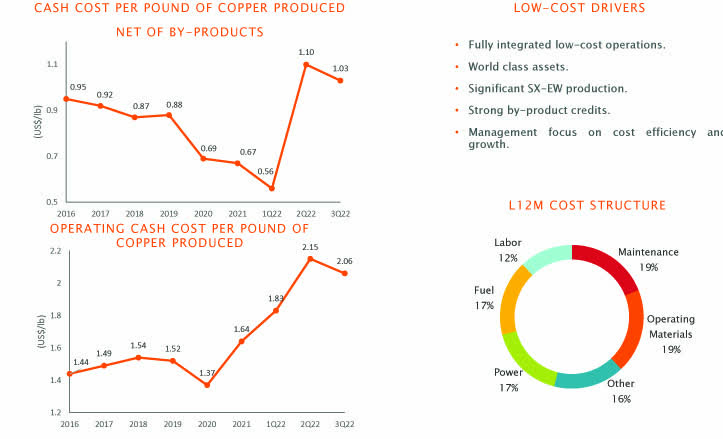
2 – Free cash flow was $362.2 million in the third quarter of 2022
SCCO Quarterly Free cash flow history (Fun Trading)
Note: I calculate the generic free cash flow using the cash from operating activities minus CapEx.
Trailing 12-month free cash flow was $2,093.9 million, with $362.2 million in 3Q22.
3 – Net debt was $4.37 billion on September 30, 2022
SCCO Quarterly Cash versus Debt history (Fun Trading) On September 30, 2022, SCCO had $2.185 billion in consolidated cash and long-term debt of $6.55 billion. The net debt to EBITDA for 2022 is expected to be 0.2x, which is excellent.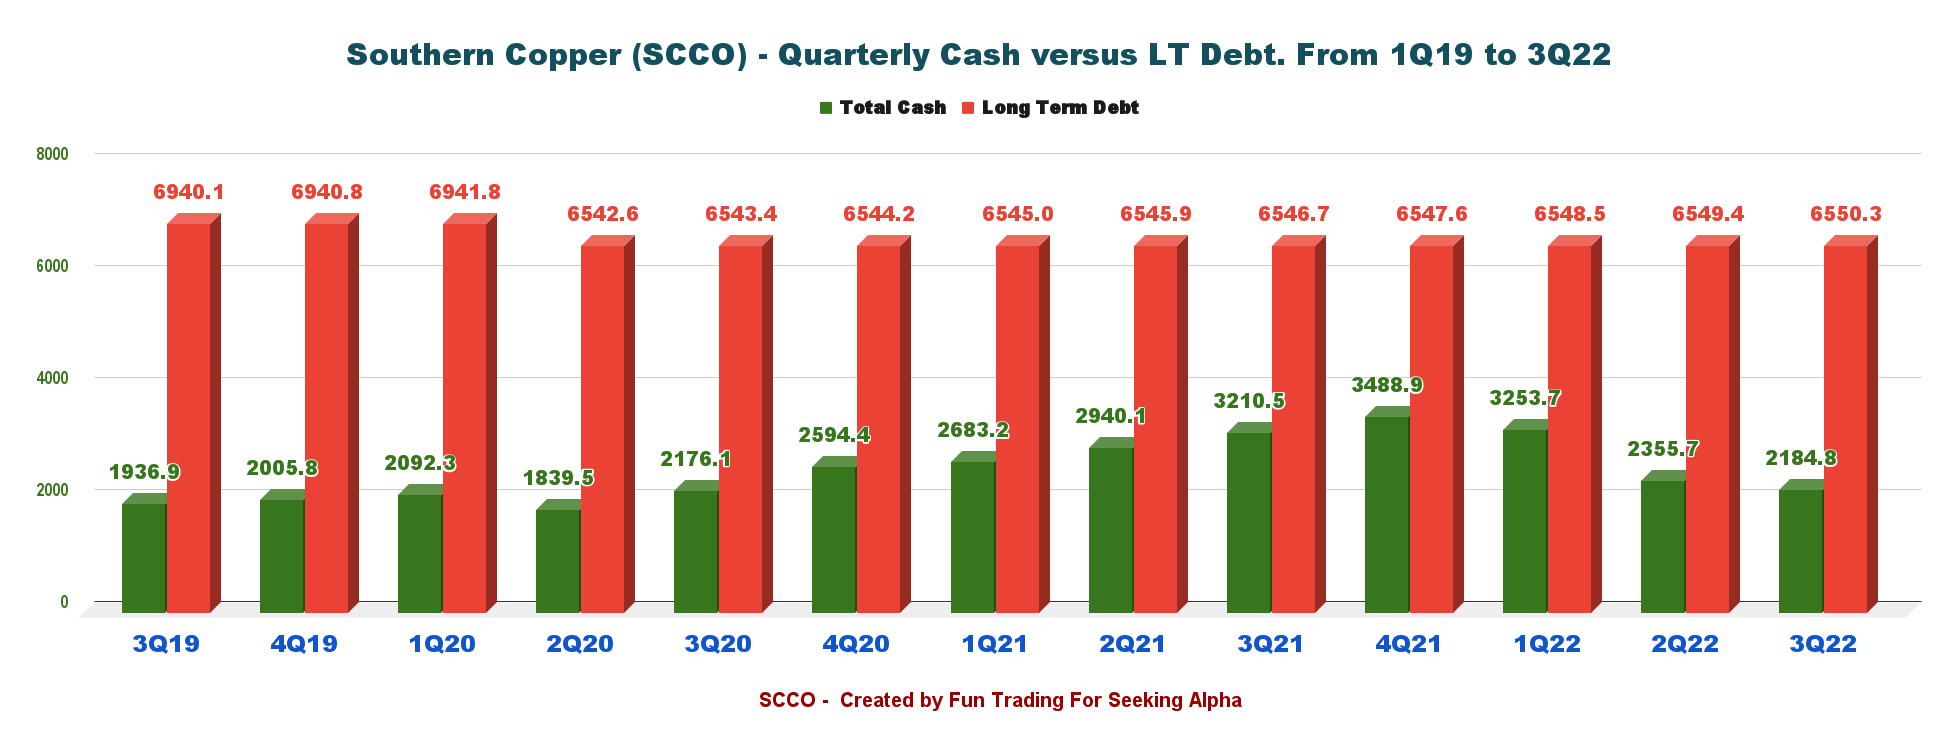
4 – Production analysis – Copper-Cu, Silver-Ag, and Molybdenum-Mo.
Note: The weight in metric tons is equal to 2,204.6 pounds
| Price | 3Q21 | 4Q21 | 1Q22 | 2Q22 | 3Q22 |
| Copper price realized – Cu (Comex) $/Lbs | 4.25 | 4.40 | 4.53 | 4.32 | 3.51 |
| Silver price Realized – Ag $/oz | 24.28 | 23.36 | 24.05 | 22.65 | 19.10 |
| Molybdenum price realized – Mo $/Lbs | 18.43 | 18.53 | 18.99 | 18.30 | 16.00 |
| Zinc price $/Lbs | 1.36 | 1.53 | 1.70 | 1.78 | 1.48 |
| Gold $/oz | 1,789 | 1,795 | 1,874 | 1,872 | 1,728 |
Copper Production for 3Q22 was 508.2 Cu M lbs and 508.7 Cu M lbs, including third party (sold 518.5 M lbs). The copper price was $3.51 per Lb in 3Q22 (see table above).
The decrease in production YoY at the Peruvian operations (-11.8%) and at the La Caridad mine (-11.3%) were due to lower ore grades and recoveries.
SCCO Quarterly Production per metal history (Fun Trading)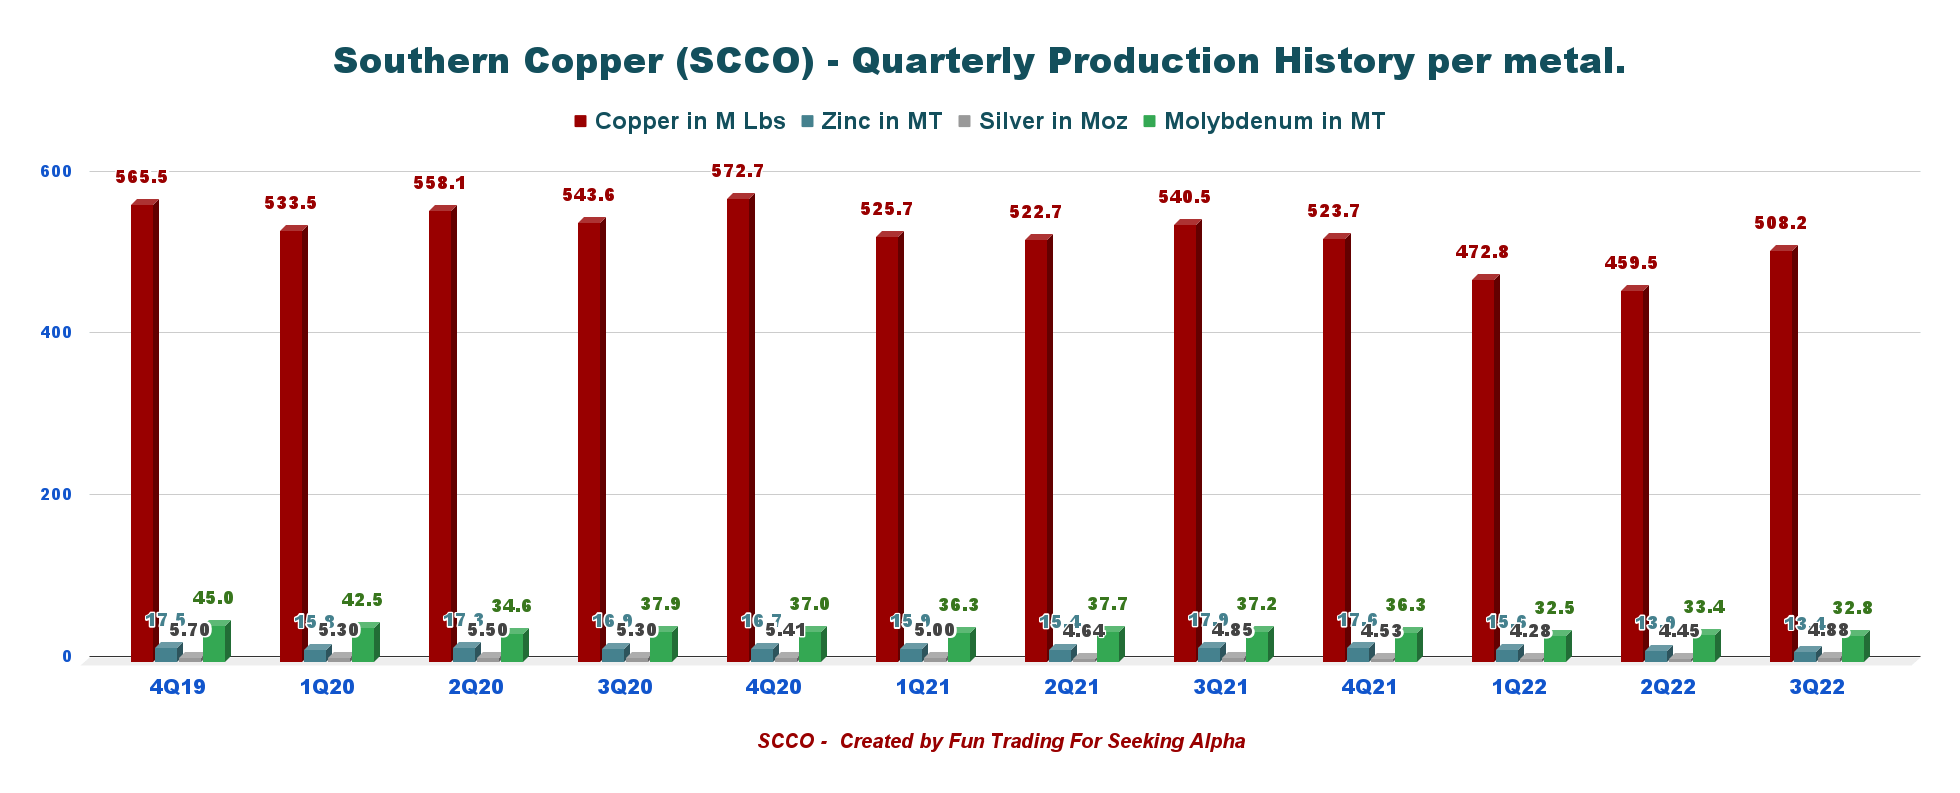
Molybdenum production decreased by 24.8% in 3Q22 compared to 3Q21. Mined zinc production fell 11.9% due to lower production at the Charcas and Santa Barbara units, mainly attributable to decreased processed material and lower zinc grades.
Technical Analysis and Commentary
SCCO TA Chart Short-term (Fun Trading StockCharts)
Note: The chart is adjusted for the dividend.
SCCO forms an ascending triangle pattern with resistance at $62.3 and support at $58.2.
Ascending triangle patterns are bullish. They indicate that the SCCO price will likely climb higher as the Apex pattern approaches.
The overall strategy that I usually promote in my marketplace, “The Gold and Oil Corner,” is to keep a small core long-term position and use about 40%-50% to trade LIFO while waiting for a higher final price target to sell your core position. The task is easier knowing that SCCO pays a quarterly dividend of $0.50 per share.
I recommend selling about 30% of your position LIFO (assuming a profit) at $62.3 with a possible higher resistance at $72 if the copper price turns bullish in 2023, which is not highly probable due to the FED’action pushing the world economy into a brutal recession. Conversely, I recommend buying back and accumulating at or between $58.5 and $55.3, with potential lower support at $53.
Also, it is crucial to closely follow what is happening in Peru, which represents a large part of the SCCO’s revenues.
Warning: The TA chart must be updated frequently to be relevant. It is what I am doing in my stock tracker. The chart above has a possible validity of about a week. Remember, the TA chart is a tool only to help you adopt the right strategy. It is not a way to foresee the future. No one and nothing can.
Author’s note: If you find value in this article and would like to encourage such continued efforts, please click the “Like” button below to vote for support. Thanks.