Don’t Count On Fiscal Stimulus To Solve Our Growth Problem (SP500)
cagkansayin/iStock via Getty Images
From the 1980s on, the government policy to stimulate the economy has been what I have called “credit inflation.”
The foundation of this policy effort has come from the “Phillips Curve,” a statistical relationship between the unemployment rate and the rate of inflation. The takeaway from this statistical relationship is that the government can achieve a lower rate of employment if it can generate a modestly higher rate of inflation.
The effort to pursue such a policy began in the Kennedy administration in the 1960s. President Nixon bought onto the policy and attempted to generate a monetary and fiscal policy aimed at producing modestly higher inflation, thereby obtaining a low rate of unemployment. He saw this as his way to getting re-elected in 1972.
At that time, inflation became more than modest and became the fight of the decade until Paul Volcker took over as the Chairman of the Fed and fought the fight to bring inflation under control.
Credit inflation then became the underlying policy of the government and this continued into the 2000s and the 2010s.
Let’s look at the results of fiscal policy and monetary policy during this time period in the 21st century.
Here is a picture of how the government’s debt grew after 2001. Note that we will not be discussing the period after 2020 until later in the post.
Federal Debt (Federal Reserve)
Here is a picture of the growth of the M2 monetary stock over the same period of time.
M2 Money Stock (Federal Reserve)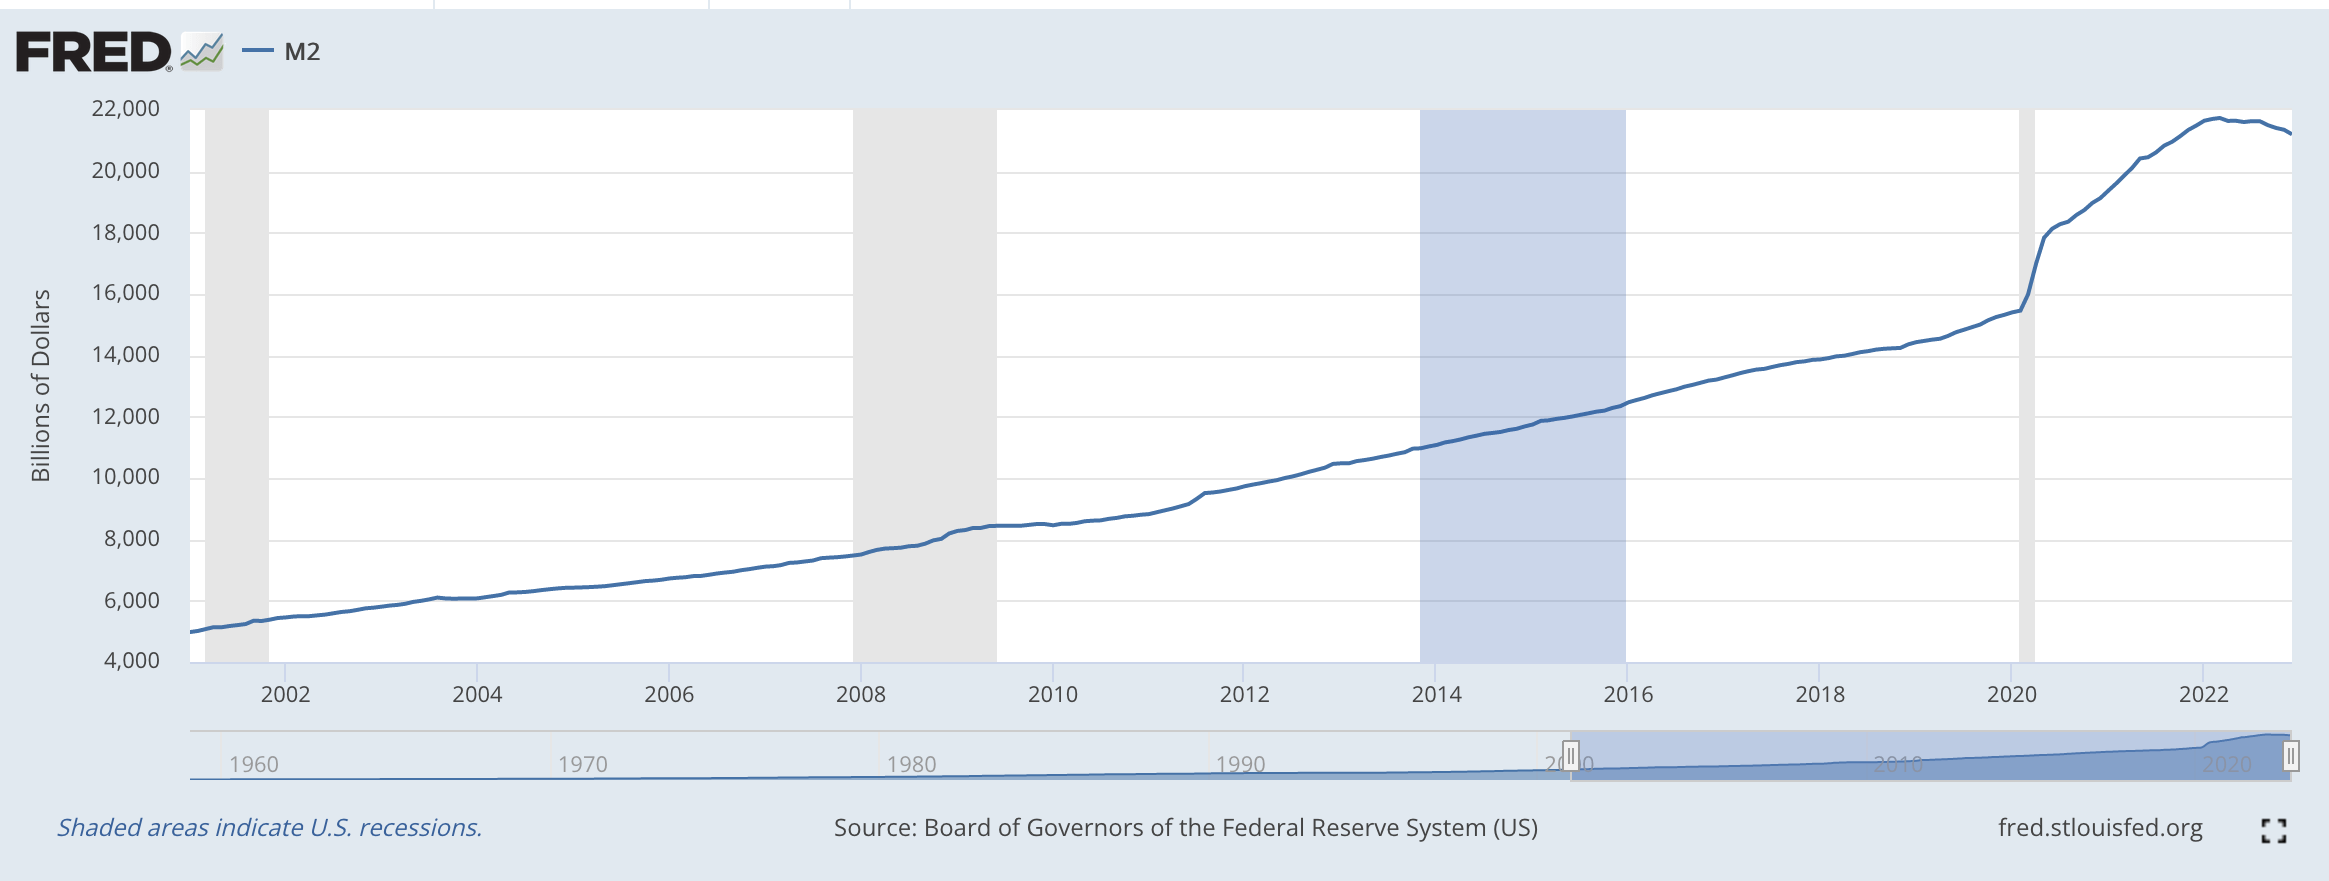
Looks pretty smooth and follows along with the increase in the public debt outstanding…fiscal policy.
This was what the federal government and the federal reserve tried to achieve during this time.
Use Of Money
The question is, where did these monies go?
Well, they didn’t go into the “real” sector of the economy. Take a look at what is called the velocity of circulation of the M2 money stock. It declined throughout this period.
Velocity of M2 Money Stock (Federal Reserve)
From these numbers, it is apparent that all the money stock being created was not going into the “real” economy. What was taking place?
Well, more and more of the stimulus monies were going into the “financial circuit” of the economy and not into the “real” economy.
That is, the growth in the monetary variable was finding its way into stocks, real estate, commodities, and other forms of “assets” and not into real capital expenditures that generated economic growth.
Stock prices rose, housing prices rose, and the price of gold rose among other assets.
Economic growth slowed down during this period even though plenty of stimuli were going into the economy.
The Federal Reserve was stimulating these “price increases” along with modest economic growth. This is the essence of “credit inflation.”
But, what was going on in the “real” sectors of the economy?
Well, I have written about this phenomenon. My latest effort at this was in “It’s the Supply-Side Stupid.”
The stimulus monies were going into rising asset prices and not into real capital expenditures. Hence, the growth of labor productivity went down and even became negative during this period of time.
Growth in Labor Productivity (Federal Reserve)
Note that, except for periods of recession, the growth in labor productivity since 2005 was around 1.0 percent. Also, notice that there were even periods of negative labor productivity growth.
There is one other factor that must be discussed at this point. The labor productivity statistics were constructed to record what was happening in an environment dominated by manufacturing production.
In recent years this has changed.
One area that has grown in relative size in the economy is the financial sector. The whole basis of credit inflation is centered on this area and it has grown tremendously in the past fifty years. Lots and lots of people have gone into the financial sector, but in terms of contribution to economic growth, the change has contributed little or nothing to the growth of labor productivity.
The same applies to education, health care, and to government activities. In terms of the contribution of these areas, very little is added to real economic output, while the numbers of those employed in these areas have grown in a major way.
During the years of “credit inflation,” the economy grew, although at rates that are believed to be historically low, unemployment fell, and consumer price inflation remained modest, somewhere a little over 2.0 percent, the Fed’s target rate of inflation.
So, with the exception of the historically low rates of economic growth, economic policy, “credit inflation,” seemed to work and produce many desirable consequences.
Many did not like the fact that “credit inflation” tended to result in greater inequality in the income/wealth distribution in the country, but, this fact did not deter politicians to focus on this fact as a political issue, because most elected officials were very content to get re-elected over and over and over again.
The Pandemic
The pandemic broke up the ability of the government to continue on with the policy of credit inflation.
As can be seen from the charts above, the fiscal deficits exploded and the public debt outstanding grew by leaps and bounds.
Furthermore, the growth of the M2 money stock jumped way out of control. From May 2020 to March 2022, the M2 money stock increased by 41 percent.
During this same period of time, inflation increased. In March 2020, the inflation rate was 1.5 percent. In April 2021, inflation was up to 4.2 percent. And, in March 2022, it had jumped to 8.5 percent.
The stock market peaked in very early 2021. The S&P 500 Stock Index hit a historical high on January 3, 2021.
In the middle of March 2022, the Federal Reserve began to combat inflation with a policy that has been labeled quantitative tightening. It appears as if the Fed intends to continue this policy through at least 2023.
But, for the time being, the government’s policy of “credit inflation” seems to be over.
The Biden administration seems to be intent upon keeping fiscal policy active, hoping to expand aggregate economic demand in this way.
But, the information provided above seems to argue the fact that the government’s fiscal policy can do very little, at this time, to actually expand aggregate demand. The supply side seems to be in control of the economy.
Furthermore, the year-over-year rate of growth of the M2 money stock has now been negative for the past six months. How will this impact growth?
And, given the trends that have gotten up here in recent years, it seems as if the federal government can achieve very little with more and more policies expanding aggregate demand.
The tip for investors is that the end of “credit inflation” (at least for the time being) will alter the factors impacting the stock market and so the successful investment strategies built up over the past twenty years or so, will need to be revised going forward.