Chord Energy Stock: A Buy On High Oil And Gas Prices (NASDAQ:CHRD)
Evgenii Mitroshin
Due to higher crude oil and natural gas prices in the second quarter of 2022, Chord Energy (NASDAQ:CHRD) revenues have been higher than in 1Q 2022. However, as a result of the winter storm, the company’s production in the Williston Basin decreased significantly in April 2022. In the past few months, CHRD’s production has been increasing and according to the high oil and natural gas prices in the third quarter, I expect the company’s 3Q 2022 financial results to be better than in 2Q 2022. The stock is a buy.
Quarterly Highlights
In its 2Q 2022 financial results, CHRD reported total revenues of $789 million, compared with 2Q 2021 total revenues of $364 million. The company’s oil and gas revenues increased from $255 million in 2Q 2021 to $539 million in 2Q 2022. Also, its purchased oil and gas sales increased from $109 million in 2Q 2021 to $250 million in 2Q 2022. In the second quarter of the year, CHRD’s total operating expenses increased by 75% to $459 million, driven by increased purchased oil and gas sales expenses of $252 million, up 127% YoY. Net income attributable to Chord increased from $73 million, or $3.52 per diluted share in 2Q 2021 to $131 million, or $6.23 per diluted share in 2Q 2022.
In the second quarter of 2022, CHRD produced 3747 MBbls of crude oil compared with 4048 MBbls in 1Q 2022. Also, the company produced 12506 MMcf in 2Q 2022, compared with 13300 MMcfin in 1Q 2022. CHRD’s average daily production decreased from 69606 Moepd in 1Q 2022 to 64079 Moepd in 2Q 2022. The company’s crude oil average realized price (after the effect of derivative settlements) increased from $75.67 per Bbl in 1Q 2022 to $78.71 per Bbl in 2Q 2022. Its natural gas and NGLs average realized price (after the effect of derivative settlements) increased from $7.67 per Mcf in 1Q 2022 to $8.62 per Mcf in 2Q 2022. “In an effort to improve price realizations from the sale of our crude oil, natural gas, and NGLs, we manage our commodities marketing activities in-house, which enables us to market and sell our crude oil, natural gas, and NGLs to a broader array of potential purchasers,” the company announced.
The market outlook
In the third quarter of 2022, CHRD’s crude oil, natural gas, and NGLs revenues increased by $45 million QoQ, driven by a $67 million increase due to higher crude oil realized prices and a $20 million increase due to higher natural gas realized prices, offset by a $41 million decrease driven by lower crude oil and natural gas production. In 2Q 2022, The company’s crude oil volumes purchased and then subsequently sold increased to mitigate the impacts of lower oil production caused by the winter storms in the second quarter of 2022. Figure 1 shows that with 927 thousand net acres and 68% working interest, CHRD is a premier Williston Basin company. Figure 2 shows that the Williston Basin oil production dropped in April due to the winter storm. However, Williston Basin oil production in June increased to its levels in the first quarter of 2022. According to Figure 3, ND’s monthly Bakken oil production dropped in April 2022; however, the production level in July and August 2022 increased.
Figure 1 – Chord’s footprint in the Williston basin
2Q 2022 presentation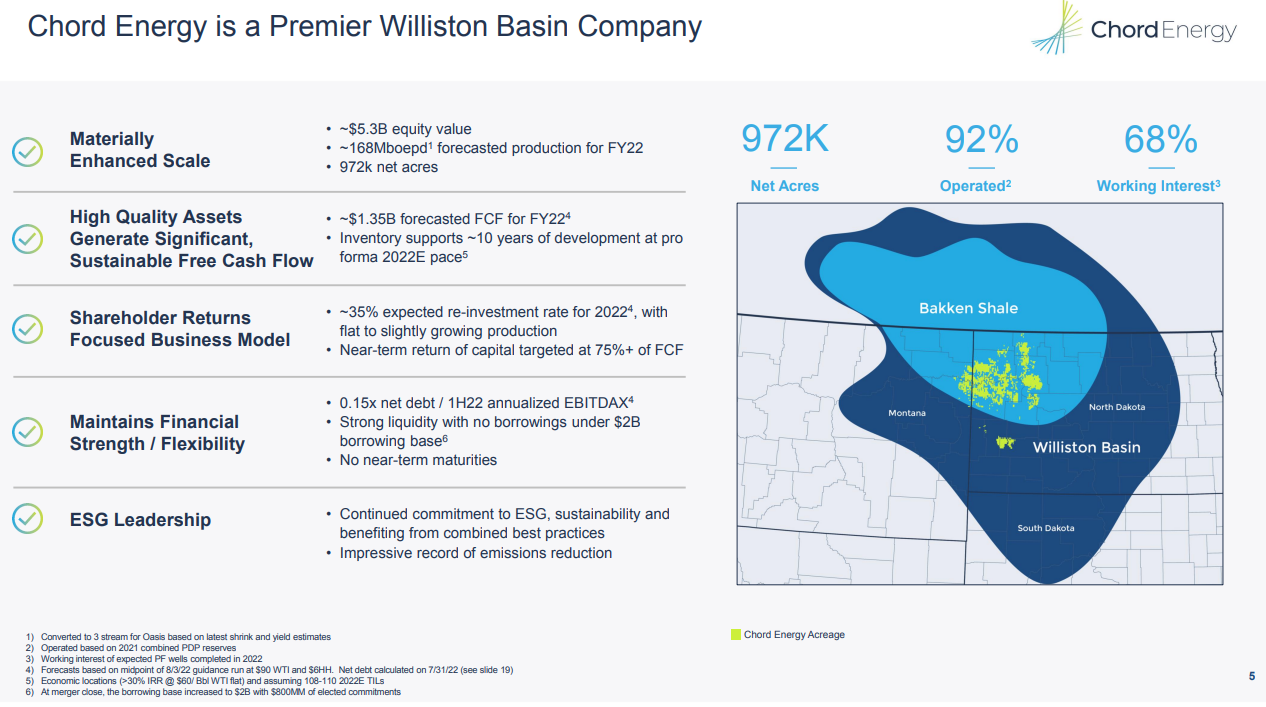
Figure 2 – US Williston Basin oil production
northdakotapipelines.com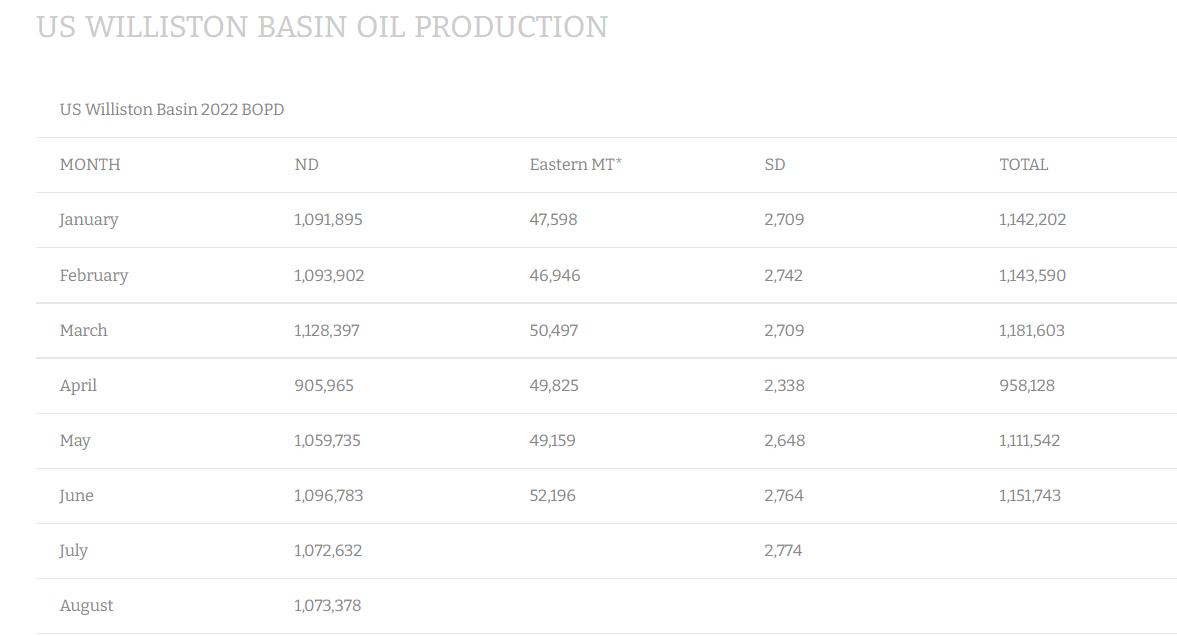
Figure 3 – ND’s monthly Bakken oil production statistics
www.dmr.nd.gov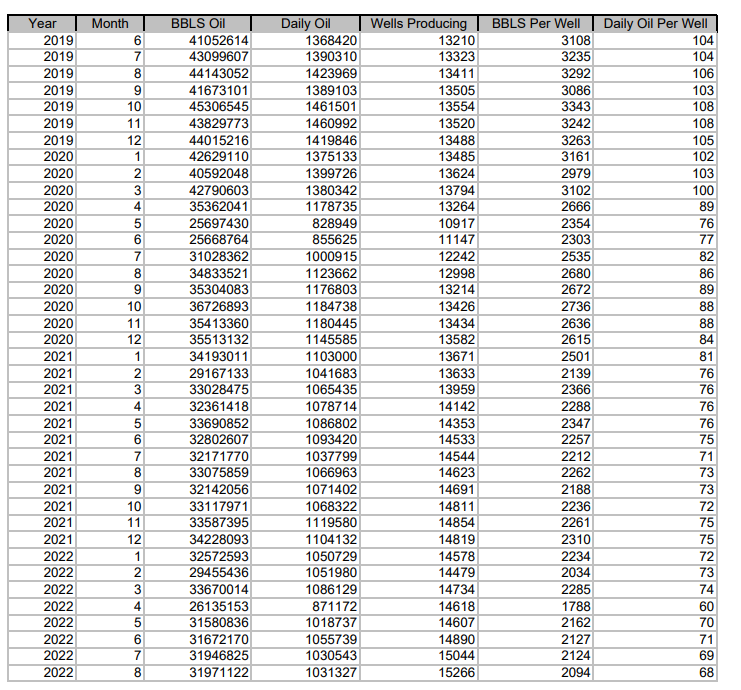
Moreover, EIA expects oil production in the Bakken region to increase by 21 thousand barrels per day month over month in September. Also, EIA expects gas production in the Bakken region to increase by 32 million cubic feet per day month over month in September (see Figure 4). Furthermore, due to higher household energy consumption as a result of colder temperatures, OPEC+ production cut, the continuing war in Ukraine, and continuing sanctions on Iranian oil and gas, crude oil and natural gas prices will remain high for the rest of 2022. EIA expects Brent Crude Oil spot price averages $93 per barrel in 4Q 2022 and $95 per barrel in 2023. Also, EIA forecasts Henry Hub’s natural gas spot price to average $7.40 per MMBtu in 4Q 2022 and then fall below $6.00 per MMBtus in 2023 as U.S. natural gas production rises. Figure 5 shows that crude oil prices in the United States in 3Q 2022 were lower than in 2Q 2022 and are expected to decrease further in 4Q 2022. On the other hand, natural gas prices in the United States in 3Q 2022 were higher than in 2Q 202. U.S. natural gas prices in 4Q 2022 are expected to be close to their levels in 2Q 2022.
Thus, considering oil and natural gas production levels and prices, I expect Chord’s 3Q 2022 financial results to be better than in 2Q 2022 and the company’s 4Q 2022 financial result to be weaker than in 3Q 2022.
Figure 4 – Oil and gas production in the Bakken region
eia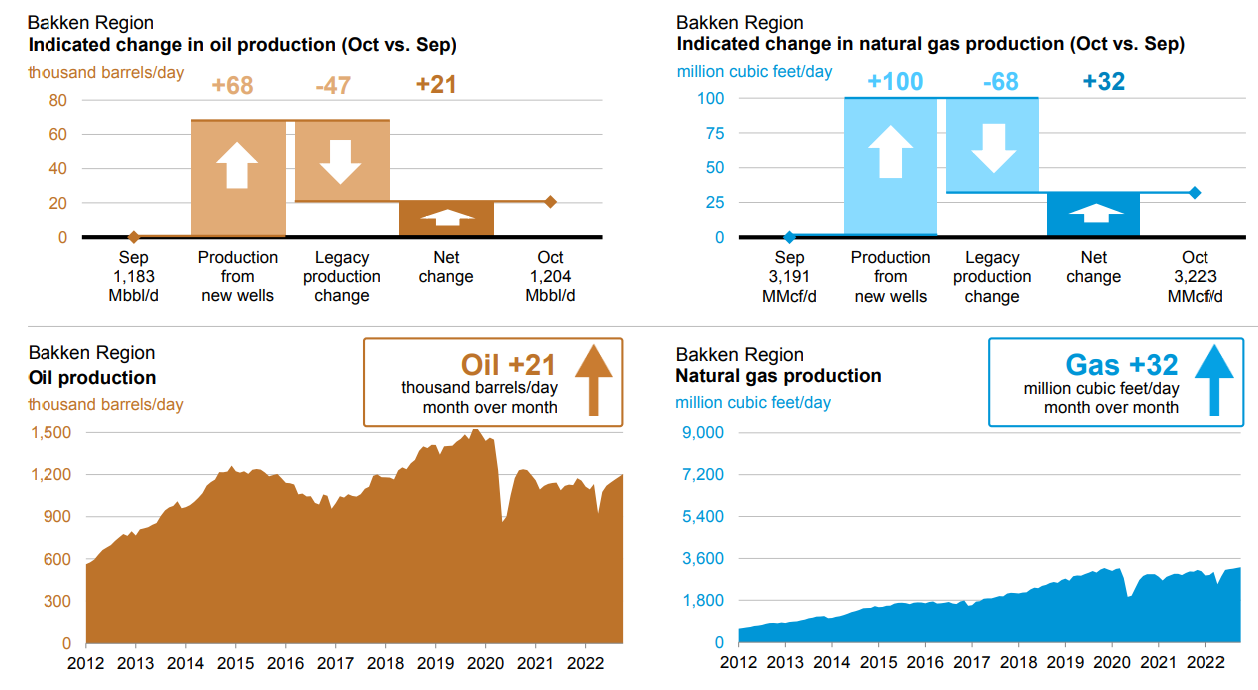
Figure 5 – Energy pieces in the United States
eia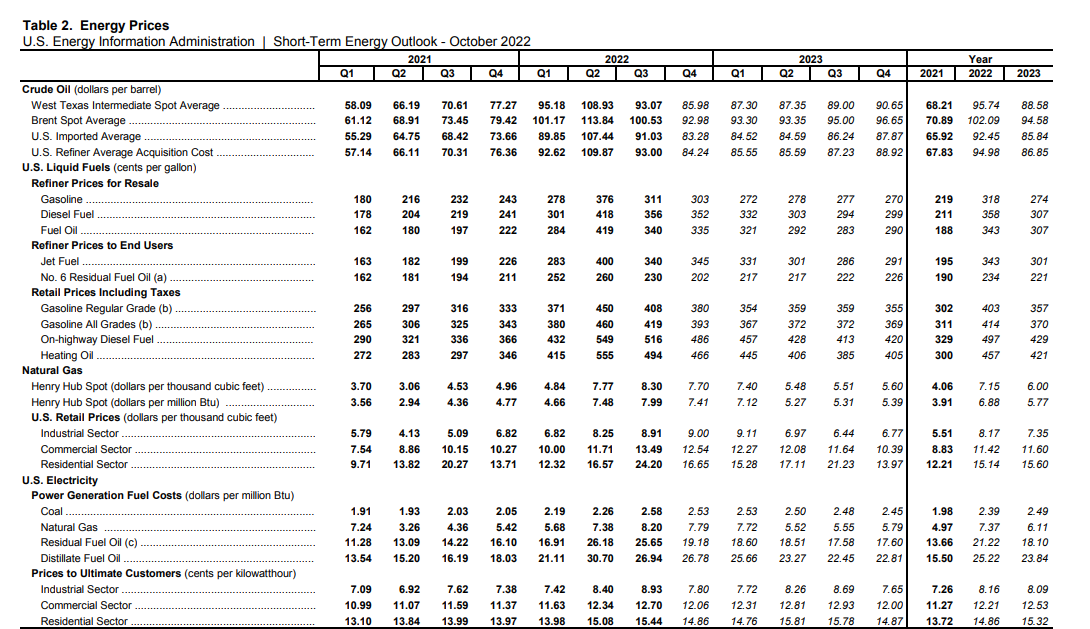
Chord Energy performance outlook
In this detailed analysis, I have done some analysis on Chord Energy’s profitability ratios to evaluate the company’s abilities to bring income and utilize its assets to generate profit for its shareholders. To cater beneficial insights into the financial position of the company, I have analyzed the profitability ratios across the board of margin and return ratios. To be more insightful, I have calculated these ratios compared to previous years.
Generally, margin ratios capture the capability of the company to convert sales into profits in different measurements. In this regard, I would investigate Chord Energy Corporation’s gross profit, EBITDA, and cash flow margin conditions and compare them with previous years. Chord’s gross profit margin has been on an improvement path during a recent couple of years and currently has sat at 0.75 in TTM. Its current gross margin has increased slightly to 0.75 versus its level of 0.74 at the end of 2021. It also increased by 36% compared with the end of 2020. Additionally, the cash flow margin indicates the relation between operating cash flow and the company’s total revenue. It is obvious that CHRD has been able to convert its revenue to cash after the downturn of 2020. Its cash flow margin was boosted by 77% to 0.48 at the end of 2021 versus its amount of only 0.27 in 2020. Notwithstanding a slight decline to 0.45 in TTM, its cash flow margin is in a solid condition and shows that the management is able to balance its cash flow. As a result, not only can they minimize expenses, but also take advantage of upcoming growth opportunities.
On the other hand, an 18% decline in EBITDA in TTM relative to its amount in 2021 has led to a decline in the EBITDA margin. The EBITDA margin sat at 0.26 in TTM from 0.36 at the end of 2021. The benefit of investigating the EBITDA margin is that it excludes volatile expenses and thus is a good measurement to represent a clear picture of the performance. In short, Chord Energy Corporation’s margin ratios indicate the company’s scope of capability to convert its revenues into profits (see Figure 6).
Figure 6- CHRD’s margin ratios
Author (based on SA data)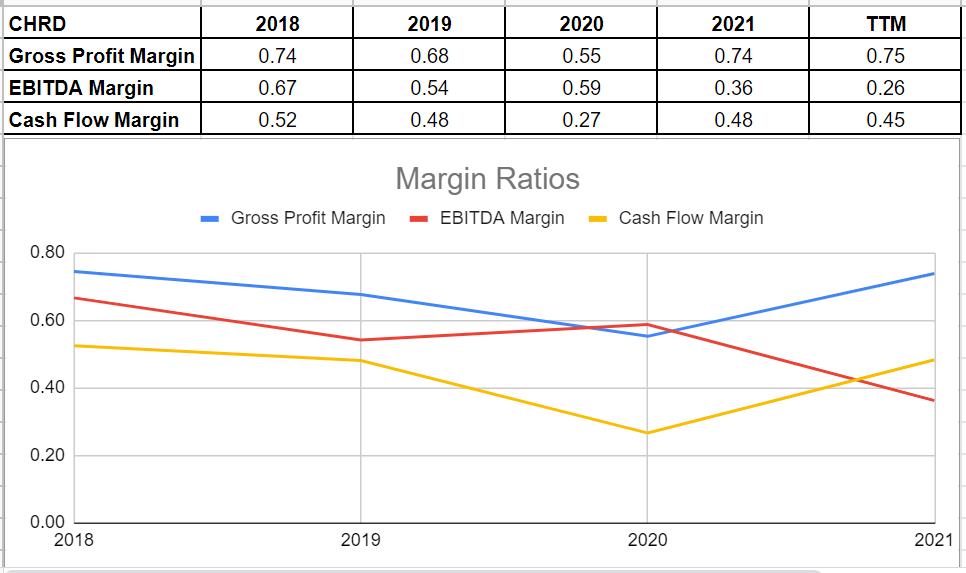
To represent Chord Energy’s ability to cater returns to its shareholders, I have investigated its return on assets and return on equity ratios. The return on assets ratio reflects how much profit a company is able to generate for every dollar of its assets. Chord’s ROA ratio has paved the recovery path successfully since the end of 2020. The company’s ROA improved amazingly to more than 17% at the end of 2021. Albeit with a slight decline to 14%, I believe its financial conditions will develop more for the rest of 2022.
Similarly, its return on equity boosted and sat at 25.72% and 24.22% in 2021 and 2022, respectively, after a couple of years of negative amounts. This ratio indicates the net income of the company, which is relative to the shareholders’ equity. The return on equity ratio is crucial as it measures the rate of return on the money that has been invested into the company. Thus, Chord Energy’s increasing return on equity shows its capability of generating cash and, thereby, less dependency on debt financing (see Figure 7).
Figure 7 – CHRD’s return ratios
Author (based on SA data)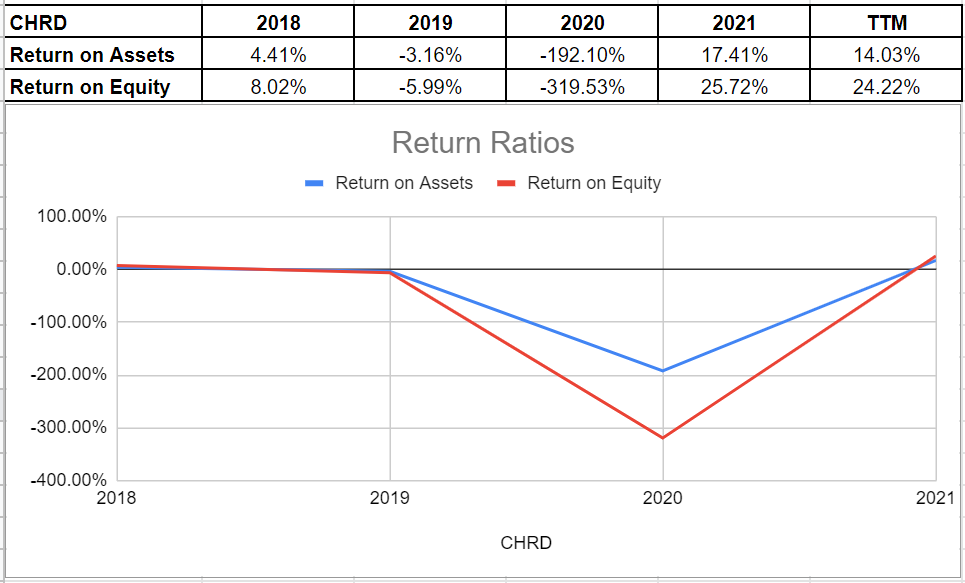
Risks
Oil and gas prices are high due to the war in Ukraine, which started sanctions on Russian oil. Now, there is no sign of the war ending in Ukraine. However, if the tensions between Russia and Ukraine decrease, oil prices will drop. Also, sanction on Iranian oil is another reason that supports oil prices. Thus, keep an eye on the nuclear talks between Western countries and Iran. Finally, countries around the world are trying to escape the recession by implementing broad fiscal and monetary policies. However, if the global recession deepens, the demand for oil will decrease, resulting in an oil price decline. In a nutshell, lower oil and gas prices will hurt CHRD’s profitability.
Conclusion
In summary, in spite of the existing volatility of the oil and gas industry, analyzing companies’ financial conditions is a good help to control existing risks in this industry. In other words, investigating Chord Energy Corporation’s solid financial position and profitability ratios indicates that the company has started its recovery path after the intense downturn of 2020. Thus, I believe a Buy rating is appropriate for CHRD stock.