Chartwell Retirement Residences: A High Income Turnaround Play
supersizer/E+ via Getty Images
Chartwell Retirement Residences (CWSRF, TSX:CSH.UN:CA) seems to have been forgotten by the investing community as the last Seeking Alpha coverage on it was in late August 2020.
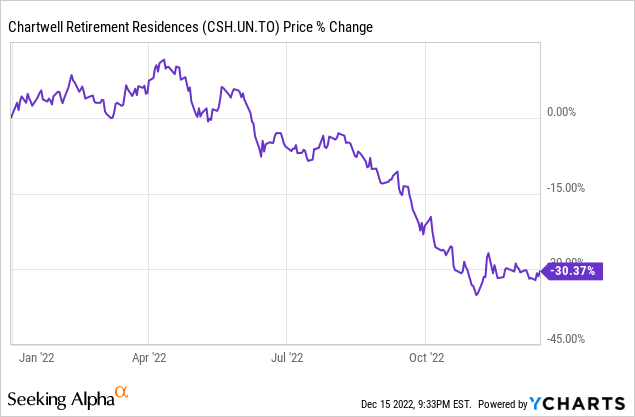
It’s understandable. The stock is down about 25% since then.
What’s Weighing on the Stock?
The COVID-19 pandemic has negatively impacted the retirement residence business, resulting in lower occupancy. High inflation, rising interest rates, and labor shortage are also factors weighing on the stock.
Lower Occupancy
Our revenue and operating results depend significantly on the occupancy levels at our retirement residences. During the ongoing pandemic, numerous restrictions and directives to reduce the spread of COVID-19 have been implemented by governments and health authorities that affected and continue to affect many aspects of our operations. (Source: Q3 MD&A).
Chartwell’s YTD occupancy rate for its retirement operations was 77.2%, which is way below its normalized levels of north of 90%.
(The company reports in Canadian dollars, so the figures in this article are in CAD$ unless otherwise noted.)
Higher Interest Rates
Pretty much any stocks with a substantial amount of mortgages on their balance sheets have been sold off as interest rates have risen and the cost of borrowing has increased.
At the end of Q3, Chartwell’s weighted average interest rate for its continuing operations was 3.59%, which appears manageable. However, it has debt maturities of $427 million in 2023 – about 53% in mortgages and 47% in debentures.
Chartwell Q3 MD&A
Chartwell’s debt-to-equity ratio increased from 2.46x at the end of 2021 to 2.92x at the end of Q3 2022, which suggests a riskier capital structure.
Chartwell is exiting its long-term care operations in Ontario by the end of the year. And it’s planning to use the net proceeds of about $202.9 million to pay down debt.
Notably, Chartwell generally has access to low-cost mortgage financing insured by Canada Mortgage and Housing Corporation (“CMHC”), a state-owned mortgage insurer. As of the end of Q3, about 87% of Chartwell’s mortgage debt for its continuing operations was CMHC-insured.
As the table below shows, Chartwell’s mortgage debt portfolio has little exposure to variable interest rates (<2% of the portfolio). For reference, it recently had new mortgage financings that included 3 CMHC-insured mortgages totaling $143.3 million that had a weighted average interest rate of 4.14% and a weighted average term to maturity of 8 years.
Chartwell Q3 MD&A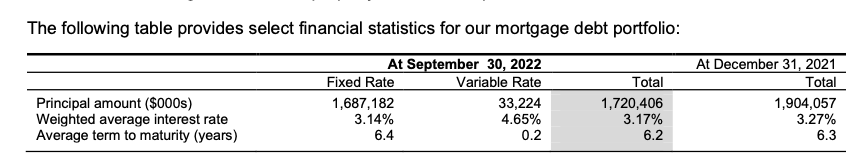
In summary, Chartwell primarily finances its operations through long-term fixed-rate mortgage debt with the 10-year CMHC-insured mortgage rates estimated at about 4.5% and the 5-year conventional mortgage financing available at about 5.65%.
High Inflation & Staff Shortage
The ongoing pandemic caused the staff shortage issue, which has affected occupancy in addition to potential pandemic restrictions to reduce the spread of COVID-19.
We believe that continuous pandemic related higher staff and management turnover and the resulting reliance on agency staff impacted our resident experience in 2022 resulting in lower resident satisfaction scores compared to pre-pandemic levels. We believe our numerous recruitment, retention, agency management and customer experience strategies will result in enhanced resident experiences in 2023 and beyond. (Source: Q3 MD&A)
Chartwell’s YTD adjusted direct property operating expense rose 9% to $569.3 million, which was higher than the 6% increase to $764.9 million in its adjusted resident revenue. Its adjusted NOI is also down 2% to $195.6 million in the period.
Chartwell Q3 MD&A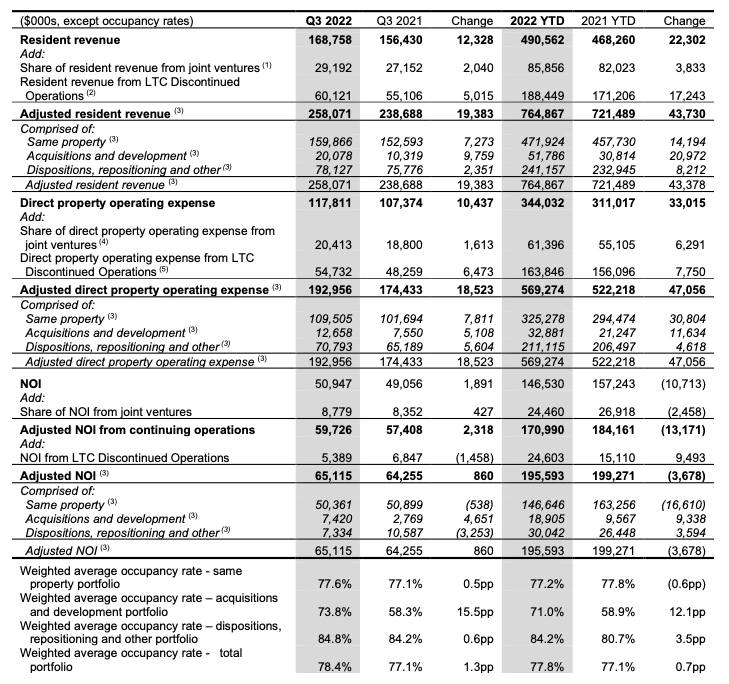
The Turnaround Potential
On an improvement in Chartwell’s occupancy over the next three years, the stock could make a comeback. Meanwhile, it pays a good yield on its monthly cash distributions.
As of September 30, 2022, our acquisitions and development portfolio included 15 acquired and recently developed retirement residences with an aggregate gross book value of $749.4 million. These residences had a weighted average occupancy of 73.8% in Q3 2022 and generated adjusted NOI of $7.7 million in Q3 2022, $19.6 million in 2022 YTD and $23 million for the rolling 12 months ended September 30, 2022. If we achieve the expected stabilized average occupancy of 95%, these residences are estimated to generate annualized adjusted NOI of $52.2 million at our share of ownership. (Source: Q3 MD&A, emphasis added.)
Management is saying there’s an opportunity to increase the adjusted NOI (versus the rolling 12-month period) by about 127% for its relatively new properties. This could be a tad too optimistic, as the normalized occupancy levels before the pandemic were just over 90%. So, it’d be more conservative to say a potential double to an adjusted NOI of roughly $46 million.
Chartwell Q3 MD&A
The Cash Distribution is not Foolproof
Chartwell yields just under 7.5%. However, there’s a chance it could reduce its payout if its operations remain depressed for an extended period of time, say, through 2023. Its payout ratio is a little stretched right now. However, any improvement in its occupancy rate on good execution and/or an improved operating environment could swiftly lift this red flag.
F.A.S.T. Graphs
It also has the liquidity to help protect the cash distribution. As of November 9, Chartwell had liquidity of $182.4 million, including $24.9 million of cash & cash equivalents and $157.5 million of available borrowing capacity on its credit facilities, while its annualized dividend payments total about $108 million.
The Investor Takeaway
After a substantial correction in Chartwell stock, it now provides a margin of safety of about 27% and a high yield of just below 7.5%. According to the analyst consensus 12-month price target of $11.33, the stock can appreciate almost 38% over the next 12 months.
Yahoo Finance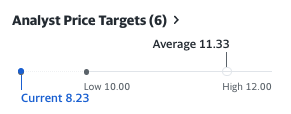
To be more conservative, investors should have an investment horizon of at least 3 years for the potential turnaround investment. Assuming the stock returned to the normalized levels over 3 years, Chartwell Retirement Residences stock can deliver total returns of about 16-20% per year.