A Systematic Approach To Long-Term Investing
Nuthawut Somsuk/iStock via Getty Images
By Jeff Shen, PhD, Travis Cooke, CFA, and Rich Mathieson
In recent decades, the macroeconomic and market backdrop created a favorable environment for investors. Now, we’ve entered a new regime where the challenge of planning and saving for long-term goals like retirement has become increasingly complex.
What originally appeared to be a pandemic-driven and supply constrained price surge has turned into more than two years of persistent inflation and widespread macroeconomic uncertainty. This has brought an end to the era of the Great Moderation, a period of steady growth and muted inflation that lasted for nearly forty years and supported relatively consistent asset price returns (Figure 1). Now, those forces have reversed, and investors are faced with market conditions that are substantially more volatile and uncertain.
Figure 1: The end of the Great Moderation
Volatility of U.S. GDP and CPI, 1965-2022
Source: BlackRock Investment Institute, US Bureau of Economic Analysis and Labor Department, with data from Haver analytics, July 2022. The chart shows the standard deviation of the annualized quarterly change of U.S. GDP and the Consumer Price Index. Standard deviation is a statistic that measures the dispersion of a dataset relative to its mean.
Past inflationary periods including the mid-1960s to 1980s demonstrate the long-lasting effects of inflation uncertainty which can be challenging for policymakers to reverse and costly for economic growth. As we look ahead, long-term structural economic forces like aging populations, deglobalization, and the multi-decade transition to a low-carbon economy may contribute to inflation remaining above pre-pandemic levels even after the current bout of price pressures is controlled. This new regime of macroeconomic uncertainty and volatility could have profound investment implications for years to come.
The inflation vs. accumulation challenge
As investors plan for long-term goals like retirement, inflation uncertainty can diminish both the ability to save today and the value of those savings tomorrow. Accumulating savings becomes more difficult as everyday expenses and the overall cost of living increases. Investors may be less likely to maximize retirement account contributions and more hesitant to take advantage of auto-escalation features that are designed to improve investment outcomes by automatically increasing contribution rates over time. In BlackRock’s 2022 Read on Retirement survey, 87% of workers reported that they’re worried about the impact of inflation on their ability to save for the future. Only 34% of those workers worried about inflation have been able to increase their savings rate amid higher living costs.
Along with higher living costs, the effects of inflation impact the broader macroeconomic and market backdrop. Inflation uncertainty translates to policy uncertainty, which can lead to persistently higher asset price volatility. Over the course of the last year, it has become clear that the priority of central banks is to restore price stability—even if it comes at the cost of economic growth. During past periods of low inflation, economic growth downturns typically led central banks to intervene and ease financial conditions, providing a backstop for financial markets. This dynamic has made prolonged equity market corrections less frequent in recent decades. Over the last year, we’ve seen how policy priorities shift in a world of inflation. As central banks focus on reining in inflation, the resulting economic growth concerns have put downward pressure on financial markets that is likely to continue. This type of environment may require a more nimble and dynamic approach to return generation than what was needed in recent years.
Mind the savings gap
For the past decade, holding investments that mirror broad market indices may have worked well for investors from an absolute and risk-adjusted return perspective. The S&P 500 Index produced 13.9% returns on the back of 13.5% volatility annually from 2010 to 2020—which translates to a Sharpe ratio of over 1.0.1 This “rising tide lifts all boats” environment led many long-term investors to prioritize tracking error2 and cost, motivating a strong preference for indexed investment solutions. Now, the expectation for lower returns and higher volatility may be accelerating the savings gap. This creates a growing need to complement index solutions with strategies that seek to deliver returns in excess of market indices, or alpha.
We’ve found that even a modest incremental increase in investment returns can significantly impact long horizon investment outcomes. Let’s consider an individual saving for retirement who contributes 9% of their annual salary into a 60/40 portfolio over the course of their career. Figure 2 illustrates the compounding effect that consistent incremental alpha can have on these long-term savings. An extra 25-50 bps of annual alpha up until the age of retirement may cover an additional ~2-5 years of living expenses vs. baseline return expectations.
Figure 2: Incremental improvements in alpha may impact long-term investment goals
Hypothetical total account balances with baseline, +25 bps and +50 bps of alpha
Past performance does not guarantee or indicate future results. Index performance is for illustrative purposes only. You cannot invest directly in the index. (Source: BlackRock, as of May 2023. Baseline portfolio returns are based on 20-year annualized returns of the S&P 500 TR Index and the Bloomberg U.S. Agg Bond TR Index from 1/1/2003 – 12/31/2022. The baseline portfolio allocation is 60% equities (S&P 500 TR Index) and 40% bonds (Bloomberg U.S. Agg Bond TR Index) until retirement. In retirement, the baseline allocation changes to 20% equities and 80% bonds, assuming that the investor shifts to a more conservative asset allocation. Other assumptions for the scenario include an investor with a starting salary of $30,000 that grows at an annual rate of 3%. Retirement account contributions are 9% of the investor’s annual salary. Starting at age 66, the investor begins to withdraw 50% of their ending annual salary and the withdrawal rate increases 3% annually.)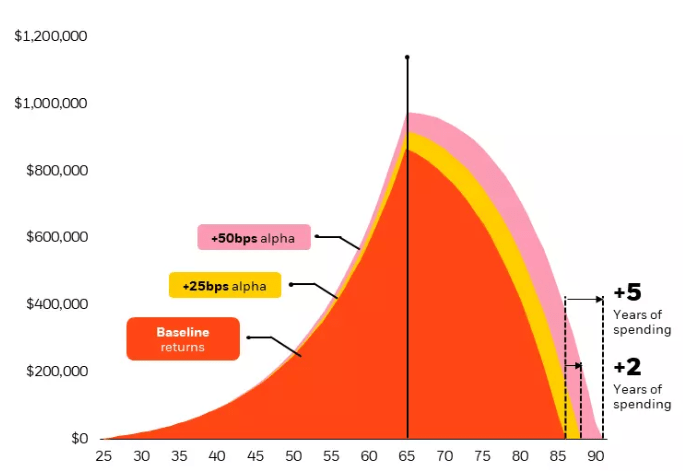
In an environment of increasing living costs and elevated volatility, return generation becomes a more important consideration for investors. Relying exclusively on market beta from index strategies may no longer be sufficient to reach investors’ goals. But at the same time, many active alpha-seeking strategies lack characteristics that are key to generating consistent long-term results—like low-cost, risk-controlled exposure targeting specific outcomes. Systematic investing aims to solve for this challenge by taking a rules-based approach to active management.
A rules-based system for active management
Alpha-seeking strategies strive to outperform broad market returns by identifying and exploiting market inefficiencies. This is often done through a discretionary approach where managers take a qualitative view to analyze the fundamentals of a group of companies. By comparison, systematic managers focus on identifying the same performance indicators, but leverage advancements in information and technology to bring efficiency, scale, and consistency to the active management process.
Efficiency: Investment experts utilize data to uncover insights faster and with more granularity than traditional methods. This allows for a nimble approach to security selection.
Scale: Technology enables the continuous analysis of securities across the full breadth of the market, beyond what fund analysts may be capable of manually researching.
Consistency: Systematic processes bring a disciplined approach to active management, avoiding unintended biases that can arise when relying exclusively on manager conviction.
Beyond identifying alpha opportunities, these insights are implemented in portfolios through a process that explicitly balances return considerations with risk and cost tradeoffs. This helps identify and limit unintended style bets or concentration risks that can surface when positions are determined based on bottom-up discretionary analysis alone. Systematic processes help to quantify and manage underlying risks, targeting consistency and style purity across strategies.
Finally, detailed portfolio analysis provides a continuous feedback loop to ensure that the targeted portfolio outcomes are being met with precision. As a result, investors are able to align their allocations to the risk, return, and cost parameters that reflect their investment goals. Systematic strategies balance the benefits of index investing demonstrated over the last decade with the enhanced return potential that’s needed for a new regime—providing core portfolio building blocks with controlled risks, costs, and the potential for consistent incremental alpha.
Investment solutions that are different by design
Systematic investing is the foundation of Systematic Active Equity’s Advantage Series platform—a series of modular solutions that can be used as building blocks or complementary exposures in a diversified portfolio.
As we navigate a more challenging investment regime, the Advantage Series strategies bring a differentiated approach to long-term investing (Figure 3). Investors seeking consistent alpha can access high quality investment solutions that are unique from what is accessible with discretionary active or market-cap weighted index strategies. A risk-controlled and diversified investment approach means that exposure to concentrated bets or unintentional risks is minimized. And lastly, the cost-efficiency of systematic solutions means that investors pay similar fees to market index strategies, but with the potential for better portfolio outcomes.
Figure 3: Systematic Active Equity takes a rules-based approach to active investing
Performance, cost, and risk characteristics of Advantage Series mutual funds
Source: BlackRock, with data from Morningstar, as of March 31, 2023. Based on performance since management team inception: Advantage Large Cap Core Fund (7/1/17); Advantage Large Cap Growth Fund (7/1/17); Advantage Small Cap Growth Fund (5/1/13); Advantage Emerging Markets Fund (7/1/17); Advantage SMID Cap Fund (3/1/21); Advantage Large Cap Value Fund (7/1/17); Advantage Small Cap Core Fund (4/1/13); Advantage International Fund (7/1/17); Advantage Global Fund (11/1/17); Sustainable Advantage Large Cap Core Fund (11/1/2015). 90% performance statistic based on $5.6B out of $6.3B AUM of institutional share classes of the funds. Cost metrics are based only on institutional shares of Advantage funds vs. institutional shares of funds within their respective Morningstar categories. Expenses are based on the funds’ most recent prospectus net expense ratios. Includes active open-end equity mutual funds only and excludes index funds. Institutional shares may not be available to all retail investors. Fees for different share classes may vary.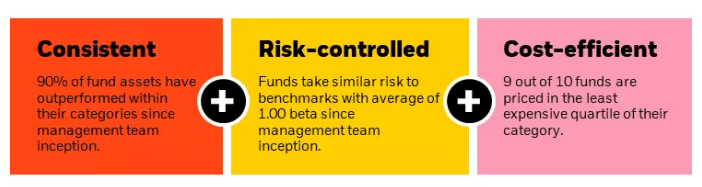
Conclusion
The new macroeconomic environment presents significant challenges to investors. Inflation has become an enduring risk that limits the potential for individuals to save and is contributing to heightened market volatility. The need for incremental alpha in portfolios is more apparent than it has been in decades. Systematic strategies are uniquely positioned to balance consistent return generation with risk and cost considerations that are crucial for long-term investing. By combining human expertise with data-driven insights and cutting-edge technology, systematic investing is uniquely positioned to navigate a wide range of market conditions—including today’s more volatile macro and market regime.
Footnotes:
1Bloomberg, based on total returns, from January 1, 2010 to December 31, 2020. The Sharpe ratio is a measure of risk-adjusted return. It describes how much excess return you receive for the volatility of holding a riskier asset.
2Tracking error is a measure of financial performance that determines the difference between the return fluctuations of an investment portfolio and the return fluctuations of a chosen benchmark.
This post originally appeared on the iShares Market Insights.