A High ‘Put To Calls’ Ratio In Apple Stock Is Encouraging To Bulls

Pgiam/iStock via Getty Images
A few weeks ago, the CBOE “puts to calls” ratio went to its highest level in 20 years, even above the levels reached during the 2007-2008 financial crisis. This produced a strong “buy” signal, which we explained in these recent articles (Puts and Calls Articles). If you’re unfamiliar with the “puts to calls” ratio, you should read these articles first.
Essentially, the “puts to calls” ratio is a powerful contrary opinion indicator. When investors purchase large numbers of put options, it signals a bearish attitude in their market expectations. Historically, this signals very positive moments for stocks. The data to do these calculations is provided by the CBOE.
Two ways to measure the “puts to calls” ratio.
The normal way to form the “puts to call” ratio is to divide the number of put contracts purchased by the number of call contracts. This generally works very well for the overall stock market. However, when it comes to individual stocks and ETFs, sometimes we get better results using a second method. The second method compares the amount of money going into puts versus calls.
The standard ratio doesn’t compare money; it’s just the ratio of the number of contracts purchased. Suppose, however, that put options are three times more expensive than call options. A ratio of contracts might be one to one, but the ratio of money would be 3 to 1. So, the second method divides the amount of money going into put options by the amount going into calls. This ratio is called the ratio of “premiums” and this article will show you current ratios using both methods for both Apple stock and the entire technology sector.
Large amount of “put buying” in Apple stock
There has been a large amount of “put buying” in Apple stock. This reflects the general bearish attitude towards this once hot sector. In a contrary way, however, this is very positive for both the sector and Apple.
While earnings and economic factors drive stock values, it’s the thoughts and buying activity of investors that moves markets. Looking at how much money is moving into a stock’s puts and calls provides insights into what investors are thinking about the market, a sector, or a stock. Investor sentiment analysis is not intended to replace fundamental analysis. On the contrary, it is intended to compliment it. That’s essentially what we use it for.
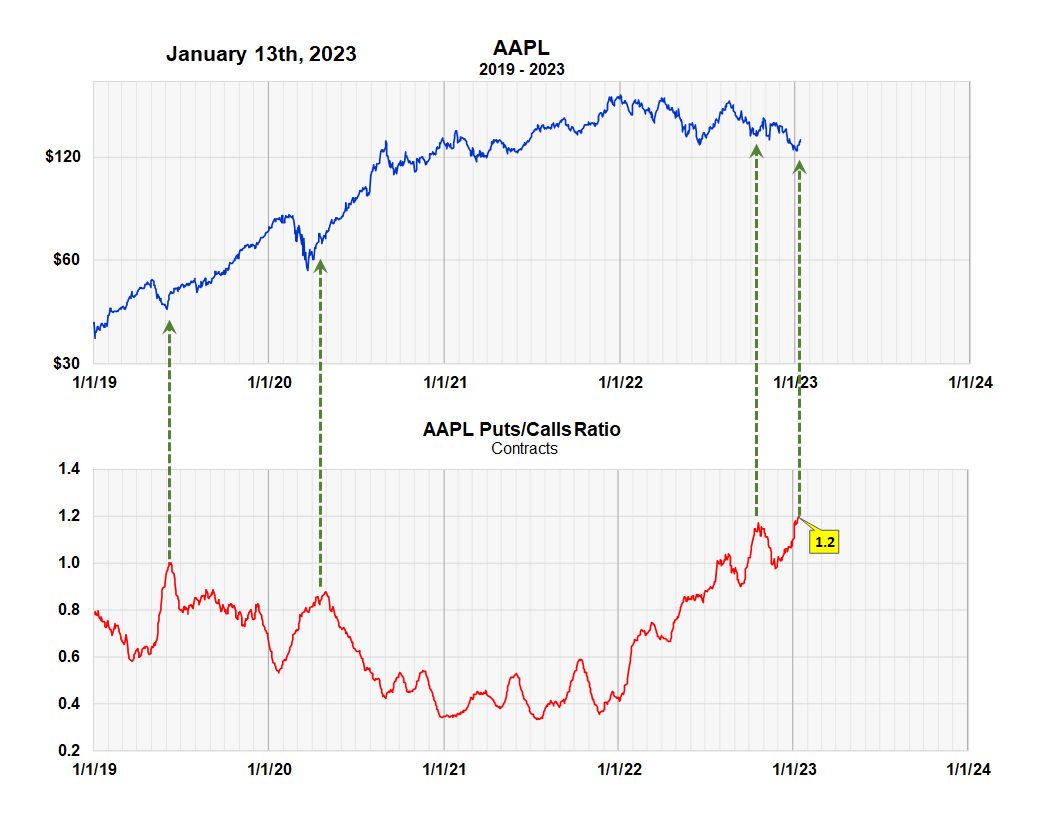
Apple “Puts To Calls” Contract Ratio (Michael McDonald)
The “put the calls” ratio of contracts in Apple stock is currently 1.2 puts for every one call. This is the highest ratio in four years. The green arrows indicate previous peaks in this ratio.
The next chart shows the same ratio but for price premiums in Apple puts and calls. It shows that 4.6 times more money is going into put purchases than call purchases. Green arrows, likewise, point to critical moments as indicated by high ratios in this indicator.
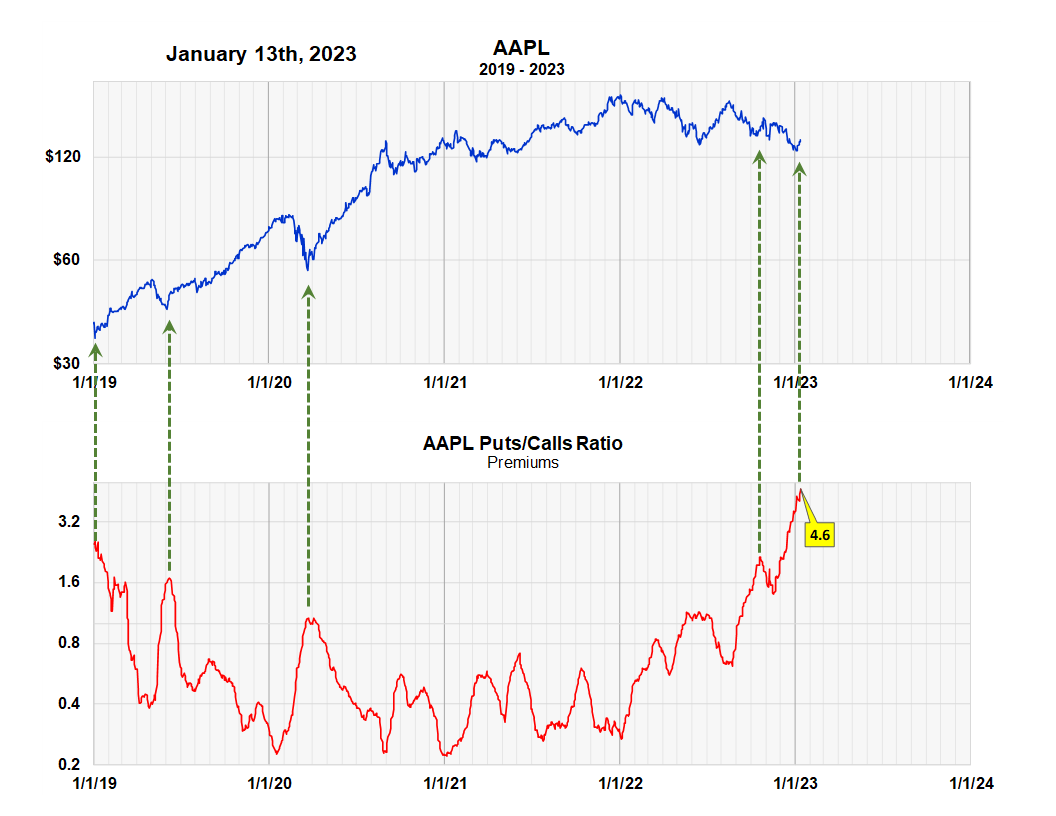
Apple “Puts to Calls” Premium Ratio (Michael McDonald)
We see similar high “puts to calls” ratios in the total technology sector.
Large amount of “put buying” in the technology sector
The two charts below show the same “puts to calls” ratios for the entire technology sector. Put and call statistics of over 600 technology stocks go into these ratio calculations. The ratios are plotted against the iShares technology ETF for price reference.
The “puts to calls” contract ratio for the entire sector is 1.2 puts for every one call. When we calculate the amount of money going into puts versus calls, we find seven times more money going into puts than calls.
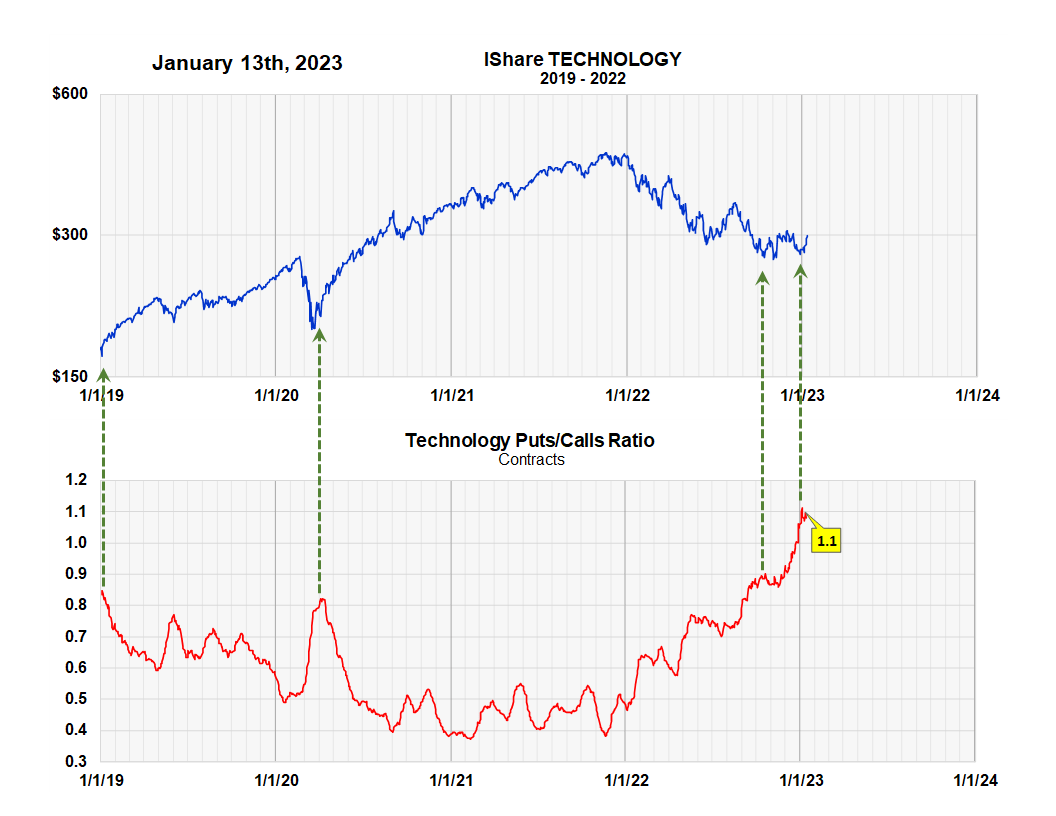
“Puts to Calls” Contract Ratio of 600+ technology stocks (Michael McDonald)
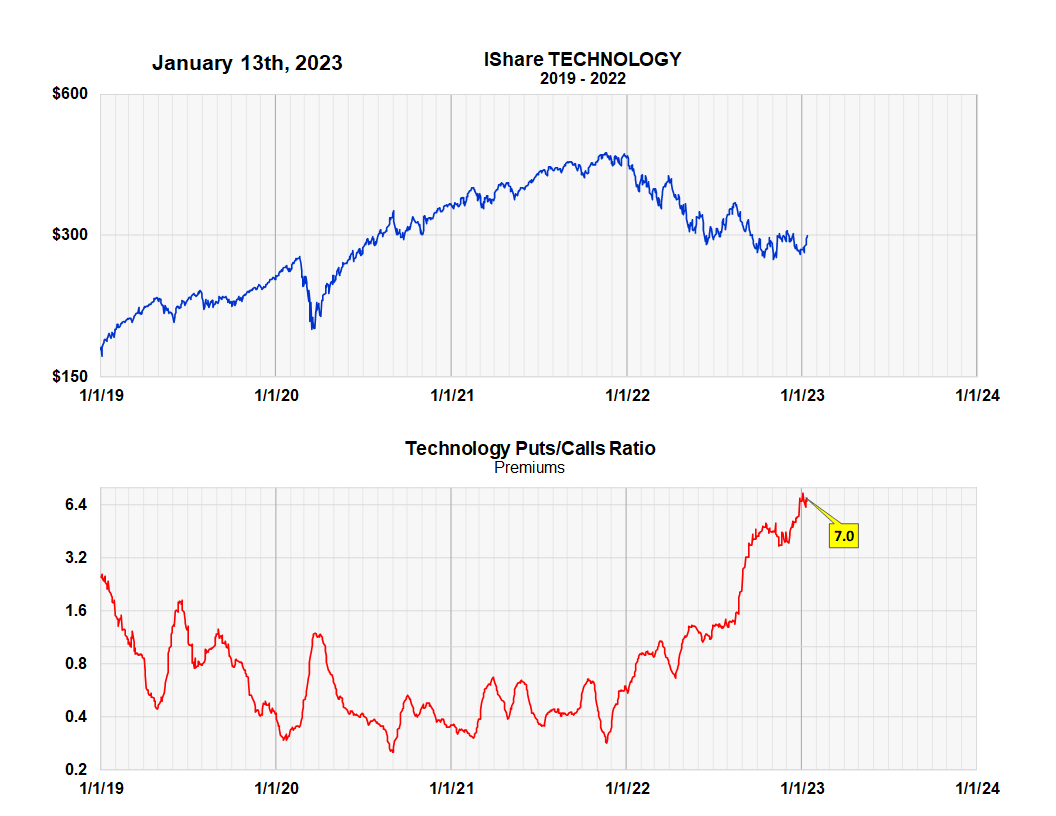
“Puts to Calls” Premium Ratio 600+ technology stocks (Michael McDonald)
Takeaway
While many investors are worried about the outlook for technology stocks in a high interest rate environment, these large “puts to calls” ratios in both Apple and the entire technology sector are encouraging since they imply higher prices, at least in the very near future. The ratios don’t indicate how much “higher” but experience has taught us that ratios this large usually precede substantial price gains for at least six months to a year.