Salesforce Stock Has Already Begun Its Next Rally (NYSE:CRM)
Stephen Lam
I’ve made it pretty clear in the past few weeks – both in my public articles and for subscribers – that I think the bottom is already in. I’ve also made it clear I think areas of high growth and high valuations – the areas that have been obliterated this year – are going to lead us out of this bear market. That belief has seen me shopping for risk exposure in the past couple of weeks, and one area I think looks great is software.
I see a lot of charts I like in software, but one that I think has a great looking chart, and a very strong future from a fundamental perspective, is software conglomerate Salesforce (NYSE:CRM). This company has been and is likely to remain a leader in the space through its transformational acquisitions and organic growth, and the chart is telling me the time to buy is at hand. I notified subscribers on June 2nd that I thought CRM had made the bottom, and so far, so good. But it’s not too late to buy, as the action since I made that call has only reinforced the idea CRM’s path is higher from here.
StockCharts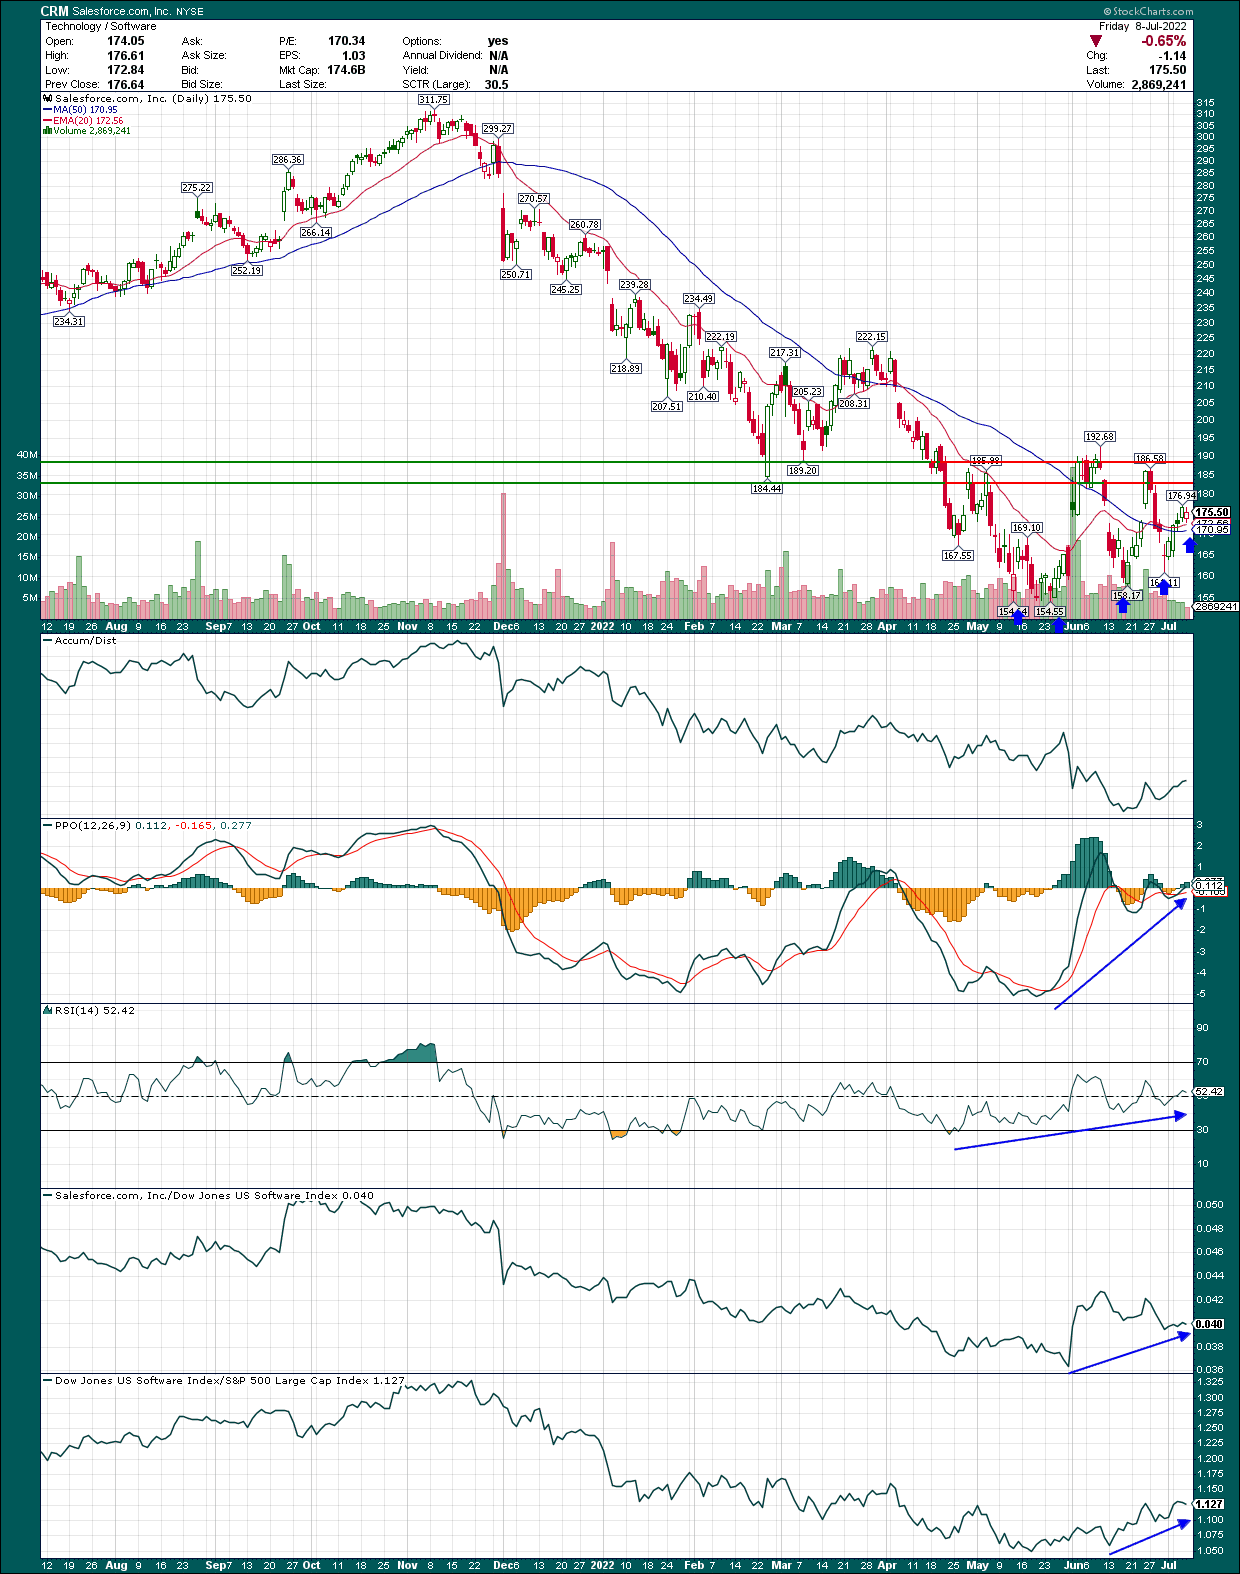
There’s a lot going on with this chart, so let’s first take a look at the most important thing, and that’s price action itself. We can see the big rally off the earnings report stopped exactly where you’d expect it to, at the zone of resistance I’ve annotated. That’s not a coincidence, and it’s why I love using technical analysis. Since then, we’ve seen a couple of pullbacks and a couple of rally attempts that have failed. However, there’s a lot to be bullish about right now.
First, we’re seeing higher lows. That means sellers have already reached exhaustion, or are very close. Second, the momentum indicators are pointing higher, and have been for some time, even as the stock flounders. That, again, is quite bullish as it is indicating sellers are drying up.
In the bottom two panels, we can see Salesforce is outperforming its peer group since the beginning of June, and critically, software stocks are beginning to outperform the S&P 500 again. We want to own winning stocks in winning groups, and to my eye, Salesforce checks that box.
Finally, both the 20-day EMA and the 50-day SMA have turned higher, which is a critical step in the process of bottoming. These should serve as support now, after having been resistance for several months.
I see a bunch to like here from a bullish perspective, and basically nothing that makes me bearish. It appears Salesforce was punished sufficiently in the past eight months or so, and that the next bull run has begun.
Now, let’s take a look at the fundamental case for Salesforce, as I think that’s equally as compelling.
Growth, Both Bought And Made
The thing that I like about Salesforce is that it is extremely diversified, which is the exact opposite of most software stocks. Generally, software stocks have one product, or maybe a core product and extensions of that product. The point is, however, that when a new competitor starts to do the same thing, it can be devastating to a highly concentrated business. Software is the antithesis to this, and its diversification is perhaps its most attractive trait.
Investor presentation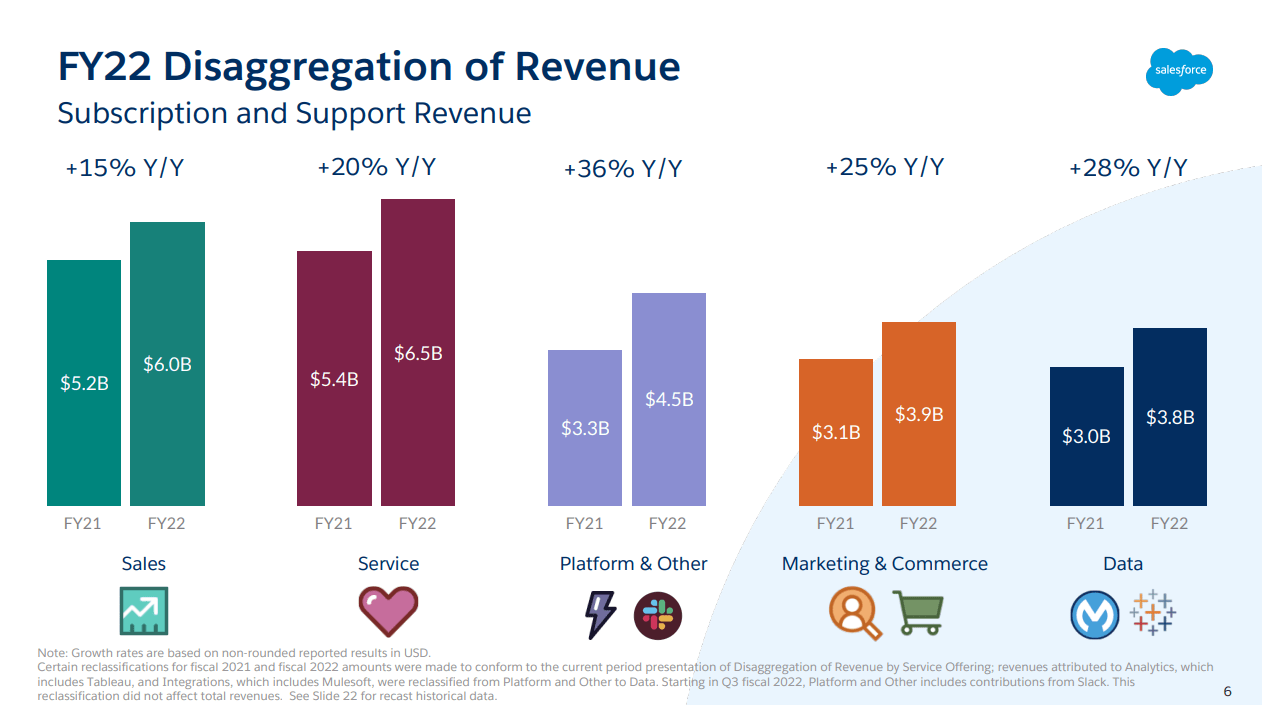
The last fiscal year showed at least 15% growth across all of its categories, with MuleSoft and Tableau leading the way in terms of revenue growth. You wouldn’t know by looking at the share price that the company’s segments were all absolutely crushing it in terms of generating new business. The share price looks like a company that is in decline, but that couldn’t be further from the truth.
In addition, the company’s backlog continues to grow, and is absolutely enormous at this point.
Investor presentation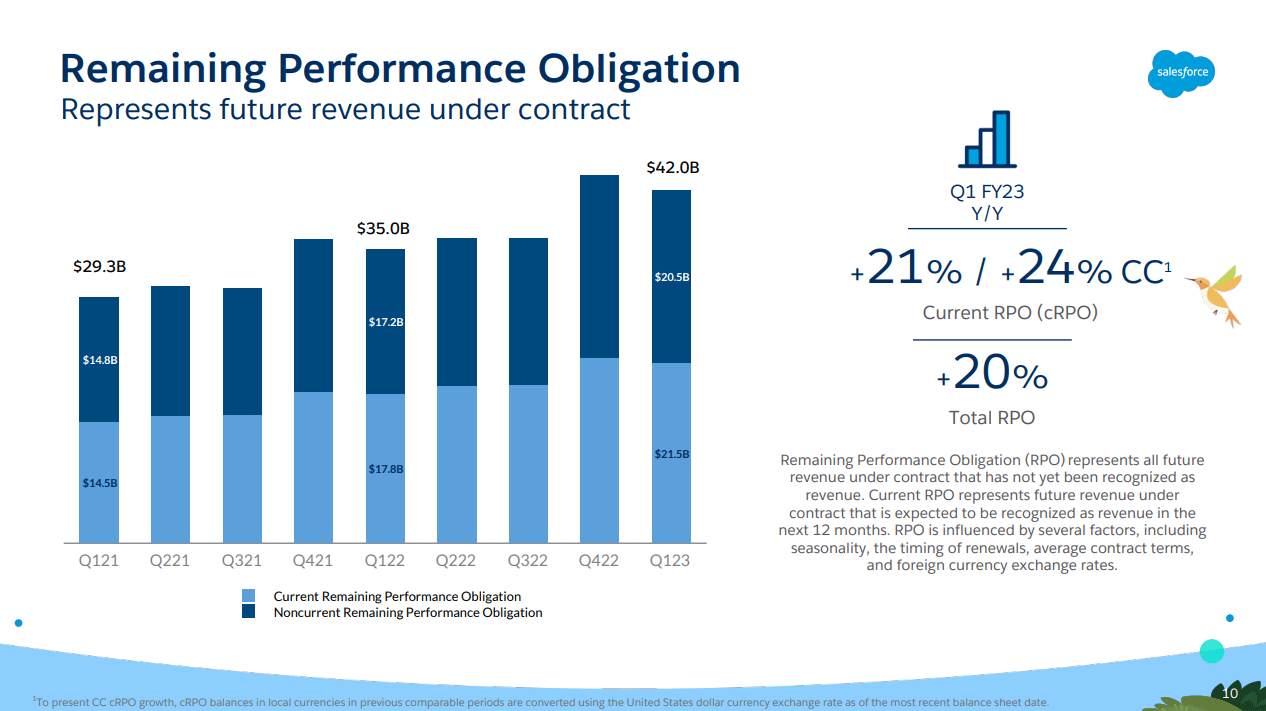
Salesforce ended FQ1 with $42 billion in RPO, up 20% year-over-year. That’s ~16 months of revenue that is in the backlog, and it continues to grow as the top line grows. This assures Salesforce remains in a strong position from a revenue growth perspective for the foreseeable future, which is critical given how much money the company is spending.
Investor presentation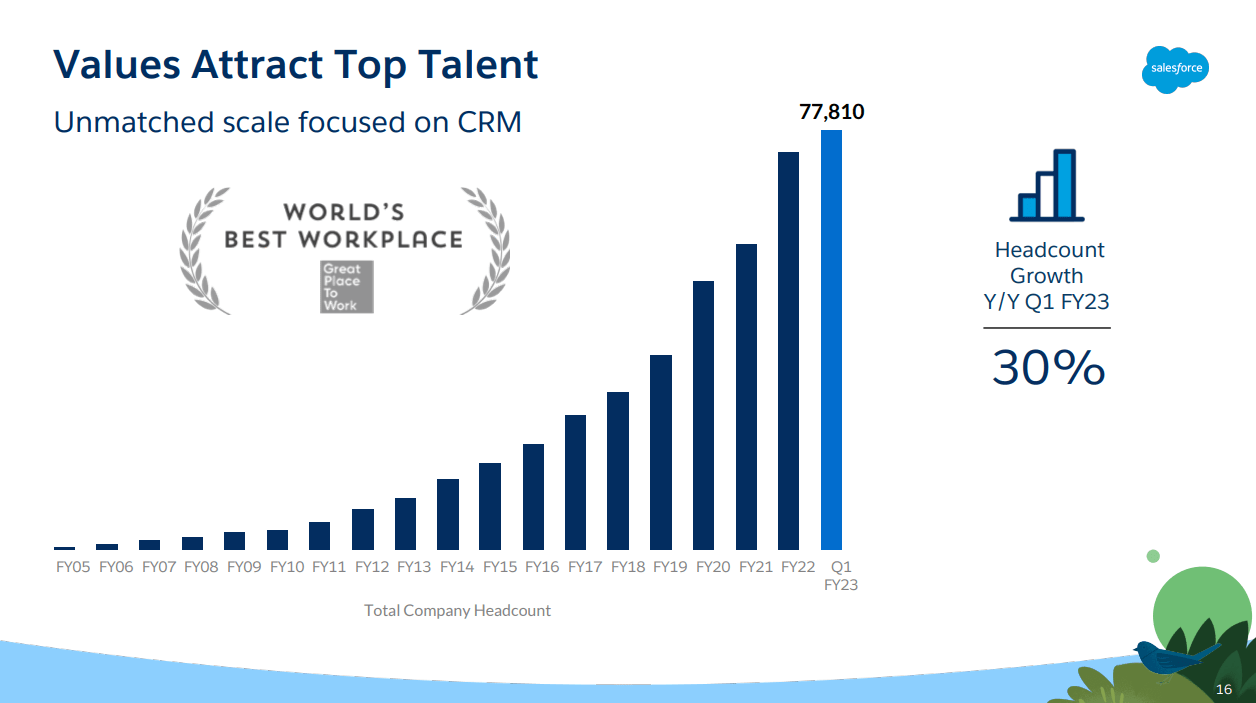
Salesforce touts its workplace awards, and rightfully so; attracting top talent is something every company wants to achieve. However, headcount was up 30% year-over-year in FQ1, and has been growing extremely rapidly in recent years. While that supports innovation, product development, and ultimately growth, it is also the most expensive thing a company can do.
Salesforce, despite its enormous size, continues to invest like a startup in its future growth. As long as it pays off, that strategy works. If it doesn’t, Salesforce will have a gigantic fixed cost base without commensurate revenue and margin to pay for it. To be clear, I don’t think that will happen, but when you see headcount outpacing revenue growth by a wide margin, that’s something that must be monitored. There is such a thing as over-investing.
Getting back to the revenue story, below we can see Salesforce’s history of outperforming estimates, which is evident by the nearly constant upward slope of these lines.
Seeking Alpha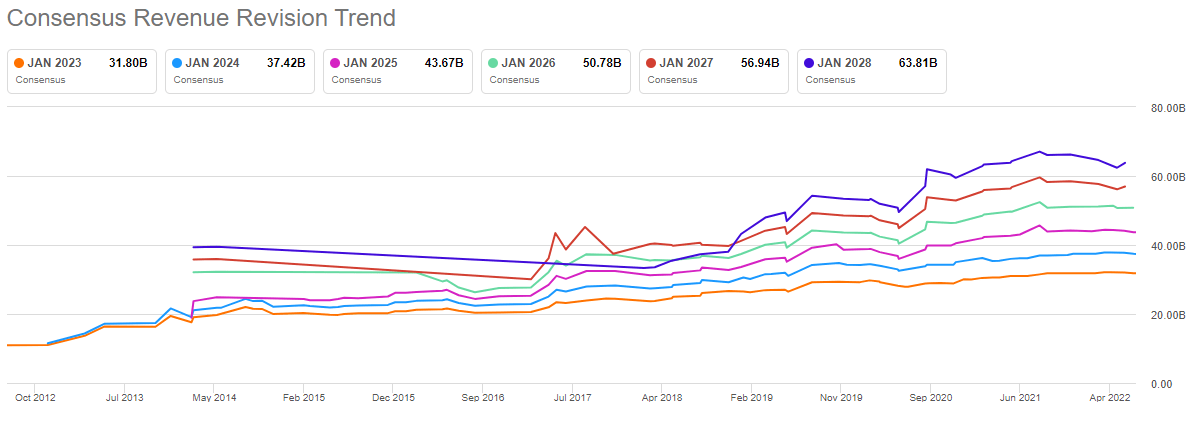
There are dips as sentiment changes over time, but the trend here is quite clear. In addition, there’s sufficient space in between the lines, which represents year-over-year growth. Not much to say here other than if you’re looking for a reason to be bullish, you can do much worse than to see revenue revisions like this.
We see a bumpier path with EPS, which looks wholly different to the revenue revisions we just looked at.
Seeking Alpha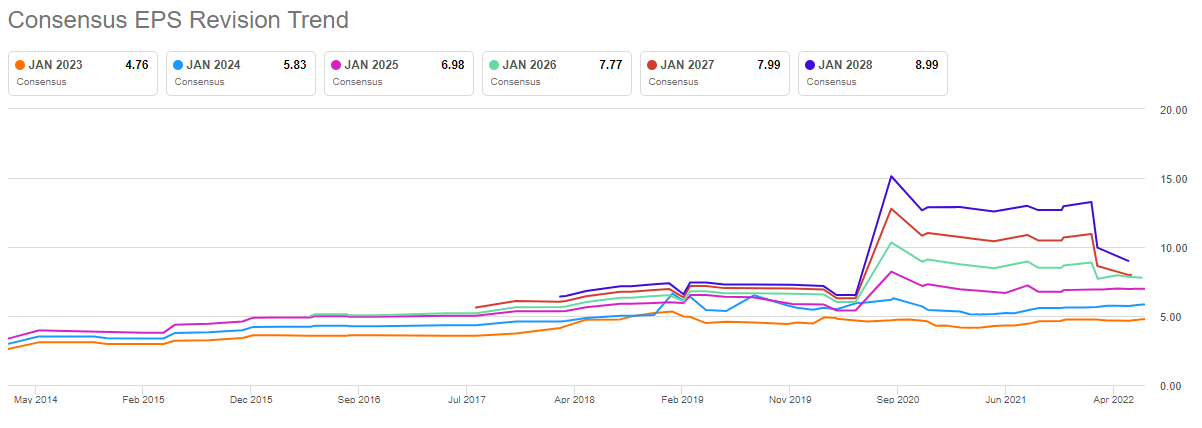
The trend is still higher over time, but there were huge expectations of Salesforce in late-2019, which is right before a certain pandemic started. Since then, estimates bottomed before moving higher for this year, as well as the next two years. The out years continue to see downward revisions, but those are far less important than expectations for the next year or two. On that measure, it seems Salesforce has seen the worst of sentiment, which is another key factor in spotting a bottom.
One final point before we get to the valuation is that Salesforce has made its living to a large extent buying growth. Its list of purchases is extensive, and the company has spent an enormous amount of money over the years buying companies to add to its ecosystem.
TIKR cash acquisitions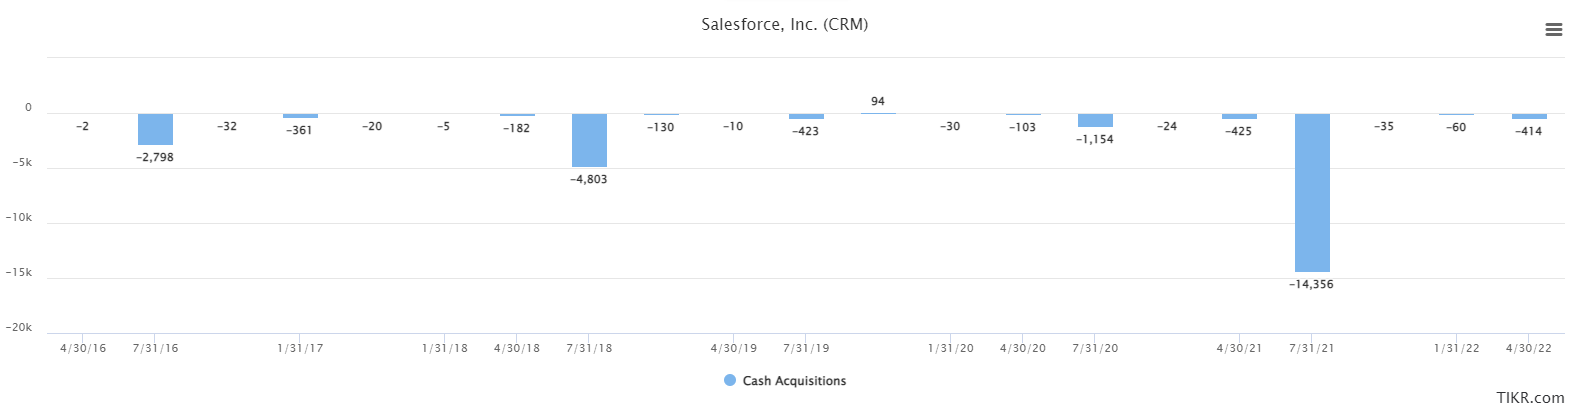
Just the past handful of years has seen well over $20 billion of cash paid for acquisitions. That’s a huge amount for all but the very largest companies in the world, but to its credit, Salesforce has maintained a pristine balance sheet throughout.
TIKR net debt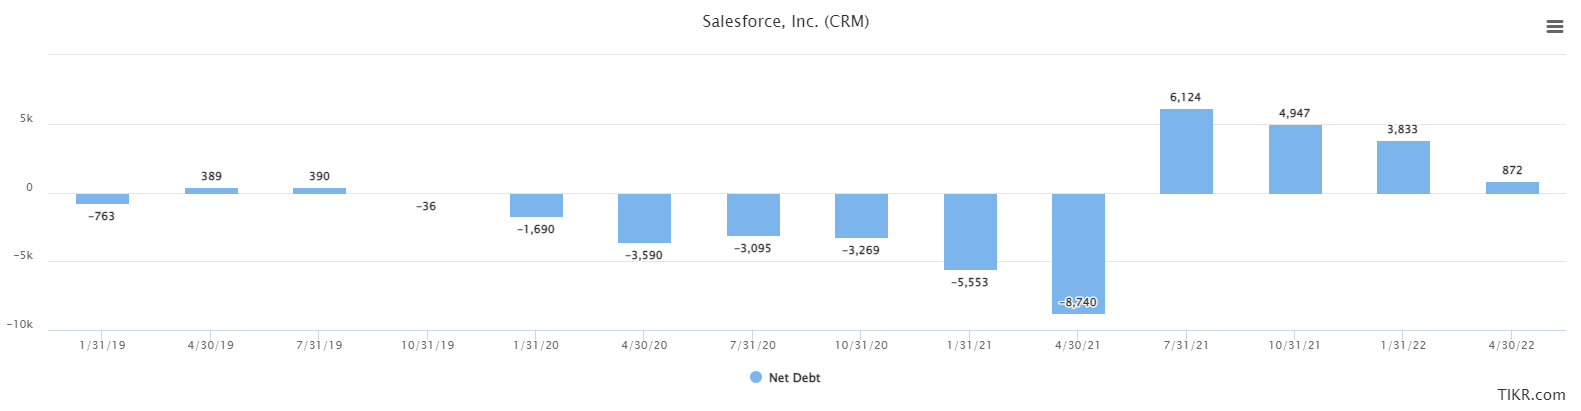
Net debt has fluctuated, as you’d expect, but it has a very good chance of being around zero by the end of the July quarter. That means Salesforce has immense flexibility with its own business to invest, but also to go out and get its next bolt-on target to further build its ecosystem. I see the lack of leverage as a big advantage for Salesforce given its chosen strategy of buying growth, and it supports the bull case over time.
To be fair, Salesforce isn’t exactly afraid to dilute shareholders both to pay employees, and to fund these acquisitions. However, so long as they are accretive, that’s okay. For now, it’s working.
It’s…so…cheap
As you may expect, a stock that fell by half from peak to trough is now looking much cheaper than it was. Let’s start by valuing it on a price-to-sales basis.
TIKR P/S ratio
This is a three-year view, and we can see the trough was 4.8X sales, which was actually hit very recently, while the peak was 11.4X. I don’t think we’ll see that sort of valuation anytime soon, as unbridled bullishness is needed for such frothiness. However, the average of 7.9X? Absolutely. The past two years have proven Salesforce’s model isn’t broken, and in fact, is thriving. Why shouldn’t we expect at least an average valuation?
Let’s now take a look at forward P/E, which shows an even more bullish tint.
TIKR P/E ratio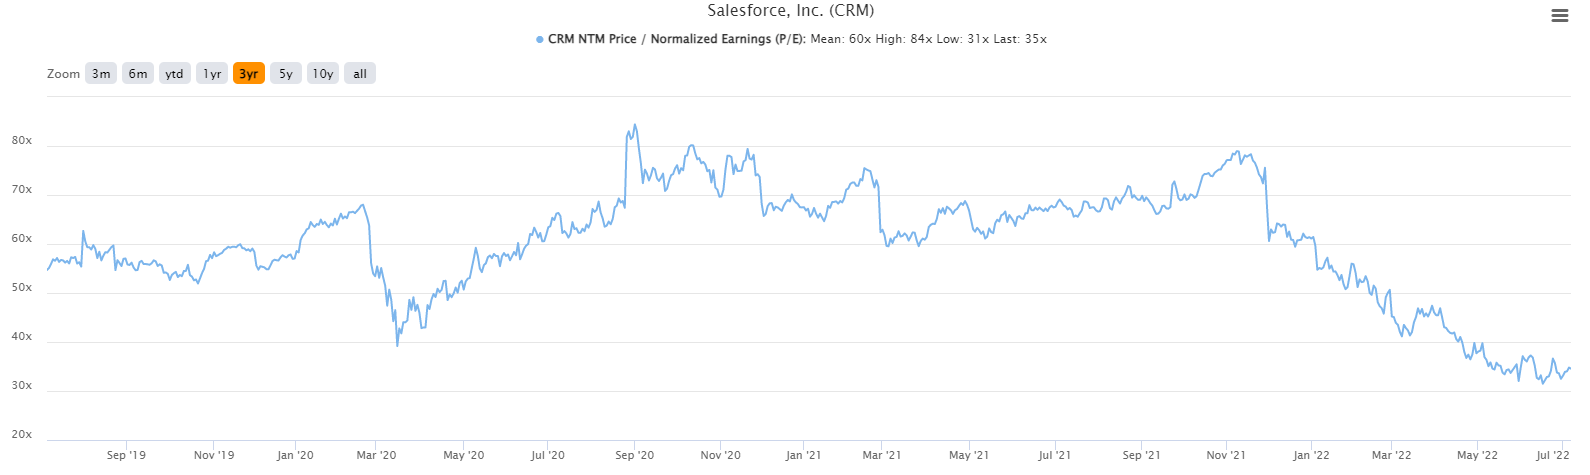
The average forward P/E in the past three years is 60X earnings, and shares trade for just 35X today. Again, the peak of 84X is likely unrealistic, but we could easily see 50X to 60X forward earnings in the coming months, given I believe the stock has bottomed. That would mean a share price of $238 to $286 on $4.76 in projected EPS for fiscal 2023, and if we do the same calculation on fiscal 2024, we’re looking at $292 to $350. If you’re keeping score at home, that’s a long way from today’s price of $176, so I think upside potential both short-term and long-term is significant to say the least.
Buying software stocks in the face of a recession, and while we’re still in a bear market, takes some faith to be sure. But I’m seeing signs all over the place that there is cause for optimism, which is why I told subscribers five weeks ago it was okay to buy CRM. I still see that as the case now, with the past five weeks having bolstered the bullish case.
Salesforce is way too cheap and has far too much growth ahead to be priced the way it is. This stock is going much, much higher.