SCHB: A Cheap Broad-Market ETF For Beginner Investors (NYSEARCA:SCHB)
Spencer Platt/Getty Images News
Investment Thesis
For beginner investors, two of the most important things you can do is insist on a low-fee approach and develop a well-diversified portfolio. ETFs like the Schwab U.S. Broad Market ETF (NYSEARCA:SCHB) help you do both at once, as it charges just 0.03% in annual fees and holds nearly 2,500 U.S. small-, mid-, and large-cap equity securities. Its plain-vanilla market-cap-weighted approach is as straightforward as it gets, but that can be beneficial over the long run. Even for professionals, investing shouldn’t be overly complex.
This article will compare SCHB with two other broad-market U.S. equity ETFs with the same strategy: the Vanguard Total Stock Market ETF (VTI) and the iShares Core S&P Total U.S. Stock Market ETF (ITOT). I’ll also introduce the Schwab Fundamental U.S. Broad Market Index ETF (FNDB), which follows a fundamentals-based strategy but is more costly at a 0.25% expense ratio. In my view, all three are worth looking at, and beginner investors likely won’t go wrong with either choice in the long run.
ETF Overview
SCHB tracks the Dow Jones U.S. Broad Stock Market Index, in which only small-cap, mid-cap, and large-cap common stocks of U.S. companies are eligible (including equity and mortgage REITs). CEFs, ETFs, preferred stocks, American Depository Receipts, SPACs, Master Limited Partnerships, and other organizational structures are ineligible. The Index is float-adjusted market-cap-weighted, reconstitutes annually in September, and rebalances quarterly. The full Index methodology can be found here.
SCHB’s sector exposures are below, alongside the SPDR S&P 500 ETF (SPY), VTI, ITOT, and FNDB. You can see that the primary difference between SPY and the three plain-vanilla broad market ETFs (VTI, ITOT, SCHB) is less Technology exposure. However, the differences are minor and reflect the influence large-cap stocks have. To illustrate, the total market capitalization for all 2,475 securities in SCHB is $41.37 trillion. However, the 500 largest securities total $35.36 trillion. Effectively, investors don’t get much more diversification with the broad market approach. If you know what allocations you’d like by size (large, mid, small), you’re probably better off just buying three ETFs targeting those segments and adjusting your weights accordingly.
Morningstar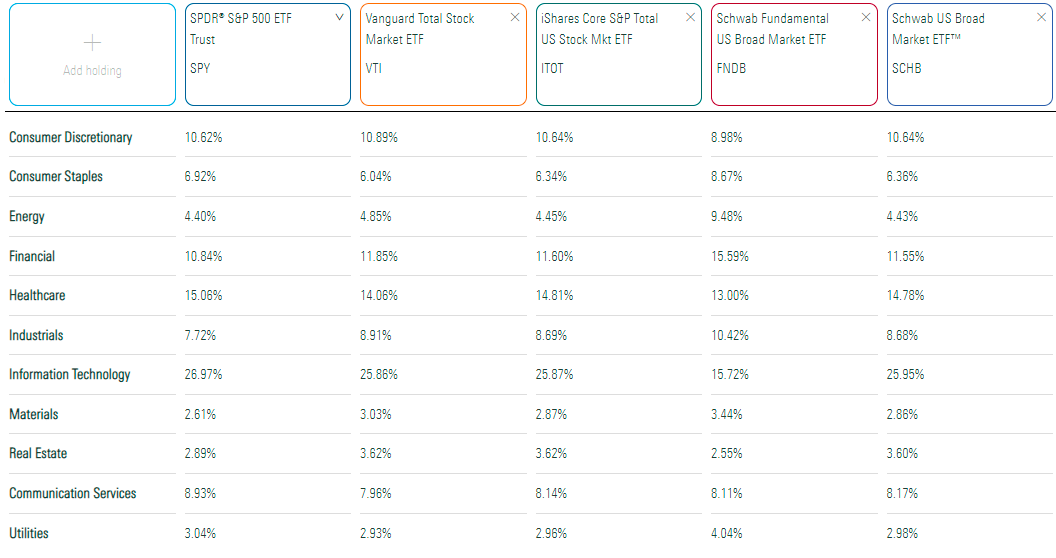
SCHB’s top ten holdings are the same as in the S&P 500 Index, with smaller weights. They include Apple (AAPL), Microsoft (MSFT), Amazon (AMZN), and Alphabet (GOOGL, GOOG). Generally, the case for SCHB would be that mega-cap stocks are overvalued and that higher returns will come from small- and mid-cap stocks. That’s not exactly my view since I give a lot of weight to the most profitable companies that also happen to be the largest by market capitalization. However, it’s still important to keep an eye on valuation because, sometimes, a broad-market strategy could be superior.
Schwab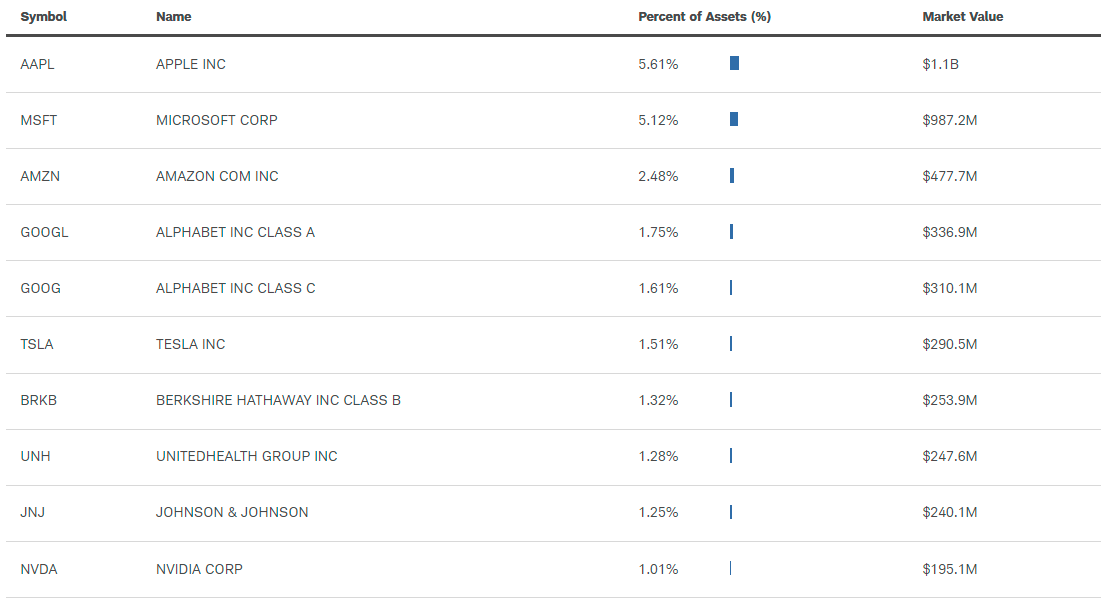
Performance Analysis
Since its inception in October 2009, SCHB has gained an annualized 12.35%, virtually identical to VTI and ITOT. The three broad-market ETFs have slightly trailed the iShares Core S&P 500 ETF (IVV), implying that additional diversification was not beneficial. Still, I think the results are impressive.
Portfolio Visualizer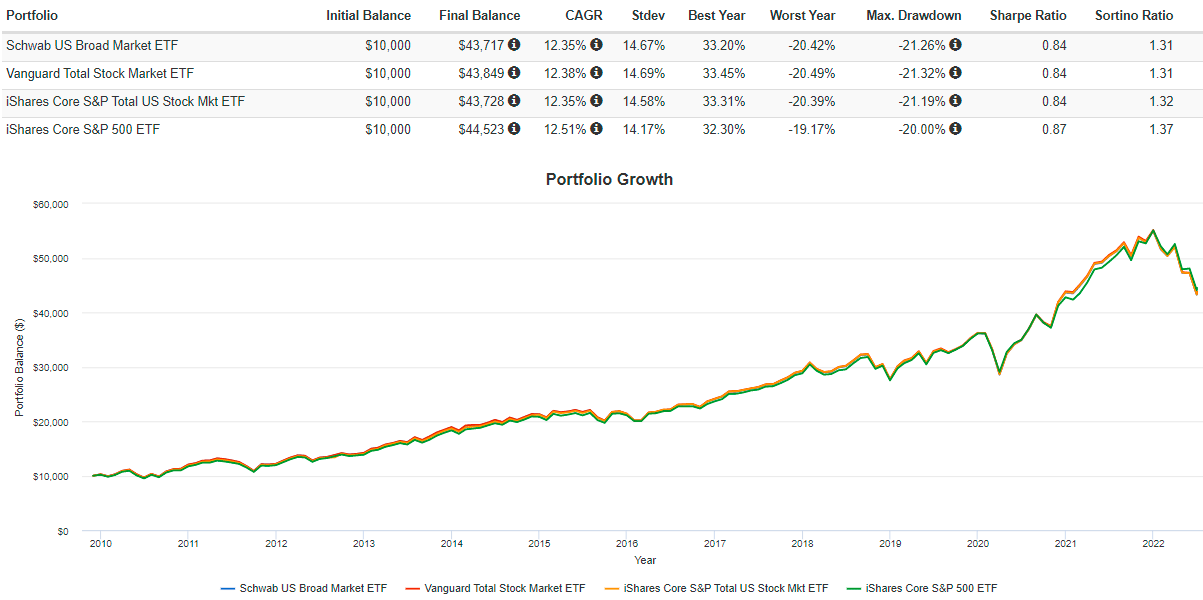
Perhaps the more interesting comparison is with FNDB. My view of fundamental investing is that it works well when markets are rational. The problem is, that’s not always the case. Take 2020, for example, when valuations for high-growth stocks were bid to unrealistic levels. It was only a matter of time (2022) before the unwarranted gains reversed, and I think it’s up to each investor to decide how much time they want to spend deciphering market rationality.
As shown in the graph below, SPHB has gained an annualized 11.35% since FNDB launched in July 2013, compared to an 11.01% return for FNDB. Most of this is the expense ratio difference, but FNDB experienced much less volatility as measured by annual standard deviation. Therefore, risk-adjusted returns (Sharpe and Sortino Ratio) were far superior. That’s an important consideration, too, especially for beginner investors who usually dislike big swings in their account balances.
Portfolio Visualizer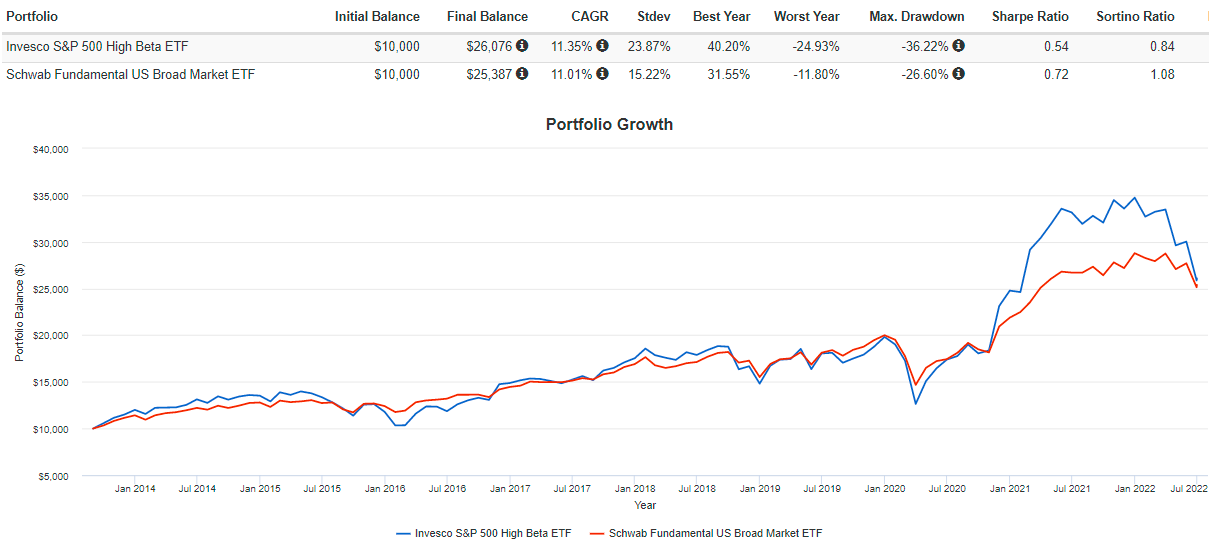
A look at annual returns helps identify when fundamental investing works best. Notably, in the three years where the markets were down (2015, 2018, 2022), FNDB outperformed SPHB by 9.81%, 7.33%, and 13.13%. It seems like markets pay much more attention to fundamentals in downturns. In contrast, investors care less about fundamentals when markets are optimistic.
Portfolio Visualizer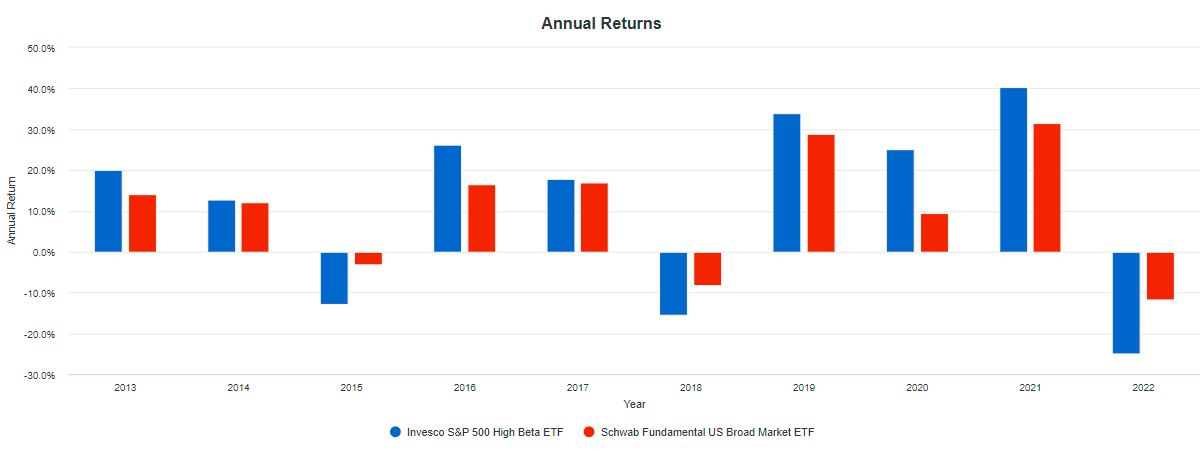
Fundamental Analysis
Since it’s clear very little separates SPHB from VTI and ITOT, I won’t bother comparing their fundamentals. Instead, I will compare SPHB with FNDB because I think there’s an exciting trade decision here. The following table highlights selected metrics for SPHB’s top 20 industries.
The Sunday Investor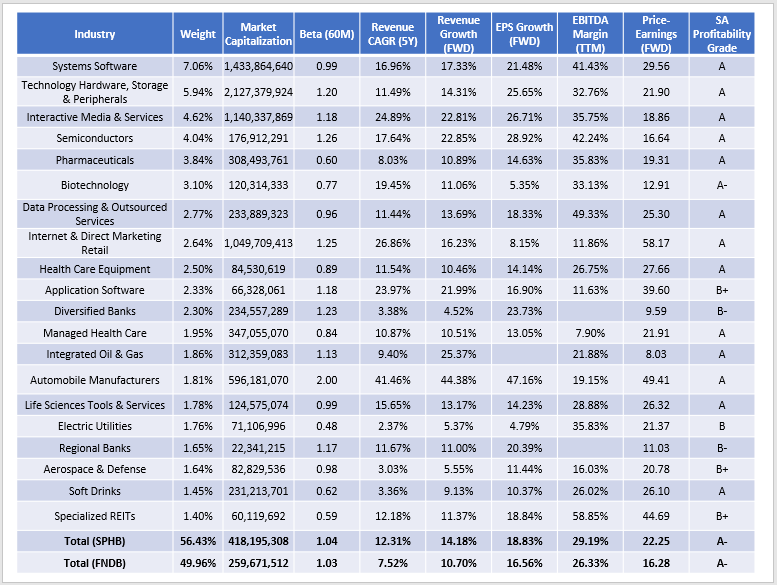
First, it’s not surprising that FNDB’s weighted-average market capitalization is lower since the fundamental indexing approach looks at factors rather than size. However, in terms of volatility, there is hardly a difference. SPHB and FNDB’s five-year beta based on current constituents is nearly identical (1.04 vs. 1.03).
Instead, the key differences are in growth and valuation. SPHB’s estimated revenue and earnings per share growth are superior (14.18% vs. 10.70% and 18.83% vs. 16.56%). EBITDA margins are also better (29.19% vs. 26.33%), but it comes at a price. SPHB’s weighted-average forward price-earnings ratio is six points higher (22.25 vs. 16.28). That’s a steep premium to pay for just a couple extra percentage points in growth. Indeed, if the downturn continues, there’s every reason to believe FNDB will outperform.
As suggested earlier, an ETF like SPHB needs the market to care less about fundamentals before it’s likely to outperform again. In my view, I don’t think that’s going to happen in the short run. The University of Michigan Consumer Sentiment Index hit a record low in June, the U.S. Treasury yield curve recently inverted again and remains relatively flat, and rising interest rates amid out-of-control inflation continue to put the economy at risk. The main bright spot is that the downward trend in quarterly earnings surprises stalled in Q1. In my view, confirmation of a reversal in Q2 could give rise to a market rebound. Absent that, however, I’m happy to continue owning stocks based on the fundamentals. That means SPHB isn’t the best choice now, though it probably is acceptable for long-term passive investors with no interest in analyzing markets.
Investment Recommendation
SPHB is virtually identical to other broad-market U.S. equity ETFs like VTI and ITOT. Its expense ratio of 0.03% is perfect for beginner investors. Still, its exposure to small- and mid-cap stocks is minimal and won’t result in much more diversification than an S&P 500 Index ETF like SPY or IVV. Historical results confirm there isn’t much difference, too.
SPHB investors, like all market indexers, will have to decide if it’s worth it to evaluate market sentiment and ETF fundamentals to gain an edge. That’s my goal with the Active Equity ETF Portfolio on the Hoya Capital Income Builder Marketplace, where I aim to educate readers on how to construct a balanced portfolio to suit their investment objectives. For this reason, SPHB is not my ideal product, as I believe I can create a better portfolio on my own. Still, SPHB will give you a solid core portfolio you can build around, and since Index investing works well for many investors, I hope you’ll consider buying. Thanks for reading, and I hope to answer any questions you may have in the comments section below.