iShares Global Consumer Staples ETF: Consumer Staples Dashboard For March (NYSEARCA:KXI)
Dan Dalton
This monthly article series shows a dashboard with aggregate industry metrics in consumer staples. It is also a review of sector exchange-traded funds, or ETFs, like the Consumer Staples Select Sector SPDR ETF (XLP) and the iShares Global Consumer Staples ETF (NYSEARCA:KXI), whose holdings are used to calculate these metrics.
Shortcut
The next two paragraphs in italic describe the dashboard methodology. They are necessary for new readers to understand the metrics. If you are used to this series or if you are short of time, you can skip them and go to the charts.
Base Metrics
I calculate the median value of five fundamental ratios for each industry: Earnings Yield (“EY”), Sales Yield (“SY”), Free Cash Flow Yield (“FY”), Return on Equity (“ROE”), Gross Margin (“GM”). The reference universe includes large companies in the U.S. stock market. The five base metrics are calculated on trailing 12 months. For all of them, higher is better. EY, SY and FY are medians of the inverse of Price/Earnings, Price/Sales and Price/Free Cash Flow. They are better for statistical studies than price-to-something ratios, which are unusable or non available when the “something” is close to zero or negative (for example, companies with negative earnings). I also look at two momentum metrics for each group: the median monthly return (RetM) and the median annual return (RetY).
I prefer medians to averages because a median splits a set in a good half and a bad half. A capital-weighted average is skewed by extreme values and the largest companies. My metrics are designed for stock-picking rather than index investing.
Value and Quality Scores
I calculate historical baselines for all metrics. They are noted respectively EYh, SYh, FYh, ROEh, GMh, and they are calculated as the averages on a look-back period of 11 years. For example, the value of EYh for food in the table below is the 11-year average of the median Earnings Yield in food companies.
The Value Score (“VS”) is defined as the average difference in % between the three valuation ratios (EY, SY, FY) and their baselines (EYh, SYh, FYh). The same way, the Quality Score (“QS”) is the average difference between the two quality ratios (ROE, GM) and their baselines (ROEh, GMh).
The scores are in percentage points. VS may be interpreted as the percentage of undervaluation or overvaluation relative to the baseline (positive is good, negative is bad). This interpretation must be taken with caution: the baseline is an arbitrary reference, not a supposed fair value. The formula assumes that the three valuation metrics are of equal importance.
Current Data
The next table shows the metrics and scores as of last week’s closing. Columns stand for all the data named and defined above.
|
VS |
QS |
EY |
SY |
FY |
ROE |
GM |
EYh |
SYh |
FYh |
ROEh |
GMh |
RetM |
RetY |
|
|
Staple/Food Retail |
-19.88 |
-12.79 |
0.0313 |
1.9723 |
0.0188 |
14.60 |
19.12 |
0.0418 |
1.9066 |
0.0303 |
16.60 |
22.12 |
-4.22% |
-4.97% |
|
Food |
-11.23 |
4.49 |
0.0505 |
0.6636 |
0.0133 |
18.56 |
29.38 |
0.0456 |
0.6642 |
0.0239 |
15.40 |
33.22 |
-1.19% |
11.99% |
|
Beverage |
-5.97 |
-22.50 |
0.0293 |
0.2869 |
0.0161 |
16.57 |
45.51 |
0.0361 |
0.2673 |
0.0172 |
24.09 |
52.78 |
-2.44% |
7.29% |
|
Household prod. |
-12.72 |
-23.31 |
0.0513 |
1.1900 |
0.0052 |
10.45 |
37.95 |
0.0456 |
0.8789 |
0.0373 |
17.26 |
40.88 |
-9.46% |
-34.75% |
|
Personal care |
-36.38 |
0.67 |
0.0290 |
0.3408 |
0.0075 |
18.53 |
62.88 |
0.0378 |
0.4480 |
0.0197 |
20.98 |
55.64 |
-1.47% |
0.30% |
|
Tobacco |
31.21 |
-39.38 |
0.0684 |
0.7755 |
0.0174 |
8.38 |
50.80 |
0.0588 |
0.4741 |
0.0153 |
34.54 |
52.39 |
-7.26% |
0.35% |
Value And Quality Chart
The next chart plots the Value and Quality Scores by industry (higher is better).
Value and quality in consumer staples (Chart: author; data: Portfolio123)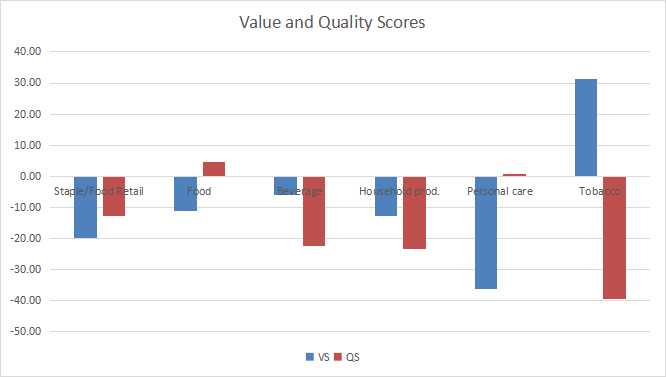
Evolution Since Last Month
Valuation has improved in food and retail. Quality has deteriorated in household products and tobacco.
Value and quality variation (Chart: author; data: Portfolio123)
Momentum
The next chart plots momentum data.
Momentum in consumer staples (Chart: author; data: Portfolio123)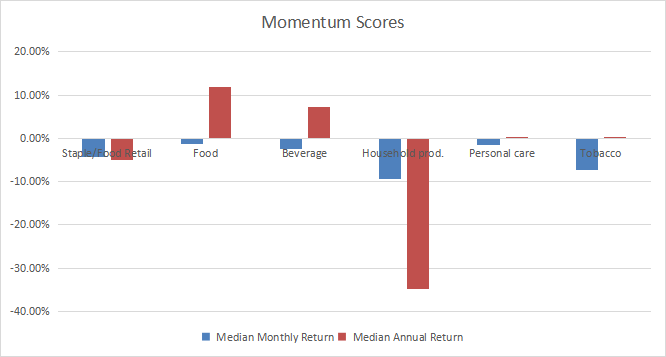
Interpretation
According to my S&P 500 monthly dashboard, consumer staples are the second most overvalued sector after industrials. The tobacco industry is undervalued by about 30% relative to 11-year averages. However, this is offset by the worst quality score in the sector. A note of caution about sample size: there are only five tobacco companies in my reference universe, so statistics in this industry aren’t the most reliable. Other subsectors are overvalued by 6% to 36%, and quality metrics don’t justify it. Personal care is the most overvalued one.
Fast Facts on KXI
The iShares Global Consumer Staples ETF was launched on 09/12/2006 and tracks the S&P Global 1200 Consumer Staples Capped Index. It has 95 holdings and a 12-month distribution yield of 2.07%. The total expense ratio of 0.40% is more expensive than for U.S. index ETFs like XLP, whose fee is 0.10%. About 55% of asset value is invested in U.S. companies and 33% in Europe. Large and mega-cap companies represent 90% of asset value.
The next table lists the top 10 holdings with fundamental ratios. The portfolio is quite concentrated: their aggregate weight is 49.4%.
|
Ticker |
Name |
Weight% |
EPS growth %TTM |
P/E TTM |
P/E fwd |
Yield% |
Exchange |
|
Procter & Gamble Co. |
8.67 |
0.63 |
25.10 |
24.51 |
2.56 |
NYSE |
|
|
Nestlé SA |
8.31 |
-46.04 |
32.87 |
21.85 |
2.70 |
Switz. |
|
|
PepsiCo, Inc. |
5.34 |
16.90 |
27.52 |
24.37 |
2.61 |
NASDAQ |
|
|
Costco Wholesale Corp. |
4.61 |
9.73 |
35.80 |
33.65 |
0.74 |
NASDAQ |
|
|
The Coca-Cola Co. |
4.33 |
-2.59 |
27.50 |
23.22 |
3.05 |
NYSE |
|
|
Walmart, Inc. |
4.23 |
-12.32 |
32.34 |
22.58 |
1.65 |
NYSE |
|
|
Philip Morris International, Inc. |
4.06 |
-0.20 |
16.41 |
15.14 |
5.33 |
NYSE |
|
|
UL* |
Unilever PLC |
3.57 |
12.32 |
16.08 |
17.98 |
3.56 |
London |
|
L’Oréal SA |
2.82 |
15.32 |
36.22 |
32.23 |
1.57 |
Paris |
|
|
DEO* |
Diageo PLC |
2.74 |
6.66 |
22.87 |
21.18 |
2.08 |
London |
Ratios: Portfolio123.
* I refer to the US tickers to link to Seeking Alpha ticker page, but the fund holds shares in primary exchanges.
Since inception, KXI has underperformed the U.S. consumer staples benchmark XLP by 1.8 percentage point, and shows a higher risk measured in maximum drawdown.
|
Total Return |
Annual Return |
Max Drawdown |
Sharpe |
|
|
KXI |
237.44% |
7.65% |
-42.27% |
0.57 |
|
XLP |
337.66% |
9.37% |
-32.39% |
0.71 |
In summary, KXI is an ETF for investors seeking international exposure in consumer defensive stocks. It is not currency-hedged, which may be a bad point or a good one depending on one’s expectation about the dollar. The portfolio is quite heavy in the top two holdings: PG and Nestle represent 17% of asset value together. These are time-tested companies, but investors who want a more diversified portfolio may prefer the Invesco S&P 500 Equal Weight Consumer Staples ETF (RHS).
Dashboard List
I use the first table to calculate value and quality scores. It may also be used in a stock-picking process to check how companies stand among their peers. For example, the EY column tells us that a food company with an earnings yield above 0.0505 (or price/earnings below 19.80) is in the better half of the industry regarding this metric. A Dashboard List is sent every month to Quantitative Risk & Value subscribers with the most profitable companies standing in the better half among their peers regarding the three valuation metrics at the same time. The consumer staples stocks below are part of the list sent to subscribers at the beginning of this month.
|
USANA Health Sciences, Inc. |
|
|
Coca-Cola Consolidated, Inc. |
It is a rotational model with a statistical bias toward excess returns on the long-term, not the result of an analysis of each stock.
Editor’s Note: This article discusses one or more securities that do not trade on a major U.S. exchange. Please be aware of the risks associated with these stocks.