ZIM Integrated Stock: Be Really Cautious Here (NYSE:ZIM)
alvarez/E+ via Getty Images
Price Action Thesis
We present a detailed price action analysis of ZIM Integrated (NYSE:ZIM) stock. We observed a double top bull trap (significant rejection of buying momentum) in March 2022, followed by a lower high bull trap in late May. After both instances, the market sent ZIM into a steep decline, forcing a rapid liquidation of positions.
Our reverse cash flow valuation analysis indicates that investors need to be cautious in adding ZIM at the current levels. The Street is modeling a steep revenue moderation in FY22 before posting negative growth from FY23. Notably, ZIM’s profitability is also expected to be significantly impacted, therefore affecting its valuation.
We urge investors to be cautious given its price action dynamics, steeply falling revenue growth and profitability estimates.
Notwithstanding, ZIM seems to be at its near-term support. Therefore, investors can consider waiting for a potential short-term rally before layering out/cutting exposure.
As such, we rate ZIM as a Hold.
ZIM – Don’t Ignore The Double Top
ZIM price chart (TradingView)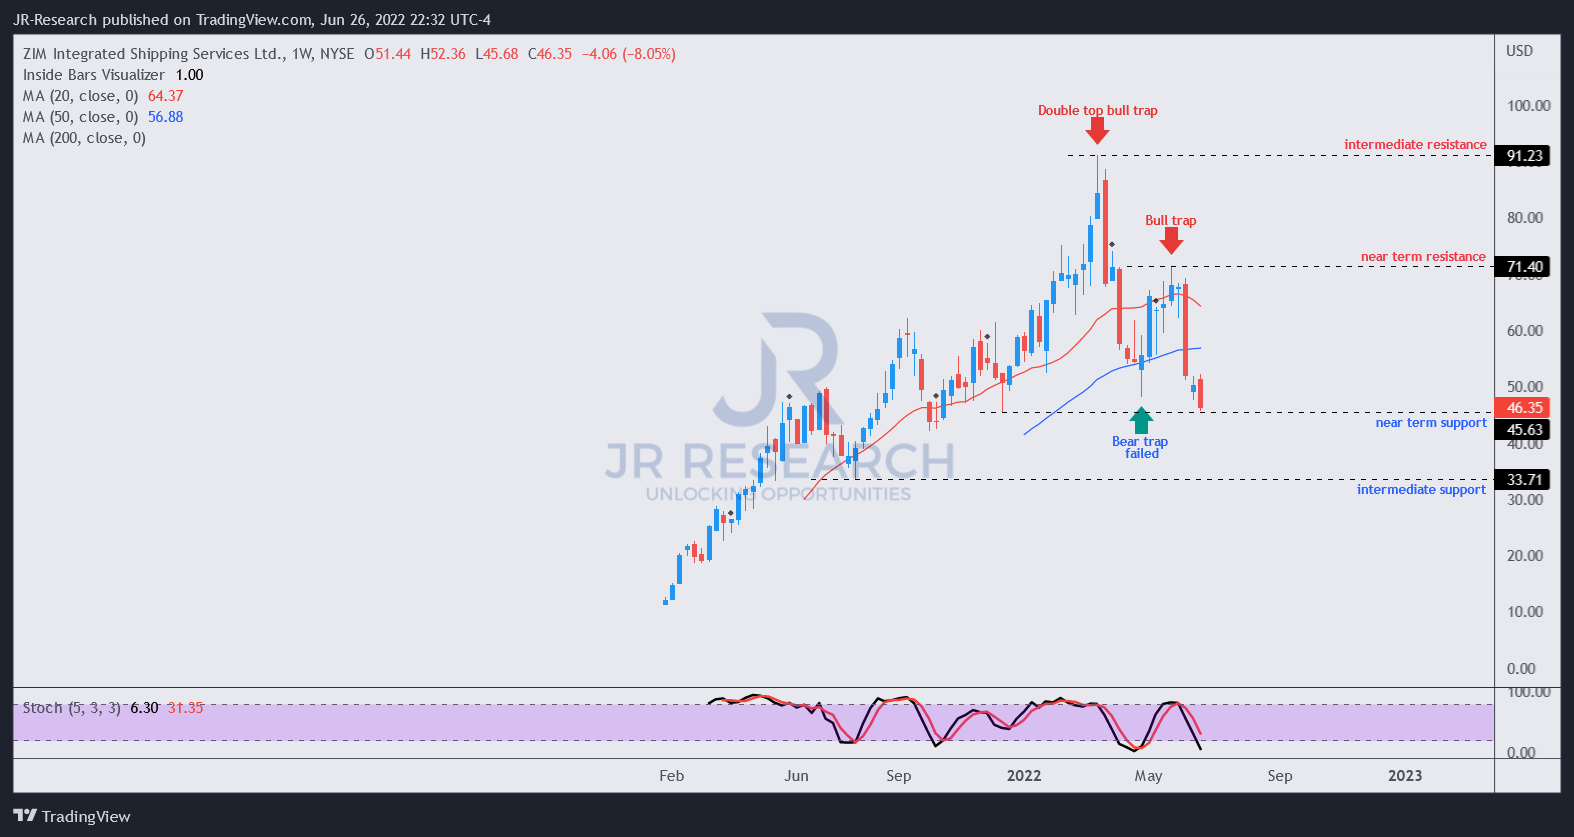
Investors can glean the significant double top in March, which led to a steep sell-off over the next month. Subsequently, a bear trap (significant rejection of selling momentum) formed in late April. We observed that double tops have consistently provided early warning signals of the market’s intention to reverse bullish trends.
Therefore, given their potency, we often accord greater precedence to double tops. As a result, the initial bear traps after a double top should be executed with significant caution. These are price structures that draw in dip buyers for the market to distribute further.
Notably, another bull trap that formed in late May resolved April’s bear trap. May’s bull trap was significant because it created a lower high signal after a double top. Therefore, it added a layer of suspicion that the market did not intend to allow a return to a higher high.
Therefore, the recent steep sell-off in June should not be surprising. It also broke below April’s bear trap, even though it’s likely at a near-term bottom (to draw in more dip buyers). Notably, the market appears to have forced ZIM into negative flow (potentially bearish bias, thus reversing its trend from bullish to bearish).
But, ZIM’s bearish flow has not been validated. Therefore, the price action over the next three to four weeks will be critical to determine whether the market intends to maintain it in a decisive bearish momentum.
Consequently, we urge investors to pay close attention to another lower high bull trap price structure that would likely validate the market’s bearish bias on ZIM stock moving forward.
The Street Is Modeling For A Steep Fall In Revenue and Profitability
Notably, the Street highlighted heightened risks in shipping demand recently. JPMorgan (JPM) also assessed the logistics sector has “asymmetric valuation risk.”
However, these warnings came three months after ZIM formed a double top in March. Therefore, given their forward-looking perspective, we urge investors to pay attention to price structures. We believe they provide vital clues to the forward intentions of the market.
ZIM revenue change % and adjusted EBIT change % consensus estimates (S&P Cap IQ)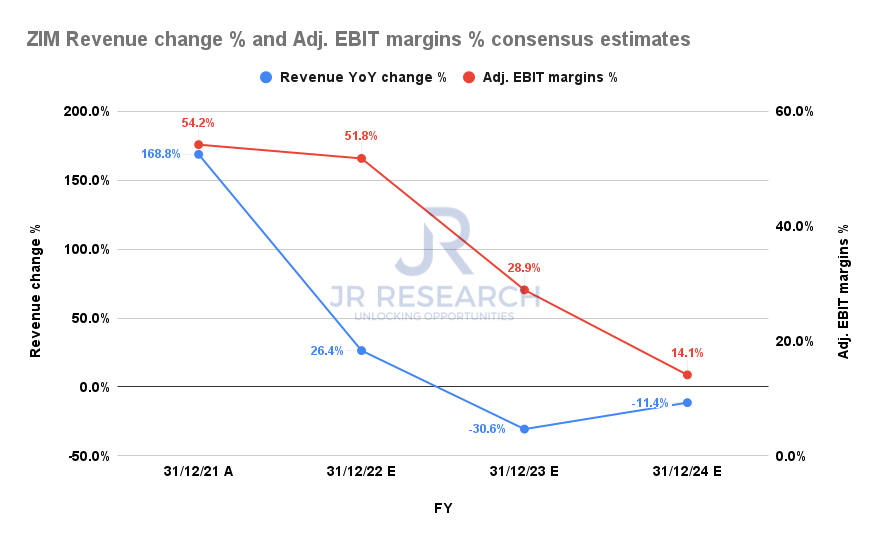
Also, investors need to consider the revised consensus estimates that have modeled for ZIM Integrated’s revenue growth to have peaked in FY21. Notably, the company is projected to post revenue growth of 26.4% in FY22 before falling into negative growth in FY23.
Moreover, its adjusted EBIT margins are expected to be impacted significantly, as seen above, falling to 14.1% in FY24 from FY21’s 54.2%.
ZIM adjusted EPS change % and FCF margins % consensus estimates (S&P Cap IQ)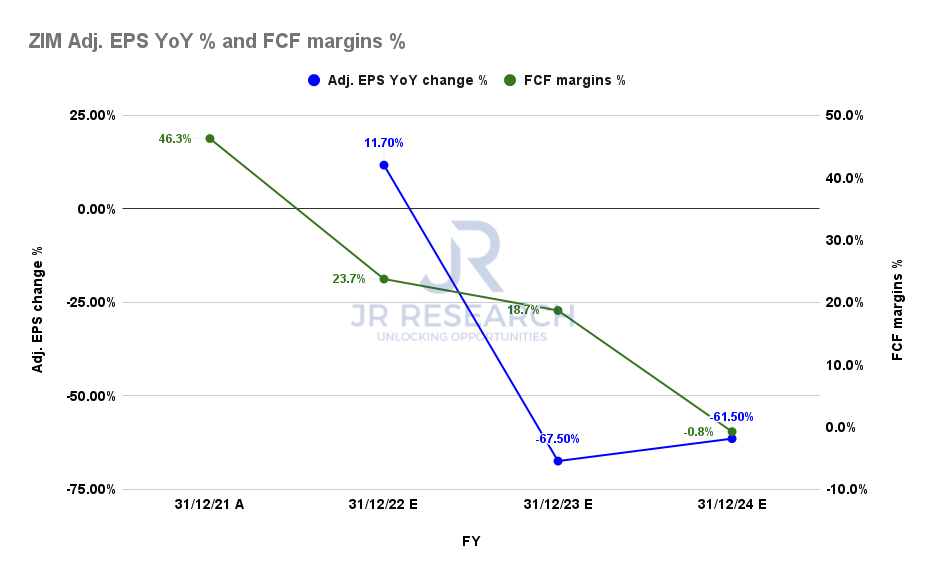
Furthermore, ZIM Integrated’s adjusted EPS growth is estimated to decline from FY23. Notably, those massive free cash flow (FCF) margins that we saw in FY21 (46.3%) is estimated to dissipate by FY24, falling to -0.8%.
Therefore, it should be a red flag that investors need to heed. Coupled with its twin bull traps (including a more potent double top) in March and May, the Street’s prognosis aligns with our price action analysis.
ZIM – Valuation Could Be Impacted Dramatically By Falling Profitability
| Stock | ZIM |
| Current market cap | $5.56B |
| Hurdle rate (CAGR) | 11.9% |
| Projection through | CQ4’26 |
| Required FCF yield in CQ4’26 | 25% |
| Assumed TTM FCF margin in CQ4’26 | 22% |
| Implied TTM revenue by CQ4’26 | $10.48B |
ZIM reverse cash flow valuation model. Data source: S&P Cap IQ, author
ZIM last traded at an NTM FCF yield of 51.4% or an FCF multiple of 1.95x. It’s broadly in line with its peers’ comps, with a median FCF multiple of 1.94x. Therefore, the market has de-rated ZIM and its peers broadly.
Also, we noted that the market formed its double top bull trap at the 40% FCF yield level. In addition, May’s bull trap was formed at the 45% level. Therefore, we believe it has informed us that the market rejected these levels decisively and is asking for higher yields. As such, we think applying a 50% yield requirement in our valuation model is appropriate.
We also applied a market-perform hurdle rate of 11.9%, equivalent to the SPDR S&P 500 ETF’s (SPY) 5Y total return CAGR (adjusted for dividends). Finally, using a blended TTM FCF margin of 22% (Vs. FY24’s estimates of -0.8%), we derived a TTM revenue requirement of $10.48B by CQ4’26.
Given the Street’s modeling for a continued decline in topline growth and profitability, we believe ZIM Integrated is unlikely to meet our revenue target.
Is ZIM Stock A Buy, Sell, Or Hold?
We rate ZIM a Hold. ZIM is likely at a near-term bottom. Therefore, we urge investors considering layering out/cutting exposure to wait for the next short-term rally to sell.
Our price action analysis indicates two potent top bull traps (including a double top in March) had afflicted ZIM’s bullish bias. As a result, the stock has been struggling to regain its bullish momentum. Notwithstanding, we need a few more weeks to validate its change to a bearish bias. However, the price structures don’t augur well.
Our reverse cash flow model suggests ZIM Integrated will unlikely meet our revenue target at its current valuation.